A&A 421, 407-423 (2004)
DOI: 10.1051/0004-6361:20034260
The field surrounding NGC 7603: Cosmological or non-cosmological redshifts?
M. López-Corredoira1 - C. M. Gutiérrez2
1 - Astronomisches Institut der Universität Basel.
Venusstrasse 7. 4102 Binningen, Switzerland
2 -
Instituto de Astrofísica de Canarias, 38205 La Laguna,
Tenerife, Spain
Received 2 September 2003 / Accepted 31 December 2003
Abstract
We present new observations of the field surrounding the Seyfert galaxy NGC 7603,
where four galaxies with different redshifts - NGC 7603 (z=0.029), NGC 7603B
(z=0.057) and two fainter emission line galaxies
(z=0.245 and z=0.394) - are apparently connected by a narrow filament,
leading to a possible case of anomalous redshift.
The observations comprise broad and narrow band imaging and intermediate
resolution spectroscopy of some of the objects in the field. The new data
confirm the redshift of the two emission-line objects found within
the filament connecting NGC 7603 and NGC 7603B, and settles their
type with better accuracy. Although both objects are point-like in ground based images, using
HST archive images we show that the objects have
structure with a FWHM = 0.3-0.4 arcsec. The photometry in the R-band obtained during three
different campaigns spread over two years does not show any signs of variability in
these objects above 0.3-0.4 mag. All the above information and the relative
strength and width of the main spectral lines allow us to classify these as HII
galaxies with very vigorous star formation, while the rest of the filament
and NGC 7603B lack star formation.
We delineate the halo of NGC 7603 out to 26.2 mag/arcsec2 in the Sloan r band
filter and find evidence for strong internal distortions.
New narrow emission line galaxies at z=0.246, 0.117 and 0.401
are also found at respectively 0.8, 1.5 and 1.7 arcmin to the West of the
filament within the fainter contour of this halo.
We have studied the spatial distribution of objects in the field within 1.5 arcmin of NGC 7603.
We conclude that the density of QSOs is roughly within the
expected value of the limiting magnitude
of our observations. However, the configuration of the four
galaxies apparently connected by the filament
appears highly unusual.
The probability of three background galaxies of any type with
apparent B-magnitudes up to 16.6, 21.1 and 22.1
(the observed magnitudes, extinction correction included) being randomly
projected on the filament of the fourth galaxy (NGC 7603)
is 
 .
Furthermore, the possible detection of
very vigorous star formation observed in the HII galaxies of the filament
would have a low probability if they were background normal-giant galaxies;
instead, the intensity of the lines is typical of dwarf HII galaxies.
Hence, a set of coincidences with a very low probability
would be necessary to explain this as a fortuitous projection of background sources.
Several explanations in terms of cosmological or non-cosmological redshifts are discussed.
.
Furthermore, the possible detection of
very vigorous star formation observed in the HII galaxies of the filament
would have a low probability if they were background normal-giant galaxies;
instead, the intensity of the lines is typical of dwarf HII galaxies.
Hence, a set of coincidences with a very low probability
would be necessary to explain this as a fortuitous projection of background sources.
Several explanations in terms of cosmological or non-cosmological redshifts are discussed.
Key words: galaxies: individual: NGC 7603 -
galaxies: statistics - galaxies: peculiar - galaxies: starburst -
cosmology: distance scale
The problem of the apparent optical associations of galaxies with very
different redshifts, the so-called anomalous redshifts (Narlikar 1989; Arp
1987, 1998), is old but still unresolved. Although surprisingly ignored by most of
the astronomical community, there is increasing evidence of examples of such
anomalies. Statistical evidence has grown for such associations over the last
30 years (Burbidge 1996, 2001). For instance, all non-elliptical galaxies
brighter than 12.8 mag with apparent companion galaxies have been examined (Arp
1981), and 13 of the 34 candidate companion galaxies were found to have QSOs
with higher redshift. Given a probability of less than 0.01 per galaxy, the global probability of this to be chance is  10-17. Bias
effects alone cannot be responsible for these correlations (Burbidge 2001;
Hoyle & Burbidge 1996; Benítez et al. 2001). Weak gravitational lensing
by dark matter has been proposed as the cause of these correlations (Gott & Gunn 1974; Schneider 1989; Wu 1996;
Burbidge et al. 1997), although this seems
to be insufficient to explain them (Burbidge et al. 1997; Burbidge 2001;
Benítez et al. 2001; Gaztañaga 2003; Jain et al. 2003), and cannot work
at all for the correlations with the brightest and nearest galaxies. The
statistical relevance of these associations is still a matter of
debate (Sluse et al. 2003).
10-17. Bias
effects alone cannot be responsible for these correlations (Burbidge 2001;
Hoyle & Burbidge 1996; Benítez et al. 2001). Weak gravitational lensing
by dark matter has been proposed as the cause of these correlations (Gott & Gunn 1974; Schneider 1989; Wu 1996;
Burbidge et al. 1997), although this seems
to be insufficient to explain them (Burbidge et al. 1997; Burbidge 2001;
Benítez et al. 2001; Gaztañaga 2003; Jain et al. 2003), and cannot work
at all for the correlations with the brightest and nearest galaxies. The
statistical relevance of these associations is still a matter of
debate (Sluse et al. 2003).
A recent compilation of associations of galaxies-QSOs has been presented by
Burbidge (1996). Some remarkable cases of apparent associations between
objects with different redshift are Arp 220 (Ohyama et al. 1999; Arp et al. 2001),
NGC 1068 (Burbidge 1999a; Bell 2002a), NGC 3067 (Carilli et al. 1989;
Carilli & van Gorkom 1992), NGC 3628 (Arp et al. 2002), NGC 4258 (Pietsch et al. 1994;
Kondratko et al. 2001), NGC 4319 (Sulentic & Arp 1987), etc. Some of these may be just fortuitous
cases in which background objects are close to the foreground galaxy,
although the statistical mean correlations remain to be explained, and some cases
alone have very small probability of being a projection of background objects.
Associations of galaxies with different redshifts might also take place:
forty-three systems among the hundred Hickson (1982) groups of galaxies
(compact groups of galaxies containing four to six members) have one redshift very
different from the mean of the others (Sulentic 1997).
For instance, Stephan's quintet (Moles et al.
1998; Gutiérrez et al. 2002), the chain VV172 (Arp 1987; Narlikar 1989), etc.
Although the numbers, sizes, magnitudes and morphological
types of the discordant redshift members might agree with a scenario
of chance projections, the distribution of
positions in quintets is more centrally concentrated than expected in
such a scenario (Mendes de Oliveira 1995). This author claims
that compact groups might act as gravitational lenses and therefore explain
the difference in concentration, but this remains to be justified.
To explain these associations Hoyle et al. (1993) proposed new physics in which
part of the measured redshifs are not caused by the expansion of the Universe.
Other theories have been proposed too (see Sect. 5.3). We are
carrying out a series of observations of some of the suspicious systems to
clarify the problem (Gutiérrez et al. 2002; López-Corredoira &
Gutiérrez 2002; Gutiérrez & López-Corredoira 2004; and
this paper). In particular, this paper is about the system of NGC 7603 and the
surrounding objects.
Table 1:
Observations.
The main galaxy, NGC 7603, is a broad line Seyfert I galaxy with z=0.0295and B=14.04 mag (de Vaucouleurs et al. 1991). This galaxy has been studied
mainly in relation to its variability, which was discovered by Kopylov et al.
(1974), and Tohline & Osterbrock (1976). Kollatschny et al. (2000) have
presented the results of an extensive programme to study the line and
continuum variability over a period of twenty years. They detected spectral
variations on timescales from months to years. The variability observed is 5-10 in the intensity in the Balmer and Helium lines and in the continuum.
From the perspective of the Eigenvector 1 parameter space for AGNs (Sulentic
et al. 2000, 2002), the Balmer lines are unusually broad and show a very
complex structure. The Balmer lines are blueshifted relative to the local
"rest frame'' of the AGN by between 1000 and 2000 km s-1. Less than 5% of AGN
show such characteristics. Such lines are more common in radio-loud quasars,
where one sees ejected synchrotron lobes. It shows unusually strong FeII emission for an AGN with such broad lines (Goodrich 1989; Kollatschny et al.
2000).
The system around NGC 7603 is very interesting because it is among the cases
(Arp 1980) with some filamentary structure joining galaxies with different
redshift. Arp (1971, 1975, 1980) has claimed that the compact member has
somehow been ejected from the bigger object. NGC 7603 and its filament are so
distorted that significant tidal disturbance can be reasonably assumed,
without a clear candidate for the companion galaxy producing the tides (see
Sect. 3.1). Another fact that has attracted attention (Arp 1971, 1975;
Sharp 1986) is the proximity of NGC 7603B, a spiral galaxy with higher redshift
(z=0.0569) located 59 arcsec to the SE of NGC 7603. The angular
proximity of both galaxies and the apparently luminous connection between them,
makes the system an important example of an anomalous redshift
association. Hoyle (1972) has pointed out that NGC 7603 is one of the most
strange cases, and which needs a non-standard theory to be explained. Apart
from the above facts there are also two in principle point-like objects
superimposed on the filament that apparently connects both galaxies.
In López-Corredoira & Gutiérrez (2002, hereafter Paper I) we presented
intermediate resolution spectra of the filament and the two objects mentioned
(see Fig. 1 of Paper I). From several absorption lines we estimated the
redshift of the filament apparently connecting NGC 7603 and NGC 7603B as
z=0.030, very similar to the redshift of NGC 7603 and probably associated
with this galaxy. We identified several emission lines in the spectra of the
two knots and from the emission lines of H ,
OII (3727 Å) and OIII (4959 and 5007 Å) we determined their redshifts, obtaining 0.39 and 0.24 for the
objects closer and farther from NGC 7603 respectively. The two objects might be
QSOs or HII-galaxies. The spectra of Paper I had not enough resolution to
determine their nature definitively (since we used a wide slit) and the seeing
conditions limited the possibility of seeing structure under 1 arcsec in
these objects. We planned new observations with the aim of answering the
following questions: i) What is the nature of the two knots in the filament?
ii) Are there any other high redshift objects in the halo surrounding NGC 7603? And iii) are there any clues in the surrounding field that help us
understand the nature of this apparent association?
,
OII (3727 Å) and OIII (4959 and 5007 Å) we determined their redshifts, obtaining 0.39 and 0.24 for the
objects closer and farther from NGC 7603 respectively. The two objects might be
QSOs or HII-galaxies. The spectra of Paper I had not enough resolution to
determine their nature definitively (since we used a wide slit) and the seeing
conditions limited the possibility of seeing structure under 1 arcsec in
these objects. We planned new observations with the aim of answering the
following questions: i) What is the nature of the two knots in the filament?
ii) Are there any other high redshift objects in the halo surrounding NGC 7603? And iii) are there any clues in the surrounding field that help us
understand the nature of this apparent association?
This paper contains the analysis of these new observations and is structured
as follows: Sect. 2 presents the details of the observations and
data reduction. Section 3 presents the observed
images, and the main features discovered in each component.
Section 4 presents the spectroscopy of some sources.
Section 5 calculates the probabilities of the observed
configuration being an accidental projection of background galaxies,
and discusses the results presenting some possible
physical scenarios to explain them. A summary of the main results is given
in Sect. 6.
2 Observations
The observations presented here comprise narrow and broad band imaging, and
spectroscopy with intermediate resolution. These observations were taken at
the IAC80![[*]](/icons/foot_motif.gif) , NOT, WHT telescopes, and from the HST archive.
Table 1 presents a summary of the observations.
, NOT, WHT telescopes, and from the HST archive.
Table 1 presents a summary of the observations.
We wanted to check for the presence of H emission in the filament
connecting NGC 7603 and NGC 7603B as well as in the galaxies themselves.
NII (6583 Å) is also interesting and might be stronger if e.g. shocks were
involved; it would be observed in narrow filters of FWHM 50 Å centered at
H emission. During several campaigns in 2000 and 2001 we obtained
imaging at the IAC80 and NOT with the IAC39 and IAC35 filters which are
centred on 6767 and 6931 Å and which match the H
line at velocities
of 9372 and 16 870 km s-1 respectively and have a FWHM equivalent to
2000 km s-1. These ranges in velocity correspond to the redshifts of
NGC 7603 and NGC 7603B respectively. The images were reduced using a standard
procedure that comprises bias subtraction, flat-field correction, shifting and
co-addition of individual exposures. The continuum in each case was subtracted
using a resampled and scaled image (in order to have the same resolution of
the IAC80: 0.435 arcsec pixel-1) in the R band taken on 2000 June 13th at
the NOT.
emission in the filament
connecting NGC 7603 and NGC 7603B as well as in the galaxies themselves.
NII (6583 Å) is also interesting and might be stronger if e.g. shocks were
involved; it would be observed in narrow filters of FWHM 50 Å centered at
H emission. During several campaigns in 2000 and 2001 we obtained
imaging at the IAC80 and NOT with the IAC39 and IAC35 filters which are
centred on 6767 and 6931 Å and which match the H
line at velocities
of 9372 and 16 870 km s-1 respectively and have a FWHM equivalent to
2000 km s-1. These ranges in velocity correspond to the redshifts of
NGC 7603 and NGC 7603B respectively. The images were reduced using a standard
procedure that comprises bias subtraction, flat-field correction, shifting and
co-addition of individual exposures. The continuum in each case was subtracted
using a resampled and scaled image (in order to have the same resolution of
the IAC80: 0.435 arcsec pixel-1) in the R band taken on 2000 June 13th at
the NOT.
With the broad band images we wanted to delineate in detail the halo of the
system NGC 7603-NGC 7603B, to detect other possible candidates in the field
and measure their colours, and to constrain possible variability of the two
objects in the filament. For the study of the variability we took several
images in the R band (Bessel) in the period 2000-2002. For the remaining
tasks, apart from the R filter, we observed the field with the Sloan u, g, r,
and i filters. In all cases we used the NOT with the ALFOSC instrument.
The images were reduced following the standard procedure mentioned above. The
conditions were photometric in all runs except on December 2. For the 2000
June 13th observation, several Landolt calibration fields (Landolt 1992)
were observed. The observations in the other two runs with the R filter at
the NOT (2001 August 12th and 2002 November 30) were relative calibrated with
respect to this using using eight stars in the field. For the Sloan filters,
we have calibrated with some stars from the list given by Smith et al.
(2002).
Because of limiting atmospheric conditions, we could not see details below 1 arcsec
resolution from the ground telescopes images. Therefore, Hubble Space Telescope archive
were also used to obtain a high spatial resolution of the objects embedded in the
filament. These data come from the HST Proposal 5479 made by Matthew Malkan, which was
used to produce the paper Malkan et al. (1998). The image, although less deep (exposure
time: 500 s), allows us to see small scale details of some interesting objects, since
this includes the filament connecting NGC 7603 and NGC 7603B.
We obtained spectroscopy in two campaigns, the first at the NOT using
ALFOSC (presented in Paper I and not considered here)
and the second nearly a year and a half later
using ISIS at the WHT in order to get further and better spectra than in Paper I
and to study other objects in the field. At the WHT we put the slit in three different
positions to optimize the observation of the objects within the filament and
several other objects that were selected according to their colours (see Sect. 3.2).
The grism used was R158R. We took Tungsten, and Cu-Ne and Cu-Ar
calibration lamps for flat-field correction and spectral calibration
respectively. The data were bias subtracted. After some tests we decided not
apply any flat field correction because such corrections would require prohibitive exposure
times with the Tungsten lamp on the blue side of the spectrum and
this correction is very small (1%) in the red part of the spectrum.
The FWHM measured of the lines is 8 Å for the first position,
and 20 Å for the second and third position.
We extracted the spectra using the task apall of IRAF. The data are sampled at
1.62 Å/pixel and
cover from 2810 Å to 10 450 Å. However, due to the response of the grism,
the sensitivity of the first 1000 pixels (below 4400 Å) or the last 700 pixels
(over 9300 Å) is very poor and have not been used in any of the analyses.
3 Imaging
3.1 Morphology and surface photometry
Figure 1 shows the R band image obtained combining the different observations
in this band (see also Fig. 1 of Kollatschny et al. 2000). The figure presents the
grey-scale and isophotal maps in this filter. The high emission due to the activity of
the galaxy NGC 7603 saturates the image in the central part of this galaxy. The system
NGC 7603-NGC 7603B appears to be surrounded by a diffuse halo that we have been able to
delineate out to 26.2 mag/arcsec2 in the Sloan r-band filter. Although this halo
seems to be associated mostly with NGC 7603, it is not symmetric with respect to this
galaxy. There is evidence of a fainter extension tail in northern direction. The last
isophote of the halo is also asymmetric to the West, possibly including a counter arm of
the bright filament between NGC 7603 and NGC 7603B. The halo+filament between NGC 7603
and NGC 7603B shows up clearly and has a maximum brightness of 22.9 mag/arcsec2 in the Sloan
r-band filter, while the halo has a brightness near the filament of 23.4 mag/arcsec2.
Therefore, the filament alone has around 24.0 mag/arcsec2. Another diffuse structure
is seen apparently connecting NGC 7603 and NGC 7603B also, and situated to the South of
the main filament. A point like object (#17 of Fig. 4) situated in
the southest point of this tail has been also observed spectroscopically (see below)
resulting a local star.
![\begin{figure}
\par\includegraphics[width=8cm,clip]{0260fig1.eps}
\end{figure}](/articles/aa/full/2004/26/aa0260/Timg11.gif) |
Figure 1:
A grey scale and contour image in the R band of the region around the
galaxy NGC 7603. The contours correspond to isophotes 24.8, 25.3 and 26.2
mag/arcsec2. |
| Open with DEXTER |
![\begin{figure}
\par\includegraphics[width=7.7cm,clip]{0260fig2.eps}
\end{figure}](/articles/aa/full/2004/26/aa0260/Timg12.gif) |
Figure 2:
A grey-scale R band image and contours corresponding
to H emission at the redshift of the galaxy NGC 7603. |
| Open with DEXTER |
Figure 2 shows a map of contours of the H
emission in the
IAC39 filter (centred on the redshift of the galaxy NGC 7603) once the continuum
(R-filter) is roughly subtracted. No emission was found in the IAC35 filter
(centred on the redshift of the galaxy NGC 7603B), either in NGC 7603B or in
the filament. Only the nucleus of the NGC 7603 (IAC39 filter) shows some
emission, as expected from a Seyfert 1 galaxy. No stripped emission regions (as
found, for instance, in the stripping event in Stephan's quintet;
Sulentic et al. 2001; Gutiérrez et al. 2002) were observed. This absence of Hemission lines in NGC 7603B has already been pointed out by Sharp (1986). The
non-detection of emission lines is not proof against the existence of a physical
connection. In interactions and ejections with a larger galaxy, the gas is often
stripped out of a stellar system (Rose et al. 2001); so the lack of emission
lines could be taken as an indication of interaction rather than non interaction
(pointed out by Sharp 1986).
Figures 1-3 show that NGC 7603 and its
filament are apparently distorted by significant tidal interaction. The existence of the
filament is also a possible sign of tidal interaction or a debris from satellite
disruption (Johnston et al. 2001). The fainter southern filament (the one which crosses
object #17) and the red fringe embedded in NGC 7603 (red colour in Fig.
3; due possibly to dust) reinforces the scenario of tidal debris. The
colours of the filament connecting NGC 7603 and NGC 7603B are
 (equivalent to
 ,
similar to the bridge of the interacting system Arp 96; Schombert et al. 1990) and
,
similar to the bridge of the interacting system Arp 96; Schombert et al. 1990) and
 (like the outer region of NGC 7603).
Finally, we do not detect emission lines in that filament.
(like the outer region of NGC 7603).
Finally, we do not detect emission lines in that filament.
3.2 The neighborhood of NGC 7603
First, we looked for QSOs, since they are typical objects among anomalous redshift
candidates. We try to identify QSOs with z<2.5 in the field using the multicolour
criteria proposed in the analysis of the 2dF Survey (Boyle et al. 2000; Meyer et al.
2001). This criterion, converted into Sloan filters through the relations between the
UBVRI Johnson filters and ugri Sloan filters given by Smith et al. (2002), and the
relation between the photographic filter bj and Johnson filters:
bj=B-0.28 (B-V)
(Meyer et al. 2001); (we adopt the approximation of U, R photographic-filters
equivalent to U, R Johnson-filters) is:
 |
(1) |
The completeness is quite high; this criterion covers 80-90% of all QSOs (Meyer et al. 2001). The principal contamination comes from Galactic stars, subdwarfs and white
dwarfs, and blue compact emission-line galaxies (Croom et al. 2001). The total fraction
of the contaminant sources is 45% (Croom et al. 2001). Therefore, the total
number of QSOs will be 2/3 times the number of objects that follow the
criterion of Eq. (1). This number is slightly different when the range of
magnitudes is different from those of the 2dF survey, but not by too much.
Table 2:
Magnitudes of the objects in the field of NGC 7603 derived
using "Sextractor'' (except those marked with *, which were derived
separately with "phot'' taking care of the filament/halo subtraction
and are affected by an error of at least 0.2 mag). Last column points out
whether they are extended "E'' (as far as we can see from the available images
and spectra; some further faint objects which look point-like might be extended too).
We proceed as follows: first we select all objects in the field detected in
the u filter. There are 38 objects in this filter, including the two knots in the
filament, but excluding NGC 7603 and NGC 7603B. We used the software
"Sextractor'' (Bertin & Arnouts 1996) to measure the photometry of these
objects in the u, g, r, i filters. For the two objects in the filament first we
tried to subtract the contribution of the filament by a two-dimensional surface
fit. Although we tried with different functions, ranges, etc, the result was
not satisfactory partly owing to the presence of the two main
galaxies, but the accuracy in the estimation of the magnitudes for these two
objects is good enough within an uncertainty of 0.2 mag. Also, the
photometry of object #35 was done separately because it was embedded in the
halo of NGC 7603, taking special care in sky subtraction. It is noteworthy
that object #35 has a quite high value of (g-r) = 1.8, while (u-g) = 0; although
it does not follow Eq. (1), it may be a unusual object because of
its colours. Table 2 presents the results on the photometry in u, g, r and i of all the objects, whose positions are shown in Fig. 4. We have no u magnitude for object #1 because it is too
faint in this filter. Figure 5 presents a colour-colour diagram for
these objects, and the regions in which QSOs are expected. We see that objects #19, #23 and #36 follow the criterion of Eq. (1), which is indicated in
Fig. 5.
3.2.1 Galaxies in/behind the filament
We now examine objects 1, 2, either embedded in the filament that joins NGC 7603 and
NGC 7603B or behind the filament. The two objects appear point like in our deep image in the
R band (see above). The field of the filament was observed in the F606W filter with the
Hubble Space Telescope. It does not cover the other three narrow emission line galaxies,
but we can examine how extended the objects are in the filament. Figure 6 shows
this image. The field is centred on the filament between NGC 7603 and NGC 7603B and
clearly shows the two objects within it. Both of them appear as extended objects; this
is specially clear for object #1 (the one closer to NGC 7603). The figure also shows a
contour plot of both objects which confirms the visual impression of both as extended
objects. The FWHMs of objects 1 and 2 are 0.3 and 0.4 arcsec
respectively, which is rather small to be measured in a ground-based telescope with
seeing of 1 arcsec, and seems to indicate that they are extended, rather point-like
objects.
![\begin{figure}
\par\includegraphics[width=7.5cm,clip]{0260fig3.eps}
\end{figure}](/articles/aa/full/2004/26/aa0260/Timg17.gif) |
Figure 3:
Sloan g-r colour of NGC7603. From bluer to redder colours (lower to higher
values of (g-r)):
black-blue-green-red-white.
The center of NGC 7603 is saturated. Noteworthy aspects are the
red colour of an asymmetrical strip crossing NGC 7603, the young population (blue) at the north of NGC 7603
and the average (green) colour of the filament connecting NGC 7603 and NGC 7603B. |
| Open with DEXTER |
![\begin{figure}
\par\includegraphics[angle=-90,width=7.5cm,clip]{0260fig4.ps}
\end{figure}](/articles/aa/full/2004/26/aa0260/Timg18.gif) |
Figure 4:
Position of the sources in Table 2
(only sources with
 except source #1; NGC 7603 and NGC 7603B
not included). With the double circle, we point out the three sources
which follow Eq. (1), candidate QSOs
by the multicolour selection. Dot-dashed lines represent the
position of the three long slits placed in the field of
NGC 7603 to obtain the spectra of some objects.
except source #1; NGC 7603 and NGC 7603B
not included). With the double circle, we point out the three sources
which follow Eq. (1), candidate QSOs
by the multicolour selection. Dot-dashed lines represent the
position of the three long slits placed in the field of
NGC 7603 to obtain the spectra of some objects. |
| Open with DEXTER |
![\begin{figure}
\par\includegraphics[width=7.4cm,clip]{0260fig5.eps}
\end{figure}](/articles/aa/full/2004/26/aa0260/Timg19.gif) |
Figure 5:
Diagrams colour-apparent magnitude and
colour-colour of objects that were selected in
the field of NGC 7603 (Table 2). The open square represents object #2.
Object #1 is not in the plots because we have not its u magnitude.
The lines indicate the limits of (g-r) colour under which
QSOs are likely to be found (there are 3 candidates). |
| Open with DEXTER |
![\begin{figure}
\par\includegraphics[angle=-90,width=6cm,clip]{0260fig6.ps}
\end{figure}](/articles/aa/full/2004/26/aa0260/Timg20.gif) |
Figure 6:
HST image in the F606W filter of the region centred on the filament between
NGC 7603 and NGC 7603B. Also shown are the contours of the two objects in the
filament. Note that there are many bad pixels/cosmic rays in the images that do not correspond to any
object. The PSF is 0.1 arcsec. Dotted lines show the area (around
140 arcsec2) that we consider "filament'' for the calculation of the
probabilities in Sect. 5.2.2. |
| Open with DEXTER |
The two objects in the filament are apparently slightly deformed,
although the significance is not too high (the two lowest isocontours in Fig. 6 are  and
and
 respectively over the
average flux in the region). The tail of object #1 in the
northern part is warped pointing towards NGC 7603; and object #2 has also a
faint tail in the northern part.
respectively over the
average flux in the region). The tail of object #1 in the
northern part is warped pointing towards NGC 7603; and object #2 has also a
faint tail in the northern part.
With the R band imaging we have studied the possible variability of these
objects. In addition to the weakness of these objects, the presence of the
filament makes the estimation of the magnitudes more difficult.
We
have calibrated with standard stars only the R image taken on June 13, 2000,
but we have performed differential photometry of the other images with eight
bright stars in the field. According to the mentioned uncertainties, we conclude the
absence of variability above 0.3-0.4 mag.
Table 3 (Cols. 3 and 4) also shows the magnitudes in the
various Sloan, Johnson and the bj photographic filters. Magnitudes in
Johnson filters and bj photographic filter were calculated from the
magnitudes in Sloan filters for these objects through the relations between
UBVRI Johnson filters and ugri Sloan filters, like in Sect. 3.2.
Table 3:
Apparent magnitudes of objects in the filament between NGC 7603 and NGC 7603B.
The R-Bessel magnitude was measured for three different
epochs, the Sloan filters for only one epoch. Magnitudes in the Johnson filters and
bj photographic filter were calculated from the magnitudes in the Sloan filters (see text).
Columns 3 and 4 give the observed apparent magnitudes (uncertainty 0.2 mag.).
Columns 5 and 6 give the same magnitudes corrected of
Galactic extinction (Schlegel et al. 1998) and filament extinction
(by means of Eqs. (3) and
(4)).
Table 4:
Spectral analysis. The error in the redshift is  0.002. The codes for the last two columns
are: 0-absorption emission line galaxy; 1-narrow emission line galaxy; 2-star;
3-contamination by the filament; 4-spectra
very noisy.
0.002. The codes for the last two columns
are: 0-absorption emission line galaxy; 1-narrow emission line galaxy; 2-star;
3-contamination by the filament; 4-spectra
very noisy.
4 Spectroscopy
The QSO candidates are in general too faint for spectroscopy with a 4.2 m telescope.
We used this telescope: 1) to corroborate and improve the
spectra of both objects (z=0.24 and z=0.39) in the filament; 2) to obtain the redshift and classifications of some
other objects in the halo of NGC 7603 (objects like #17, #21, #22 were interesting because of the peculiar position that they occupy with respect the halo and filaments
of NGC 7603; (Fig. 1 shows that these sources lie within the halo of NGC 7603);
3) to observe AGN candidates which are not too faint.
Table 4 summarizes the objects crossed by the three positions
of the slit and a summary of the analysis of the spectra. Only the intense
lines were used to determine the redshift. Figure 4 plots the
positions of these slits. The spectra of the filament is poor because the slit
in position 1 does not exactly crosses the maximum flux region of the
filament, and the width of the slit (1.2 arcsec) is small compared with the
slitwidth of 5 arcsec used in the observations taken with the NOT and presented
in Paper I ([OIII] detections reported in Fig. 2b of Paper I were spurious).
The main spectral features of these objects corrected for redshift
and the new ones (objects #21, #22, #23) are shown in Fig. 7.
All of them are narrow emission line galaxies.
Table 5 gives the values of the equivalent widths of the different lines.
Apart from the errors in the table due to noise in the
spectra, these equivalent widths are subject to the possible errors in the subtraction
of the sky emission(+filament in objects #1, #2). Although
the absolute values of EWs can only be
taken as a rough approximation, the ratio of close lines is rather exact (because here
the uncertainties in the continuum cancel). Roughly, the error would be a factor 2 for
the continuum in the worst of the cases (assuming the error in the subtraction of the
sky+filament is equal to its Poissonian noise), which means that in the worst of the
cases the error of EW is a factor two, too.
The spectral classification of narrow emission line galaxies is usually made
through the flux ratios of specific
lines corrected of reddening, assuming a constant intrinsic ratio for
 .
However, this ratio changes when the physical situation in the
galaxies does not obey a simple model moreover, we have extinction from the dust in the own galaxy
plus the extinction of the filament in cases of #1 and #2, and some minor contribution
from the Galactic
extinction, which are difficult to separate. To classify
the galaxies, we use the ratios of lines that are close in wavelength. The difference between the
flux ratio and the equivalent width ratio is neglected.
The spectral classification criteria is based on the ratios
.
However, this ratio changes when the physical situation in the
galaxies does not obey a simple model moreover, we have extinction from the dust in the own galaxy
plus the extinction of the filament in cases of #1 and #2, and some minor contribution
from the Galactic
extinction, which are difficult to separate. To classify
the galaxies, we use the ratios of lines that are close in wavelength. The difference between the
flux ratio and the equivalent width ratio is neglected.
The spectral classification criteria is based on the ratios
 and
and
 (given in Table 5)
(Veillux & Osterbrock 1987; Filippenko & Terlevich 1992;
Dessauges-Zavadsky et al. 2000), and gives the result that the objects in
Table 5 are HII-galaxies except object #21, which might be either a HII-galaxy or a LINER (since its
continuum is strong and the emission lines are faint,
it might be a "Low Luminosity Active Galactic Nuclei''; Maoz et al. 1998).
(given in Table 5)
(Veillux & Osterbrock 1987; Filippenko & Terlevich 1992;
Dessauges-Zavadsky et al. 2000), and gives the result that the objects in
Table 5 are HII-galaxies except object #21, which might be either a HII-galaxy or a LINER (since its
continuum is strong and the emission lines are faint,
it might be a "Low Luminosity Active Galactic Nuclei''; Maoz et al. 1998).
![\begin{figure}
\par\includegraphics[width=7.4cm,clip]{0260fig7.eps}
\end{figure}](/articles/aa/full/2004/26/aa0260/Timg48.gif) |
Figure 7:
Main spectral features (corrected for redshift) of objects #1
(z=0.245, in the filament), #2 (z=0.394, in the filament), #21
(z=0.117), #23 (z=0.246) and #22 (z=0.401). Dashed horizontal lines
below the spectra are their zero-flux levels. Dashed vertical lines indicate the position
of the main spectral features. |
| Open with DEXTER |
4.1 Galaxies in/behind the filament
The HII-galaxies embedded in the filament, #1 and #2, seem to be indeed quite peculiar
star-forming galaxies. The very intensive
 (equivalent width: EW(H
 Å and 160 Å resp.),
if correct (i.e. if the continuum is really as low as obtained by us
and the sky+filament subtraction has not changed the level of the continuum; roughly, error of EW should be
a factor two at most), would be indicative of a vigorously star-formation galaxy.
Only 2% and 1% of the normal HII-galaxies have a so high EW(H)
(Carter et al. 2001).
However, if they were dwarf HII-galaxies, these high EWs would be within the normal expected values.
The mean intrinsic colour of these objects is
(B-V)0=0.22 mag and
Å and 160 Å resp.),
if correct (i.e. if the continuum is really as low as obtained by us
and the sky+filament subtraction has not changed the level of the continuum; roughly, error of EW should be
a factor two at most), would be indicative of a vigorously star-formation galaxy.
Only 2% and 1% of the normal HII-galaxies have a so high EW(H)
(Carter et al. 2001).
However, if they were dwarf HII-galaxies, these high EWs would be within the normal expected values.
The mean intrinsic colour of these objects is
(B-V)0=0.22 mag and
 resp. (with a dispersion of
0.10 mag, plus an error of 0.15 mag due to the factor 2-error in the value of EW;
total: 0.2 mag) (Kennicutt et al. 1994, Fig. 2a).
resp. (with a dispersion of
0.10 mag, plus an error of 0.15 mag due to the factor 2-error in the value of EW;
total: 0.2 mag) (Kennicutt et al. 1994, Fig. 2a).
Table 5:
Equivalent widths (in angstroms) of the emission lines of the five observed
narrow emission line galaxies. Errors include a rough
determination of the noise and the error in the determination of the continuum, but do not
include the error in the subtraction of the sky(+filament in objects #1, #2).
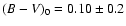
We apply the correction of extinction for the flux of these objects in the following way.
First, we derive the observed (B-V)0 in the reference system
of the galaxy [i.e. we calculate the equivalent (B-V) in the redshifted
wavelengths; we do this through the calculation of the flux in the corresponding wavelengths of the
redshifted B and V filters given the UBVRI fluxes; this is equivalent to make the k-correction].
These are:
(B-V)0=0.58 (object #1)
and
(B-V)0=0.45 (object #2). We neglect the difference between the colours of a face-on galaxy
and other inclinations. Therefore, the differences between these measured colours and the colours expected
for these HII-galaxies with the corresponding
![$EW\rm (H\alpha +[NII])$](/articles/aa/full/2004/26/aa0260/img93.gif) are:
are:
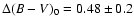 (object #1) and
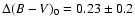 (object #2).
We assume that the measure of the colour has negligible error (the absolute magnitude in each filter
has 0.2 mag. of error, due to the contamination of the filament, but in the measure of the colour,
since the technique to decontaminate the influence of the filament is the same, this error cancels).
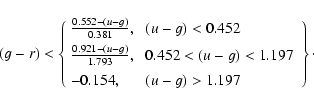
We attribute these differences to the extinction produced by the filament
(
(object #2).
We assume that the measure of the colour has negligible error (the absolute magnitude in each filter
has 0.2 mag. of error, due to the contamination of the filament, but in the measure of the colour,
since the technique to decontaminate the influence of the filament is the same, this error cancels).
We attribute these differences to the extinction produced by the filament
(
 )
plus the Galactic extinction (z=0):
)
plus the Galactic extinction (z=0):
The Galactic reddening is relatively
low: [
![$A_{\rm Gal.}[\lambda _B(1+z)]-A_{\rm Gal.}[\lambda _V(1+z)]=0.03$](/articles/aa/full/2004/26/aa0260/img100.gif) for both objects according to Schlegel et al. (1998) maps of extinction.
Assuming a reddening due to the filament similar to the Galactic dust (
for both objects according to Schlegel et al. (1998) maps of extinction.
Assuming a reddening due to the filament similar to the Galactic dust (
 from
Mathis 1990), we get
from
Mathis 1990), we get
![\begin{displaymath}A_{\rm fil.(obj.\ \char93 1)}[\lambda '=\lambda /(1+z_{\rm fil})]=(2.0\pm 0.9)\frac{A(\lambda ')}{A(\lambda _V')}
,\end{displaymath}](/articles/aa/full/2004/26/aa0260/img102.gif) |
(3) |
and
![\begin{displaymath}A_{\rm fil.(obj.\ \char93 2)}[\lambda '=\lambda /(1+z_{\rm fil})]=(0.9\pm 0.9)\frac{A(\lambda ')}{A(\lambda _V')}\cdot
\end{displaymath}](/articles/aa/full/2004/26/aa0260/img103.gif) |
(4) |
The corrected magnitudes, including Galactic and filament extinction
correction, are given in Table 3.
The calculation of the absolute magnitudes, for instance for the filter V,
can be carried out by means of:
![\begin{displaymath}M_V=m_{\rm corr.ext.}[\lambda _V(1+z)]-5\log (D_{\rm Mpc})-25
,\end{displaymath}](/articles/aa/full/2004/26/aa0260/img104.gif) |
(5) |
![$\displaystyle D_{\rm Mpc}=\frac{c(1+z)}{H_0}
\int _0^z \left[(1+x)^2(1+\Omega _Mx)-x(2+x)\Omega _\Lambda \right]^{-1/2}{\rm d}x
.$](/articles/aa/full/2004/26/aa0260/img105.gif) |
|
|
(6) |
We assume H0=71 km/s/Mpc,
 ,
,
 (derived
from WMAP data; Bennett et al. 2003). If we consider the redshifts as indicators
of the cosmological distance:
(derived
from WMAP data; Bennett et al. 2003). If we consider the redshifts as indicators
of the cosmological distance:
 ,
,
 .
If we considered an anomalous intrinsic redshift case (in
such a case, to derive the distance we set
.
If we considered an anomalous intrinsic redshift case (in
such a case, to derive the distance we set
 ), the
results are:
), the
results are:
 ,
,
 .
In
this second case, they would be in the faint tail of the HII-galaxies, type II
(Telles & Terlevich 1995); they would be dwarf galaxies, "tidal dwarfs'' as
in Stephan's Quintet (Lisenfeld 2002) but with anomalous redshifts, and this
would explain the observed strong star formation ratio: objects with low
luminosity have higher EW(H)
(Carter et al. 2001). Teplitz et al.
(2003) show examples of compact emission line galaxies with very high
EW(H)
and absolute filterless magnitudes between -14 and -15 (e. g.,
SPS J082344.12+292351.3).
.
In
this second case, they would be in the faint tail of the HII-galaxies, type II
(Telles & Terlevich 1995); they would be dwarf galaxies, "tidal dwarfs'' as
in Stephan's Quintet (Lisenfeld 2002) but with anomalous redshifts, and this
would explain the observed strong star formation ratio: objects with low
luminosity have higher EW(H)
(Carter et al. 2001). Teplitz et al.
(2003) show examples of compact emission line galaxies with very high
EW(H)
and absolute filterless magnitudes between -14 and -15 (e. g.,
SPS J082344.12+292351.3).
With these new spectra, we confirm the redshifts of objects #1 and #2
observed in Paper I, and furthermore we detect
the H emission line in the spectra of both objects. Now it is
possible to obtain a more accurate estimation of the linewidth of each object.
The possible classification of both objects as QSOs in Paper I (indeed, we
claimed that they were compact emission line objects, either QSOs or
HII-galaxies) is not confirmed here. In Paper I, we had not analysed HST data
so we could not see whether the objects had any extension. In Fig. 3 of Paper I, we pointed out that the
 line in object #2 had a FWHM of 49 Å while the forbidden lines had 30 Å in these low resolution spectra;
the same was observed for object #1 with poorer signal/noise. However,
in the present WHT-telescope higher resolution spectra, we have not observed
this relative broadening, so we think that the apparent excess broadening
of H
in Paper I was an artefact due to noise.
line in object #2 had a FWHM of 49 Å while the forbidden lines had 30 Å in these low resolution spectra;
the same was observed for object #1 with poorer signal/noise. However,
in the present WHT-telescope higher resolution spectra, we have not observed
this relative broadening, so we think that the apparent excess broadening
of H
in Paper I was an artefact due to noise.
In Paper I, we made a rough measurement of the parameter R23 directly from ratios of equivalent widths; however, line fluxes corrected
for reddening would be necessary. The results presented in this paper by making
use of EWs of close lines give in any case the same conclusion: they are HII galaxies
(provided that they have narrow lines).
The slight differences in the R-magnitude (0.2 and 0.1 mag respectively) with respect to
the values presented in Paper I are caused by differences in which the filament was
subtracted and are within the errors. In Paper I, it was claimed that the objects have
mbj<21.9 (corrected for extinction), and this is correct, but for a reason
different from the arguments given in Paper I. They are intrinsically blue, but because
of the extinction they are observed as red (
(B-V)0=0.10 and 0.22 respectively for
objects #1 and #2 corrected for extinction and the k-correction) instead of blue as
claimed in Paper I.
Thus we confirm the main results of Paper I, except for the possible classification of
objects #1 and #2 as QSOs.
5 Analysis
According to the results in Sect. 3.1, some close and not very faint
neighbour must be in the surroundings of NGC 7603. If we assumed that NGC 7603B
and NGC 7603 have the same distance, this filament would be clearly due to the
interaction between them. Are there other possible candidates?
There is a galaxy with similar redshift, one magnitude fainter, and
10.3 arcmin from NGC 7603: NGC 7589; or B231533.01-000313.1, three magnitudes
fainter and 12.6 arcmin of distance. However, both of them are in the
opposite direction of the filament (to the west instead of the east). We do
not find any other appropriate candidate for the interaction in the
surrounding 30 arcmin. Nonetheless, we cannot be sure that this companion
object does not exist until we perform spectroscopy of all the surrounding
objects around NGC 7603. For instance, galaxy #29 (see Fig. 4 and Table 2) is four magnitudes fainter than
NGC 7603 in the B-filter, it has an angular distance of 2.5 arcmin (linear
distance larger than 100 kpc) and it seems to be in the direction of the tail
which is extended towards the north; it might be a candidate to
produce the tidal disturbances. Johnston et al. (2001) in their Eq. (11)/Fig. 6
calculate the expected surface brightness magnitude in such cases. Assuming
t>1 Gyr, a mass-to-light ratio of 10, the rotation velocity from NGC 7603 of 200 km s-1 in the outer disc, and a distance of the satellite of 100 kpc, the
observed surface brightness in R of the filament should be >27 mag/arcsec2; however we observe that it is 24 mag/arcsec2. Therefore, it
seems unlikely but remains a possible solution within a standard cosmological
redshift hypothesis scenario.
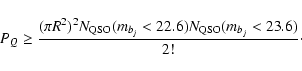
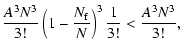
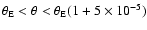
In Sect. 3.2, we concluded that there are three objects that follow
Eq. (1) within a radius R=1.5 arcmin from the center of NGC 7603 (the distance to object #36). One of these (object #23) is not a QSO
(see Sect. 4). The other two were too faint to be observed
spectroscopically. Therefore, we have at most two QSOs in the field of NGC 7603
(other extra QSOs are possible, but with a low probability because the
multicolour criterion covers 80-90% of all QSOs (see Sect. 3.2)) with
mbj=22.6, 23.6 (respectively for objects #19 and #36; derived from
Sloan filter information as in Sect. 4.1).
The probability for such a event is (assuming roughly that pi, the
probability for the detection of each QSO, follows
 ):
):
 |
(7) |
According to the QSO counts from Eq. (A.3), the probability
is
 ,
so one might expect these
background QSOs to occur by chance (2.2-
,
so one might expect these
background QSOs to occur by chance (2.2- at most, if both candidates are
confirmed as QSOs).
at most, if both candidates are
confirmed as QSOs).
5.2.2 Probability of NGC 7603 and its 3 companions being
a chance projection effect
From Fig. 1 of Paper I and Figs. 4 or 6 of this paper, it
seems extremely improbable that four objects at different distances can show a chance
projection in the way these figures reveal. Statistics have been calculated in several
ways for some time concerning the anomalous redshift problem (e.g., Arp 1981, 1999a;
Burbidge et al. 1997), to assess the probabilities of peculiar configurations. However,
many other authors (e.g., Noerdlinger 1975; Sluse et al. 2003) have suspected that these
calculations are inappropriate. Some authors also say that one should not carry out a
calculation of the probability ("a posteriori probability'') for an a priori known
configuration of objects (for instance, that they are aligned, or that they form a
certain geometrical figure) because all possible configurations are peculiar and unique.
The real question is to look for peculiarities associated with peculiar physical
representations, not just peculiarities in the sense of being unique.
For our case, we will use a simple fact: the connection of four objects throughout a
filament. This aspect represents a physical peculiarity, not because of their uniqueness
but because they could be better represented by an alternative theory claiming that the
four galaxies are at the same distance, three of them ejected with the filament by the
parent galaxy NGC 7603. The question is as follows: what is the probability, P, of the
apparent fact arising from a random projection of sources with different distances?
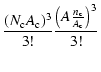
NGC 7603 has a filament of area A, the probability of having three further independent
sources, with the corresponding magnitudes of the objects 1-3, projected on that filament
is (assuming that the individual probabilities for each event pi follow
 ):
):
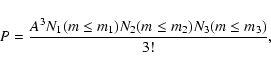 |
(8) |
where Ni is the source density on the sky for the type of sources of object i with apparent magnitude in a given filter (corrected for Galactic+filament extinction) less than mi. We use filter B, but the statistics would give
similar results for any filter. Some authors (e.g., Sluse et al. 2003,
hypotheses H2-H3) use in the calculation of the probabilities the limiting
magnitude of the survey instead of the magnitude of the object, which gives a
higher probability. However, this is not totally correct because, randomly,
one would expect most of the detected objects to be close to the limiting
magnitude. If this method is followed, the magnitude of the object and the
limiting magnitude of the survey are very close and there are no major
differences in the calculation; but, if the magnitude of the object is much
brighter than the limiting magnitude one should multiply P by a factor that
characterizes the probability this object being much brighter than the
limiting magnitude (the brighter it is, the lower the probability), and this is
equivalent to using the magnitude of the object. So we think that the Sluse et al. (2003) hypotheses H2-H3 are inappropriate.
The area of the filament is approximately 35 arcsec in length multiplied by
4 arcsec in width (the area plotted in Fig. 6):
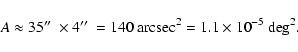 |
(9) |
We are not going to use other peculiarities of the system like i/ objects #1 and #2 are positioned where the filament contacts NGC 7603B and NGC 7603
respectively ii/ objects #1 and #2 are HII-galaxies iii/ the
distribution of redshifts (from major to minor). If we took these facts into
accounts, the probability P would be somewhat lower.
NGC 7603B is a galaxy with
mB,1=16.6 (Sharp 1986, corrected only for
Galactic extinction; it would be less if the foreground filament produced any
extinction in the galaxy). The magnitudes corrected for extinction of the two
HII-galaxies are:
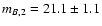 and
and
 .
With the
counts given by Eq. (A.2), the deduced probability is
.
With the
counts given by Eq. (A.2), the deduced probability is
 |
(10) |
The error is large, due to the uncertainty of 1.2 mag in the
objects #1 and #2, but the order of magnitude does not change too much. This
means that we have a probability of a few times 10-9 of finding three
galaxies of any type by chance with different distances projected on a filament
(an arm or another structure) with an area of 140 arcsec2 of an arbitrary
galaxy with respective apparent magnitude (corrected for extinction) less than
or equal 16.6, 21.1, 22.1 respectively, and somewhat higher if the magnitudes
are up to 1.2 fainter in the last two objects. If there were no filament
extinction at all, the value of  would be -7.1. There are no bias selection
effects because we have used complete galaxy counts
from complete surveys up to a given magnitude (Appendix A). Certain
facts that could make the probabilities calculated above larger are discussed in
Sect. 5.3.1.
would be -7.1. There are no bias selection
effects because we have used complete galaxy counts
from complete surveys up to a given magnitude (Appendix A). Certain
facts that could make the probabilities calculated above larger are discussed in
Sect. 5.3.1.
We could multiply P by the probability
of having extremely vigorous star formation
in the two HII-galaxies, P2.
The calculation of P2 (with probabilities 1% and 2%
for each galaxy, as said in
Sect. 4) is
 |
(11) |
There is near independence between both probabilities, so the global probability
is the product of P and P2. There is a correlation between absolute
magnitudes and the
star formation ratio: the fainter the HII-galaxy, the higher is the star
formation ratio (Carter et al. 2001). Teplitz et al. (2003) find in their sample that many galaxies
have large values of EW(H)
but their objects
are in general intrinsically fainter. However, if we accept the cosmological redshift hypothesis,
our two HII-galaxies would have average or high luminosities (absolute
magnitudes in V from -19 to -22); therefore, it is not possible to have an enhancement of the probability due to
some selection effect (neither the Malmquist bias nor the opposite one).
We will not consider the low value of P2 until we can have more accurate measures
of EWs, and we will only discuss the probability P quoted above.
According to SIMBAD there are 237 AGN-galaxies in all the sky with a Bmagnitude less than 14.0 (the magnitude of NGC 7603; de Vaucouleurs et al.
1991). Therefore, the probability to have an AGN with a B magnitude up to 14.0 with the cluster of coincidences that we observe in NGC 7603 is:
 |
(12) |
Considering all the galaxies independently of whether they are AGNs or not,
according to SIMBAD there are 3655 galaxies with mB<14.0, so the
probability to have the observed configuration around NGC 7603 would be:
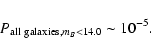 |
(13) |
This assumes that all the galaxies have some filament/arm like NGC7603 to find
the background objects, which is not necessarily the case, so we are
overestimating the probabilities. These probabilities are calculated assuming
that there is only one case with this cluster of chance circumstances.
However, cases like 3C 212 (Stockton & Ridgway 1998), NGC 3067 (Carilli et al.
1989; Carilli & van Gorkom 1992), NGC 3628 (Arp et al. 2002); NGC 1232,
NGC 4151 or NGC 622 (Arp 1987) or the cases mentioned in Arp (1980) also present
some filaments/arms that have at their ends, or somewhat beyond the end in the
direction of the filament, some galaxy or QSO with different redshift (Note:
many of these examples have however magnitude large than 14.0 in B). Another
possible example is the tail between NGC 7320 and NGC 7318 in Stephan's
Quintet (Moles et al. 1998; Gutiérrez et al. 2002; Williams et al. 2002). In
some of these tails the presence of dwarf galaxies looking like objects 1 and 2
has been discovered even at relatively large distances from the disrupted
galaxy (Gallagher et al. 2001) so, again, we are overestimating the
probability.
It is remarkable that the presence of the filament gives the configuration a low
probability, but even without taking into account the presence of the filament, the
probability is low. Given a square of diagonal 59 arcsec (the separation
between NGC 7603 and NGC 7603B), the chance of having four galaxies with magnitudes
in the B-filter of 13.8 (the magnitude of NGC 7603 corrected for extinction), 16.6, 21.1 and 22.1 would be
 (again with Poissonian statistics and the
counts given by Eq. (A.3)). There are
(again with Poissonian statistics and the
counts given by Eq. (A.3)). There are
 squares like this on the whole
sky, so the probability of finding only one square in the whole sky with this congregation of
four objects of different distances is
squares like this on the whole
sky, so the probability of finding only one square in the whole sky with this congregation of
four objects of different distances is
 .
.
5.3 Possible explanations for the low probability observed configuration
Possible scenarios to explain the present case of NGC 7603 depend on
the possible explanations for the redshift of the objects (Narlikar 1989;
Hoyle & Burbidge 1996): cosmological (with the observed configuration
due to clusters in the line of sight, or gravitational lensing), Doppler, gravitational or others.
5.3.1 Clusters in the line of sight?
If we have found a line of sight with many clusters of galaxies, that
would increase significantly the density of sources with respect to a Poissonian
distribution. However, a configuration in
which our line of sight crosses three clusters of galaxies at different
redshifts (z=0.056, z=0.245 and z=0.394) is not justified because the
increase in the probability due to the increase of the density in lines of
sight with clusters is compensated for by the additional factor to be multiplied
by P to take into account the probability of finding
clusters in the line of sight. On average, in all the arbitrary lines of sight
of the sky, the probability will be given by the above value of P.
Let us assume that
the clusters in the sky have the same size,  ,
a Poissonian distribution,
and the same number of galaxies up to a given magnitude,
,
a Poissonian distribution,
and the same number of galaxies up to a given magnitude,  (galaxies/cluster). This is a very rough model, because it is clear that and
depend on the redshift; however, for our present arguments, the
estimation with mean values of
and
is enough. In such a case, the
total number of galaxies, N, is:
(galaxies/cluster). This is a very rough model, because it is clear that and
depend on the redshift; however, for our present arguments, the
estimation with mean values of
and
is enough. In such a case, the
total number of galaxies, N, is:
 |
(14) |
where  is the density of field galaxies (galaxies/deg2) and
  is the density of clusters (clusters/deg2).
An example of a probability calculation would be the one to have
three galaxies belonging to three different clusters in the area A (we assume that they have the same magnitude, for a simplistic calculation,
although it can be generalized to any magnitude distribution), i.e.
the probability of three clusters being in the
line of sight multiplied by the probability of three galaxies
from different clusters being in the area A of the filament given the density
of galaxies in a cluster,
is the density of clusters (clusters/deg2).
An example of a probability calculation would be the one to have
three galaxies belonging to three different clusters in the area A (we assume that they have the same magnitude, for a simplistic calculation,
although it can be generalized to any magnitude distribution), i.e.
the probability of three clusters being in the
line of sight multiplied by the probability of three galaxies
from different clusters being in the area A of the filament given the density
of galaxies in a cluster,
| P |
= |
 |
|
| |
= |
 |
(15) |
that is, the probability is lower than
 ,
which is
the probability we calculated in (8). Therefore, the supposition
of a line of sight with three clusters would make
the probability smaller instead of larger, and similarly for a lower
number of clusters.
,
which is
the probability we calculated in (8). Therefore, the supposition
of a line of sight with three clusters would make
the probability smaller instead of larger, and similarly for a lower
number of clusters.
Indeed, it is not likely to find clusters of galaxies at z=0.245 and z=0.391, in spite
of the two pairs of HII-galaxies with close redshifts,
because HII-galaxies are much less common in clusters than in field galaxies
(Gisler 1978; Dressler et al. 1985; Biviano et al. 1997).
Nonetheless, although the low probabilities cannot be justified by this
scenario of clusters, and although the high star formation ratios seem
to point in the opposite direction, we also have object #23 with nearly
the same redshift as object #2, and object #22 with a difference of 0.007
in redshift with respect to object #1. Perhaps they form small groups of galaxies with separations
of 0.5 or 2 Mpc (for the pairs at z=0.25 and z=0.40 respectively).
We have considered above
that the distribution of clusters is Poissonian;
it might be that we have detected two or
three clusters in the line of sight for some special reason.
Could our line of sight be tangential to a wall or sheet within the
large scale structure, for instance? This seems difficult to imagine, since
we would need a wall of size 2 Gpc. The Hydro-Gravitational Theory
(Gibson 1996; Gibson & Schild 2003) would claim
that the members of a cluster (NGC 7603, NGC 7603B, object #1 and object #2)
formed together, and that they remained together until
the uniform expansion of space in the universe finally overcame the gravitational
and frictional forces of the cluster, and the different galaxies separated
with very small transverse velocity with respect to the line of sight because of
the halo gas friction and their sticky beginning.
The stretching would be along a pencil beam of length 2 Gpc in the line
of sight by the expansion of the universe, but a
preferred direction of the expansion instead of an isotropic expansion is
not justified.
A better explanation might in principle be found if we considered some kind of gravitational
lensing. For instance, amplifications up to a factor 30 are expected
(Ellis et al. 2001) for background objects apparently close to the central parts
of massive clusters. The effect produced by an individual galaxy like NGC 7603 should be much
smaller, and the low redshift galaxy (z=0.029) NGC 7603,
as the putative lens of very distant sources (z=0.245 and z=0.394)
would have a very small amplification because of the large angular distance of the
sources. Given a galaxy with Einstein radius
 ,
the enhancement
in the density of background objects as a function to the angular distance,
,
the enhancement
in the density of background objects as a function to the angular distance,
 ,
to this galaxy will be (Wu 1996):
,
to this galaxy will be (Wu 1996):
![\begin{displaymath}q_Q(\theta )=\frac{N[m<m_{b,lim}+2.5\log \mu (\theta )]}{N(m<m_{b,lim})}\frac{1}{\mu (\theta)}
,\end{displaymath}](/articles/aa/full/2004/26/aa0260/img143.gif) |
(16) |
where  is the magnification factor (Wu 1996),
 |
(17) |
To have a value of P that is not very low, we would need this to be
103-106 higher, i.e. an average enhancement of 10-100 in
density for each of the galaxies. With the counts of Eq. (A.2),
for the lowest enhancement, this requires an average magnification of
 of
of
 .
We would need to be in the ring
.
We would need to be in the ring
 ,
which is very narrow with a
very low probability; so again the problem is not solved by this artefact. It
is clear from Eq. (16) that the density of sources does not
increase so quickly unless the counts increase extremely quickly with the
limiting magnitude, which is not the case. The enhancement
in the source counts increases because of the flux increase of each source but
decreases because of the area distortion, which reduces the number counts by losing
the sources within a given area (Wu 1996).
,
which is very narrow with a
very low probability; so again the problem is not solved by this artefact. It
is clear from Eq. (16) that the density of sources does not
increase so quickly unless the counts increase extremely quickly with the
limiting magnitude, which is not the case. The enhancement
in the source counts increases because of the flux increase of each source but
decreases because of the area distortion, which reduces the number counts by losing
the sources within a given area (Wu 1996).
In our case, since the distance of the sources to the centre of NGC 7603 is
0.5-1 arcmin, we would need either a very large value of the Einstein radius
of the gravitational lens placed in the centre of NGC 7603, which would require
a huge mass (for instance, an average E/S0 galaxy has a
 arcsec, Wu 1996), or that the gravitational lenses be not so massive but much
closer to the magnified objects. The first possibility may be automatically
rejected, since even in the case that NGC 7603 had the mass of a cluster of
galaxies, the magnification would affect at most only one of the three
objects in the filament, the one closer to its Einstein radius. The second
hypothesis, the possibility that multiple minilenses are distributed in the
halo of the galaxy, has already been proposed: gravitational mesolensing by King
objects (Baryshev & Bukhmastova 1997; Bukhmastova 2003). The strong
gravitational lensing would be produced by King lenses: globular clusters
(Bukhmastova 2003), dwarf galaxies, or clusters of hidden mass with masses
between 103 and 109
arcsec, Wu 1996), or that the gravitational lenses be not so massive but much
closer to the magnified objects. The first possibility may be automatically
rejected, since even in the case that NGC 7603 had the mass of a cluster of
galaxies, the magnification would affect at most only one of the three
objects in the filament, the one closer to its Einstein radius. The second
hypothesis, the possibility that multiple minilenses are distributed in the
halo of the galaxy, has already been proposed: gravitational mesolensing by King
objects (Baryshev & Bukhmastova 1997; Bukhmastova 2003). The strong
gravitational lensing would be produced by King lenses: globular clusters
(Bukhmastova 2003), dwarf galaxies, or clusters of hidden mass with masses
between 103 and 109  .
This is an interesting idea, although we
are not convinced by the proof presented by one of authors of the idea
(Bukhmastova 2001) which reveals excesses of pairs of galaxy/QSO with
.
This is an interesting idea, although we
are not convinced by the proof presented by one of authors of the idea
(Bukhmastova 2001) which reveals excesses of pairs of galaxy/QSO with
 ,
because many of these pairs were indeed the same object
classified both as QSOs and galaxies. Nevertheless, in our particular
case, it does not solve the low probability P, because only in
narrow rings is the enhancement high enough, and these narrow rings have a very
small area, so, the probability of these being a large number of sources is
small.
,
because many of these pairs were indeed the same object
classified both as QSOs and galaxies. Nevertheless, in our particular
case, it does not solve the low probability P, because only in
narrow rings is the enhancement high enough, and these narrow rings have a very
small area, so, the probability of these being a large number of sources is
small.
The relative angular configuration of NGC 7603, NGC 7603B, object #1 and #2,
the filament connecting all of them and the probability that two of two
HII-galaxies in the filament have very high star formation ratios, if we
accepted as valid the measures of the EWs, could be explained as a
consequence of a physical interaction between them. An interpretation that
explains the configuration as equivalent to other systems in interaction would
be clearly preferred over one in which the configuration is purely a
projection effect according to the calculations in Sect. 5.2.2. In that
case, the filament would be a sign of disruption in NGC 7603 owing to the
proximity of NGC 7603B. This is reinforced by the fact that both NGC 7603 and
NGC 7603B show asymmetries in the halo. The narrow emission line galaxies #21, #22, #23 on the other side of NGC 7603 might also be embedded in the
extension of the halo pointing to these objects.
In such a case, the redshifts would be non-cosmological.
Some of the possible explanations for an intrinsic redshift
with standard physics are now discussed:
- Doppler:
- Considering only the system of NGC 7603 and NGC 7603B, which has a difference
of around 8000 km s-1 is it possible that both galaxies are
at the same cosmological distance and that the difference in redshift reflects a
difference in peculiar velocities? The known examples of interacting galaxies
in the field show differences in velocity between them 1000 km s-1. The higher density of objects in a cluster of galaxies and
the dispersion of velocities within them could favour high speed collisions
with differences in velocity between the interacting galaxies of a few
1000 km s-1. The possibility of an encounter between groups of galaxies
with a difference in velocity of 4000 km s-1 has been considered
by de Ruiter et al. (1998) as a possible explanation of the peculiar field
around B2 1637+29. However, as far as we know, no example of such a
collision in the field with a difference in velocity as large as that
existing between NGC 7603 and NGC 7603B has been reported so far, and it would be
unexplained in the framework of models of galaxy formation.
Furthermore, the extremely high velocity differences of the HII-galaxies would disrupt the
system quickly and there would be cases of blueshifts (in this or other anomalous redshift cases).
- Gravitational:
- Anomalous redshifts could alternatively be explained in terms of
highly collapsed matter (Narlikar 1989).
The gravitational redshift explanation could then be an explanation
in terms of standard physics although we would need either very high masses
or very low radii for these objects. High mass seems to be excluded
since this would affect the rotation curves in the QSO-galaxy pairs
(Hoyle & Burbidge 1996). Very dense non-high mass objects could explain the
situation, but the HII-galaxies and NGC 7603B are extended
objects; unless most of the mass is concentrated in the very centre of the
nucleus, giving an intrinsic redshift, and the outer part of the galaxies
have normal cosmological redshifts. At present, we have not detected these
differences of redshifts within the HII-galaxies, and this possibility can be
discarded for NGC 7603B.
- Multiple scattering:
- Dynamic multiple scattering has been also proposed to
explain these systems. Results in statistical
optics (Wolf 1986; Datta et al. 1998a,b) show that a shift
in the frequency of spectral lines is produced with redshift independent of the
frequency when the light
passes through a turbulent (or inhomogeneous) medium, because of multiple
scattering effects (Roy et al. 2000). The anomalies could be caused by certain special conditions in the surroundings of the anomalous
redshift objects. The scattering solution has been proposed as
a way to explain the loss of energy of the photons ("the tired light theory''), an
alternative to the cosmological redshift.
There were several proposals in terms of photon-photon or photon-matter
interaction due to some quantum effects (e.g., Finley-Freundliech 1954;
Pecker et al. 1972;
Laio et al. 1997
). Potentially, this effect could explain the
high redshifts of some anomalous redshift objects, since light travelling through their outer
atmospheres could be redshifted, and the blurring would not be a problem
here since the distance travelled is short.
Non-standard physics
has also been used
to explain the redshift problem.
Hoyle & Narlikar (1964) developed a new theory of gravitation
with particle masses depending on time according to  and redshifts
 |
(18) |
where "observer'' and "source'' stands for the measures from the different system at
the Earth and in the source respectively.
The explanation that these authors give for anomalous redshift galaxies is that new matter
is being created there with t=0,
 for the new matter
and that the mass varies with the age (Narlikar 1977; Narlikar & Arp 1993) to
produce different redshifts.
for the new matter
and that the mass varies with the age (Narlikar 1977; Narlikar & Arp 1993) to
produce different redshifts.
5.3.5 Higher redshift galaxies ejected by a parent galaxy?
Some proposed models (e.g. Arp 1999a,b; Arp & Russell 2001; Burbidge 1999b;
Bell 2002a,b)
assume that some QSOs are ejected by a parent galaxy and decrease in redshift
as they move outward, often along the minor axis (the more
recent ejections are near the axes, but they later move away because of
peculiar motions, precession of the galaxy or the spin axis of the nucleus; Arp
1999b), until they reach a maximum distance of 500 kpc when they fall
back to the parent galaxy and turn into compact, active galaxies and, when they
are older, into normal galaxies. Galaxies would beget galaxies; they would not
be made from initial density fluctuations in a Big Bang Universe (Burbidge
1999b). It is usually claimed that the variable mass hypothesis is the
explanation for the intrinsic redshifts. However, the scenario of "galaxies
beget galaxies (with different redshift)'' should be considered as a separate
matter from the variable mass hypothesis or the Quasi Steady State Theory
because other explanations of the redshifts and other cosmological scenarios
could be compatible with the present idea.
This scenario seems to fit the observed system quite well: we would have three
(or possibly only two or one, if we considered that only some of the objects
are
background galaxies) ejected together with the material of
the filament, and any of the objects #21, #22 or #23
might be part of the ejection on the other side of the galaxy, or the QSO
candidates whose spectra remains to be taken (#19, #36). The near
coincidence of the redshifts of two of these objects with the redshifts of the
HII galaxies in the filament suggests that they have a common
interpretation: either objects with z=0.245 and z=0.246 and objects with
z=0.394 and z=0.401 belong to the same two groups of galaxies
(in a cosmological redshift interpretation) or all of them are ejected by the
parent galaxy NGC 7603 (in a non-cosmological redshift interpretation).
Nevertheless in the cosmological interpretation we still need to explain the low value of P.
Therefore, if we want to
avoid the word "coincidence'' in all aspects (positions and redshifts) we
must assume that all objects (#1, #2, #22, #23) are ejected by the parent
galaxy.
HST images might show the interaction of the filament with objects #1 and #2 (see Sect. 3.2.1). The narrow line character in these objects (in
principle, classified as HII galaxies according to their line ratios) would be
a result of the ejection and interaction with the filament. Evidence is shown
in other papers (e.g., Keel et al. 1998, 1999; Arp 1999a; Burbidge et al.
2003) that when QSOs interact with ambient material they become less compact
and have narrower lines emitted from more a more diffuse body. This could be
the physical explanation. Dynamically disturbed starburst galaxies, as
illustrated by the case of NGC 2777 (Arp 1988), tend to be the small
companions of larger nearby galaxies belonging to older stellar populations.
According to Arp (1988), they are recently created galaxies in which star
formation is stimulated by recent ejection from the parent galaxy; some older
stars, together with stellar material, are suggested to be removed from the
larger galaxy in the course of this ejection. In the system NEQ3 near
NGC4151, a QSO and an HII-galaxy have almost identical redshifts, with a
separation of 2.8 arcsec and nearly the same magnitudes; the HII-galaxy
is embedded in a filament while the QSO is a little bit further away
(Gutiérrez & López-Corredoira 2004). It is another example of
environment where QSOs and narrow emission line galaxies have some relation.
The interaction between them could also explain the high observed equivalent
width in their H lines.
According to this theory, the intrinsic redshifts are indicated to evolve in
discrete steps as the QSOs evolve into galaxies (Arp 1999b). The peaks in the
quantization of the redshifts would be at redshifts around 0.06, 0.30, 0.60,
0.96, 1.41, 1.96 (Arp et al. 1990; Burbidge & Napier 2001), although the
dispersion is large mainly because of peculiar velocities.
The redshifts of the HII-galaxies suggest a possible relation in pairs of
objects: the pair in the filament with redshifts 0.245 and 0.394 could stem from
the same original source with intrinsic redshift 0.32 (the exact value
of this number indeed depends on the respective masses of the HII-galaxies),
and a superposed Doppler radial velocities of around 17 000 km s-1, for
instance (velocities of this order are obtained by Bell 2002a). A similar pair
might be the HII-galaxies at 0.246 and 0.401 away from the filament, on the
other side of NGC 7603, but these might be in the background. This value
of
 (around
 for an observer at NGC 7603) is close
to the peak in the periodicity of QSOs/galaxies of z=0.30 (Arp et al. 1990;
Burbidge & Napier 2001). The same argument might be applicable to the pair of
objects #22, #23. The emission in pairs or triplets could be very common
according to this theory. Bell (2002a,b) proposes that the ejection occurs in
triplets along the rotation axis of the central torus, and that these triplets are
composed of a singlet and a pair that simultaneously separate in opposite
directions and at 90
for an observer at NGC 7603) is close
to the peak in the periodicity of QSOs/galaxies of z=0.30 (Arp et al. 1990;
Burbidge & Napier 2001). The same argument might be applicable to the pair of
objects #22, #23. The emission in pairs or triplets could be very common
according to this theory. Bell (2002a,b) proposes that the ejection occurs in
triplets along the rotation axis of the central torus, and that these triplets are
composed of a singlet and a pair that simultaneously separate in opposite
directions and at 90 to the triplet ejection direction. The separation
between the singlet and the pair is higher than the pair separation; if this
were the case in NGC 7603, we would have to find the singlets somewhere in the
field of NGC 7603.
to the triplet ejection direction. The separation
between the singlet and the pair is higher than the pair separation; if this
were the case in NGC 7603, we would have to find the singlets somewhere in the
field of NGC 7603.
We do not have enough information about the distances of the sources with respect to the
parent galaxy to build an unique 3-D representation. For instance, Fig. 8
represents a possible configuration according to the ejection theory. The inclination of
the galaxy is around 20 degrees with respect the line of sight (ellipticity
0.35), so slight deviations of the objects from the rotation axis could produce the
projected image that we have observed. Figure 8 shows a model in which the
filament is not in the plane of the galaxy, but is ejected in a direction nearly
perpendicular to the plane.
The filament does not have a blue colour like the other spiral arms in NGC 7603; neither
does it have young star formation since it has no emission lines (paper I); instead, it
has a red colour (see Fig. 3), like the old population of the disc of
NGC 7603. Therefore, the filament could possibly be some material stripped from the main
galaxy as a result of some tidal interactions or ejection. A reason for the visibility of
the filament in this ejection with 24.0 mag/arcsec2, while is not observed in other
systems, might be the integration along the line of sight of a filament that is nearly
tangential to the line of sight and provides a high column density. Nonetheless, there
are some other cases that also have similar continuous or nearly-continuous
filaments/arms (with some gaps) connecting different-redshift objects (see Sect. 5.2.2). NGC 7603 is perhaps the clearest case, but it may not be unique.
The other side of NGC 7603 (behind NGC 7603 if we assume that the filament and its
ejected objects are in front of it) could also have some ejected objects.
We do not see the filament there, possibly because it is behind the galaxy.
Other possible scenario within this ejection hypothesis would be that all the galaxies are
in the plane of NGC 7603. It is noteworthy that all the five HII galaxies and NGC 7603B are
almost aligned, which could lead us to think of an ejection along some common axis. However,
this axis would not be the rotation axis, which is the expected axis in ejection
theories.
![\begin{figure}
\par\includegraphics[width=7.4cm,clip]{0260fig8.ps}
\end{figure}](/articles/aa/full/2004/26/aa0260/Timg158.gif) |
Figure 8:
Possible representation of the system of NGC 7603/NGC 7603B/Object #1/Object
#2 if we accept the hypothesis of the three last objects ejected by
the parent galaxy,
NGC 7603. The inclination of NGC 7603 with respect the line of sight is
 .
The major axis in the projected image (Axis 1) has a
position angle .
The major axis in the projected image (Axis 1) has a
position angle
 ;
the minor axis in the projected image is "Axis 2''. ;
the minor axis in the projected image is "Axis 2''. |
| Open with DEXTER |
6 Summary
- We present new observations in the field of the Seyfert galaxy NGC 7603.
These comprise broad and narrow band imaging, and intermediate resolution
spectroscopy of several objects in the field.
- We have delineated the halo around NGC 7603 out to the isophote 26.2 mag/arcsec2 in the Sloan r band filter finding several signs of
irregularities and asymmetries towards the east. Neither these eastern
asymmetries nor the filament towards the east, apparently connecting NGC 7603
and NGC 7603B, can be easily understood in an isolated galaxy, and until now no
good candidates for companions on the east side of NGC 7603 with the same
redshift have been found.
- With improved spectra with respect to those published in Paper I, we have
confirmed the redshift of the two objects in the filament connecting NGC 7603
and NGC 7603B and we have observed their
lines for the first time.
- The better resolution achieved in these new spectra and HST imaging of
these objects have allowed their more accurate classification as HII galaxies.
We have not detected any signs of variability in these objects at levels
 0.3-0.4 mag. We found very strong star formation (or whatever the cause
of the high equivalent widths of H lines) in both of them and the HST
images show some distortions in the shape of both galaxies, which might suggest
an interaction with the filament.
0.3-0.4 mag. We found very strong star formation (or whatever the cause
of the high equivalent widths of H lines) in both of them and the HST
images show some distortions in the shape of both galaxies, which might suggest
an interaction with the filament.
- We have detected new narrow emission line galaxies at z=0.246, 0.117
and 0.401, 0.8, 1.5, 1.7 min to the west of the filament between NGC 7603
and NGC 7603B. The nearly coincidence of the redshifts of two of these objects
with the redshifts of the HII galaxies in the filament make us think that they
have likely a common interpretation: either objects with z=0.245 and
z=0.246 and objects with z=0.394 and z=0.401 belong to the same two
groups of galaxies respectively (in a cosmological redshift interpretation) or
all of them are ejected by the parent galaxy NGC 7603 (in a non-cosmological
redshift interpretation).
- The probability of a fortuitous accumulation of objects as bright as NGC
7603, NGC 7603B, and the two objects in the filament is
.
The detection of vigorous star formation observed
in the HII-galaxies of the filament, if confirmed, would have a probability
 ,
giving a total probability
,
giving a total probability
 .
They look
like dwarf HII-galaxies (non-cosmological redshift) rather than normal/giant
HII-galaxies (cosmological redshift).
.
They look
like dwarf HII-galaxies (non-cosmological redshift) rather than normal/giant
HII-galaxies (cosmological redshift).
- An explanation in terms of cosmological redshifts (with or without
gravitational lensing, with or without clusters in the line of sight has a very
low probability although it is not impossible. Alternative explanations have
been analysed.
Acknowledgements
Thanks are given to the referee Jack Sulentic for useful comments and criticisms on the interpretations
of probabilities. We thank also to
Evencio Mediavilla (IAC) who read the manuscript and
gave helpful comments.
This research has made use of the SIMBAD database,
operated at CDS, Strasbourg, France.
Appendix A: Cumulative counts of galaxies and QSOs
The cumulative counts of galaxies in the B-band can be derived from differential galaxy counts
from Metcalfe et al. (1991) for galaxies between
20.5<B<24.5 (magnitudes
corrected for extinction):
 |
(A.1) |
The cumulative count is:
This assumes as an approximation that Eq. (A.1) applies for B0<20.5, which is more
or less correct because the change of slope is very small for lower magnitudes.
The cumulative QSO counts are given by:
 |
(A.3) |
We derived this expression by fitting the cumulative QSO counts in the
photographic bj filter from the survey by Boyle et al. (2000), based in a
multicolour selection of QSOs. Figure A.1 shows that fit.
The Boyle et al. (2000) data are for bj<21.0, but we extrapolate the fit (A.3) as an approximation to higher magnitudes. Another point obtained
from a spectroscopic survey of faint QSOs (Boyle et al. 1991) confirms that the
fit and its extrapolation are reasonably good (see Fig. A.1). The uncertainties are low: the multicolour
selection of QSOs is complete for QSOs of redshift of z<2.2 (90%), or 80%
for z>2.2 (Boyle et al. 2000; Meyer et al. 2001).
![\begin{figure}
\par\includegraphics[width=8cm,angle=0,clip]{0260fig9.eps}
\end{figure}](/articles/aa/full/2004/26/aa0260/Timg168.gif) |
Figure A.1:
Cumulative QSO counts data (Boyle et al. 2000; 1991)
and a fit of a second polynomial degree to the Boyle et al. (2000) data. |
- Arp, H. C. 1971, ApL, 7,
221 [NASA ADS] (In the text)
- Arp, H. C. 1975, PASP,
87, 545 [NASA ADS] [CrossRef] (In the text)
- Arp, H. C. 1980, ApJ,
239, 469 [NASA ADS] [CrossRef] (In the text)
- Arp, H. C. 1981, ApJ,
250, 31 [NASA ADS] (In the text)
- Arp, H. C. 1987, QSOs,
Redshifts and Controversies (Berkeley: Interstellar Media)
(In the text)
- Arp, H. C. 1988, in High
energy astrophysics: Supernovae, remnants, active galaxies,
cosmology (Berlin: Springer-Verlag), 160
(In the text)
- Arp, H. C. 1998, Seeing
red: redshifts, cosmology and academic science (Montreal:
Apeiron)
(In the text)
- Arp, H. C. 1999a, ApJ,
525, 594 [NASA ADS] [CrossRef] (In the text)
- Arp, H. C. 1999b,
Active Galactic Nuclei and Related Phenomena, ed. Y. Terzian, E.
Khachikian, & D. Weedman (S. Francisco: ASP), 347
- Arp, H. C., &
Russell, D. A. 2001, ApJ, 549, 802 [NASA ADS] [CrossRef]
- Arp, H. C., Bi, H., Chu,
Y., & Zhu, X. 1990, A&A, 239, 33 [NASA ADS] (In the text)
- Arp, H. C., Burbidge, E.
M., Chu, Y., & Zhu, X. 2001, ApJ, 553, L11 [NASA ADS] [CrossRef] (In the text)
- Arp, H. C., Burbidge, E.
M., Chu, Y., et al. 2002, A&A, 391, 833 [EDP Sciences] [NASA ADS] [CrossRef] (In the text)
- Baryshev, Y.
V., & Bukhmastova, Y. L. 1997, Astron. Rep., 41, 436 [NASA ADS] (In the text)
- Bell, M. B. 2002a, ApJ,
566, 705 [NASA ADS] [CrossRef] (In the text)
- Bell, M. B. 2002b,
ApJ, 567, 801 [NASA ADS] [CrossRef]
- Benítez, N.,
Sanz, J. L., & Martínez-González, E. 2001, MNRAS,
320, 241 [NASA ADS] [CrossRef] (In the text)
- Bennett, C. L.,
Halpern, M., Hinshaw, G., et al. 2003, ApJS, 148, 1 [NASA ADS] [CrossRef] (In the text)
- Bertin, E., &
Arnouts, S. 1996, A&AS, 117, 393 [NASA ADS] (In the text)
- Biviano, A.,
Katgert, P., Mazure, A., et al. 1997, A&A, 321, 84 [NASA ADS] (In the text)
- Boyle, B. J., Jones,
L. R., & Shanks, T. 1991, MNRAS, 251, 482 [NASA ADS] (In the text)
- Boyle, B. J., Shanks,
T., Croom, S. M., et al. 2000, MNRAS, 317, 1014 [NASA ADS] [CrossRef] (In the text)
-
Bukhmastova, Y. L. 2001, Astron. Rep., 45, 675 [NASA ADS] (In the text)
-
Bukhmastova, Y. L. 2003, Astron. Lett., 29, 214 [NASA ADS] [CrossRef] (In the text)
- Burbidge, G. R.
1996, A&A, 309, 9 [NASA ADS] (In the text)
- Burbidge, G. R.
1999a, ApJ, 511, L9 [NASA ADS] [CrossRef] (In the text)
- Burbidge, G.
R. 1999b, in Cosmological Parameters and the Evolution of the
Universe, ed. K. Sato (Dordrecht: Kluwer), 286
- Burbidge, G. R.
2001, PASP, 113, 899 [NASA ADS] [CrossRef] (In the text)
- Burbidge, E.
M., Burbidge, G. R., Arp, H. C., & Zibetti, S. 2003, ApJ, 591,
690 [NASA ADS] [CrossRef] (In the text)
- Burbidge, G.
R., Hoyle, F., & Schneider, P. 1997, A&A, 320, 8 [NASA ADS] (In the text)
- Burbidge, G.
R., & Napier, W. 2001, AJ, 121, 21 [NASA ADS] [CrossRef]
- Carilli, C. L.,
& van Gorkom, J. H. 1992, ApJ, 399, 373 [NASA ADS] [CrossRef] (In the text)
- Carilli, C. L.,
van Gorkom, J. H., & Stocke, J. T. 1989, Nature, 338, 134 [NASA ADS] [CrossRef] (In the text)
- Carter, B. J.,
Fabricant, D. G., Geller, M. J., & Kurtz, M. J. 2001, ApJ, 559,
606 [NASA ADS] [CrossRef] (In the text)
- Croom, S. M., Smith,
R. J., Boyle, B. J., et al. 2001, MNRAS, 322, L29 [NASA ADS] [CrossRef] (In the text)
- Datta, S., Roy, M.,
& Moles, M. 1998a, Inst. Journ. Theor. Phys., 37,
1313
(In the text)
- Datta, S., Roy, M.,
& Moles, M. 1998b, Inst. Journ. Theor. Phys., 37,
1469
- de Ruiter, H.
R., Fan ti, R., Parma, P., et al. 1998, MNRAS, 337, 711 [NASA ADS] (In the text)
- Dessauges-Zavadsky, M., Pindao,
M., Maeder, A., & Kunth, D. 2000, A&A, 355, 89 [NASA ADS] (In the text)
- Dressler, A.,
Thompson, I. B., & Shectman, S. A. 1985, ApJ, 288, 481 [NASA ADS] [CrossRef] (In the text)
- de
Vaucouleurs, G., de Vaucouleurs, A., Corwin JR., H. G., et al.
1991, Third Reference Catalogue of Bright Galaxies (New York:
Springer-Verlag)
(In the text)
- Ellis, R., Santos, M.
R., Kneib, J. P., & Kuijken, K. 2001, ApJ, 560, L119 [NASA ADS] [CrossRef] (In the text)
- Filippenko,
V. A., & Terlevich, R. J. 1992, ApJ, 397, L79 [NASA ADS] [CrossRef] (In the text)
- Finley-Freundlich, E. 1954, Phil.
Mag., 45, 303 [NASA ADS]
- Gallagher, S.
C., Charlton, J. C., Hunsberger, S. D., et al. 2001, AJ, 122,
163 [NASA ADS] [CrossRef] (In the text)
-
Gaztañaga, E. 2003, ApJ, 589, 82 [NASA ADS] [CrossRef] (In the text)
- Gibson, C. H. 1996,
Appl. Mech. Rev., 49, 299 [NASA ADS] (In the text)
- Gibson, C. H.,
& Schild, R. E. 2003, AJ, submitted, preprint
[arXiv:astro-ph/0304107]
(In the text)
- Gisler, G. R. 1978,
MNRAS, 183, 633 [NASA ADS] (In the text)
- Goodrich, R. W.
1989, ApJ, 340, 190 [NASA ADS] [CrossRef] (In the text)
- Gott, J. R., III, &
Gunn 1974, ApJ, 190, L105 [NASA ADS] [CrossRef] (In the text)
-
Gutiérrez, C. M., & López-Corredoira, M. 2004, ApJ,
605, L5 [NASA ADS] [CrossRef] (In the text)
-
Gutiérrez, C. M., López-Corredoira, M., Prada, F., &
Eliche M. C. 2002, ApJ, 579, 592 [NASA ADS] [CrossRef] (In the text)
- Hickson, P. 1982,
ApJ, 255, 382 [NASA ADS] [CrossRef] (In the text)
- Hoyle, F. 1972, Henry
Norris Russel Lecture, The Seattle Meating of the A&AS
(In the text)
- Hoyle, F., &
Burbidge, G. R. 1996, A&A, 309, 335 [NASA ADS] (In the text)
- Hoyle, F., Burbidge,
G., & Narlikar, J. V. 1993, ApJ, 410, 437 [NASA ADS] [CrossRef] (In the text)
- Hoyle, F., &
Narlikar, J. V. 1964, Proy. Roy. Soc. London A, 282, 191 [NASA ADS] [MathSciNet] (In the text)
- Jain, B., Scranton, R.,
& Sheth, R. K. 2003, MNRAS, 345, 62 [NASA ADS] [CrossRef] (In the text)
- Johnston, K.
V., Sackett, P. D., & Bullock, J. S. 2001, ApJ, 557, 137 [NASA ADS] [CrossRef] (In the text)
- Keel, W. C., Cohen, S.
H., Windhorst, R. A., & Waddington, I. 1999, AJ, 118, 2547 [NASA ADS] [CrossRef] (In the text)
- Keel, W. C., Windhorst,
R. A., Cohen, S. H., Pascarelle, S., & Holmes, M. 1998, NOAO
Newsletter, 53, 1 [NASA ADS] (In the text)
- Kennicutt, R.
C. Jr., Tamblyn, P., & Congdon, C. W. 1994, ApJ, 435, 22 [NASA ADS] [CrossRef] (In the text)
-
Kollatschny, W., Bischoff, K., & Dietrich, M. 2000, A&A,
361, 901 [NASA ADS] (In the text)
- Kondratko, P.
T., Greenhill, L. J., & Moran, J. M. 2001, A&AS, 199,
5101 [NASA ADS] (In the text)
- Kopylov, I. M.,
Lipovetskii, V. A., Pronik, V. I., & Chuvaev, K. K. 1974, Afz,
10, 483 [NASA ADS] (In the text)
- Laio, A., Rizzi, G.,
& Tartaglia, A. 1997, Phys. Rev. E, 55, 7457 [NASA ADS] [CrossRef] (In the text)
- Landolt, A. U.
1992, A&A, 104, 340 [NASA ADS] (In the text)
- Lisenfeld,
U., Braine, J., Duc, P.-A., et al. 2002, A&A, 394, 823 [EDP Sciences] [NASA ADS] [CrossRef] (In the text)
-
López-Corredoira, M., & Gutiérrez, C. M. 2002,
A&A, 390, L15 [EDP Sciences] [NASA ADS] [CrossRef] (Paper I)
(In the text)
- Malkan, M. A.,
Gorjian, V., & Tam, R. 1998, ApJS, 117, 25 [NASA ADS] [CrossRef] (In the text)
- Maoz, D., Koratkar, A.,
Shields, J. C., et al. 1998, AJ, 116, 55 [NASA ADS] [CrossRef] (In the text)
- Mathis, J. S. 1990,
ARA&A, 28, 37 [NASA ADS] (In the text)
-
Mendes de Oliveira, C. 1995, MNRAS, 273, 139 [NASA ADS] (In the text)
- Metcalfe, N.,
Shanks, T., Fong, R., & Jones, L. R. 1991, MNRAS, 249, 498 [NASA ADS] (In the text)
- Meyer, M. J.,
Drinkwater, M. J., Phillips, S., & Couch, W. J. 2001, MNRAS,
324, 343 [NASA ADS] [CrossRef] (In the text)
- Moles, M., Marquez,
I., & Sulentic, J. W. 1998, A&A, 334, 473 [NASA ADS] (In the text)
- Narlikar, J. V.
1977, Ann. Phys., 107, 325 [NASA ADS] (In the text)
- Narlikar, J. V.
1989, Space Sci. Rev., 50, 523 [NASA ADS] (In the text)
- Narlikar, J.
V., & Arp, H. C. 1993, ApJ, 405, 51 [NASA ADS] (In the text)
-
Noerdlinger, P. D. 1975, Ap&SS, 38, 457 [NASA ADS] (In the text)
- Ohyama, Y.,
Taniguchi, Y., Hibbard, J. E., & Vacca, W. D. 1999, AJ, 117,
2617 [NASA ADS] [CrossRef] (In the text)
- Pecker, J. C.,
Roberts, A. P., & Vigier, J. P. 1972, Nature, 237, 227 [NASA ADS] (In the text)
- Pietsch, W.,
Vogler, A., Kahabka, P., Jain, A., & Kelin, V. 1994, A&A,
284, 386 [NASA ADS] (In the text)
- Rose, J. A., Gaba, A.
E., Caldwell, N., & Chaboyer, B. 2001, AJ, 121, 793 [NASA ADS] [CrossRef] (In the text)
- Roy, S., Kafatos, M.,
& Datta, S. 2000, A&A, 353, 1134 [NASA ADS] (In the text)
- Schlegel, D.
J., Finkbeiner, D. P., & Davis, M. 1998, ApJ, 500, 525 [NASA ADS] [CrossRef] (In the text)
- Schombert, J.
M., Wallin, J. F., & Struck-Marcell, C. 1990, AJ, 99, 497 [NASA ADS] [CrossRef] (In the text)
- Schneider, P.
1989, A&A, 221, 221 [NASA ADS] (In the text)
- Sharp, N. A. 1986,
ApJ, 302, 245 [NASA ADS] [CrossRef] (In the text)
- Sluse, D., Surdej,
J., Claeskens, J. F., et al. 2003, A&A, 397, 539 [EDP Sciences] [NASA ADS] [CrossRef] (In the text)
- Smith, J. A., Tucker,
D. L., Kent, S., et al. 2002, AJ, 123, 2121 [NASA ADS] [CrossRef] (In the text)
- Stockton, A.,
& Ridgway, S. E. 1998, AJ, 115, 1340 [NASA ADS] [CrossRef] (In the text)
- Sulentic, J. W.
1997, ApJ, 482, 640 [NASA ADS] [CrossRef] (In the text)
- Sulentic, J.
W., & Arp, H. C. 1987, ApJ, 319, 687 [NASA ADS] [CrossRef] (In the text)
- Sulentic, J.
W., Zwitter, T., Marziani, P., & Dultzin-Hacyan, D. 2000, ApJ,
536, L5 [NASA ADS] [CrossRef] (In the text)
- Sulentic, J.
W., Rosado, M., Dultzin-Hacyan, D., et al. 2001, AJ, 122, 2993 [NASA ADS] [CrossRef] (In the text)
- Sulentic, J.
W., Marziani, P., Zamanov, R., et al. 2002, ApJ, 566, L71 [NASA ADS] [CrossRef] (In the text)
- Telles, E., &
Terlevich, R. 1995, MNRAS, 275, 1 [NASA ADS] (In the text)
- Teplitz, H. I.,
Collins, N. R., Gardner, J. P., et al. 2003, ApJS, 146, 209 [NASA ADS] [CrossRef] (In the text)
- Tohline, J. E.,
& Osterbrock, D. E. 1976, Lick Obs. Bull., 742, 1 [NASA ADS] (In the text)
- Veilleux, S.,
& Osterbrock, D. E. 1987, ApJS, 63, 295 [NASA ADS] [CrossRef]
- Williams, B.
A., Yun, M. S., & Verdes-Montenegro, L. 2002, AJ, 123,
2417 [NASA ADS] [CrossRef] (In the text)
- Wolf, E. 1986, Phys.
Rev. Lett., 56, 1379 [NASA ADS] (In the text)
- Wu, X. P. 1996, Fund.
Cosmic Phys., 17, 1 [NASA ADS] (In the text)
Copyright ESO 2004
![\begin{figure}
\par\includegraphics[width=8cm,clip]{0260fig1.eps}
\end{figure}](/articles/aa/full/2004/26/aa0260/img11.gif)
![\begin{figure}
\par\includegraphics[width=7.7cm,clip]{0260fig2.eps}
\end{figure}](/articles/aa/full/2004/26/aa0260/img12.gif)
![\begin{figure}
\par\includegraphics[width=7.5cm,clip]{0260fig3.eps}
\end{figure}](/articles/aa/full/2004/26/aa0260/img17.gif)
![\begin{figure}
\par\includegraphics[angle=-90,width=7.5cm,clip]{0260fig4.ps}
\end{figure}](/articles/aa/full/2004/26/aa0260/img18.gif)
![\begin{figure}
\par\includegraphics[width=7.4cm,clip]{0260fig5.eps}
\end{figure}](/articles/aa/full/2004/26/aa0260/img19.gif)
![\begin{figure}
\par\includegraphics[angle=-90,width=6cm,clip]{0260fig6.ps}
\end{figure}](/articles/aa/full/2004/26/aa0260/img20.gif)
![\begin{figure}
\par\includegraphics[width=7.4cm,clip]{0260fig7.eps}
\end{figure}](/articles/aa/full/2004/26/aa0260/img48.gif)
![$\displaystyle +
A_{\rm fil.}\left[\lambda _B\frac{(1+z)}{(1+z_{\rm fil })}\right]-A_{\rm fil.}
\left[\lambda _V\frac{(1+z)}{(1+z_{\rm fil })}\right]
\cdot$](/articles/aa/full/2004/26/aa0260/img99.gif)
![\begin{figure}
\par\includegraphics[width=7.4cm,clip]{0260fig8.ps}
\end{figure}](/articles/aa/full/2004/26/aa0260/img158.gif)
![\begin{figure}
\par\includegraphics[width=8cm,angle=0,clip]{0260fig9.eps}
\end{figure}](/articles/aa/full/2004/26/aa0260/img168.gif)