A&A 421, 281-294 (2004)
DOI: 10.1051/0004-6361:20040127
L. Decin1,![]() - Z. Shkedy2 - G. Molenberghs 2 - M. Aerts 2 - C. Aerts 1
- Z. Shkedy2 - G. Molenberghs 2 - M. Aerts 2 - C. Aerts 1
1 - Department of Physics and Astronomy, Institute for
Astronomy, K.U. Leuven, K.U. Leuven, Celestijnenlaan 200B, 3001 Leuven,
Belgium
2 -
Biostatistics, Center for Statistics, Limburgs Universitair
Centrum, Universitaire Campus, Building D, 3590 Diepenbeek, Belgium
Received 22 April 2003/ Accepted 18 January 2004
Abstract
Estimating stellar parameters from spectrophotometric data
is a key tool in the study of stellar structure and stellar
evolution. Although many methods have been proposed to estimate
stellar parameters from ultraviolet (UV), optical and infrared (IR)
data using low, medium or high-resolution observational data of the
target(s), only a few address the problem of the uncertainties in the
stellar parameters. This information is critical for a meaningful
comparison of the derived parameters with results obtained from other
data and/or methods. Here we present a frequentist
method to estimate these uncertainties. We demonstrate that
the combined use of both a local and a global
goodness-of-fit parameter alters the uncertainty intervals as
determined from the use of only one of these deviation estimating parameters.
This technique using both goodness-of-fit parameters
is applied to the infrared 2.38-4.08 ![]() m ISO-SWS data
(Infrared Space Observatory - Short Wavelength Spectrometer) of
m ISO-SWS data
(Infrared Space Observatory - Short Wavelength Spectrometer) of ![]() Boo,
yielding an effective temperature range from 4160 K to 4300 K, a logarithm of the gravity range from 1.35 to 1.65 dex and a
metallicity from -0.30 to 0.00 dex.
However, using a lack-of-fit test, it is shown that even the "best''
theoretical models are still not capable of capturing all
the structure in the data, and this is due to our incomplete
knowledge and modelling of the full physical stellar structure or
due to problems in the data reduction process.
Boo,
yielding an effective temperature range from 4160 K to 4300 K, a logarithm of the gravity range from 1.35 to 1.65 dex and a
metallicity from -0.30 to 0.00 dex.
However, using a lack-of-fit test, it is shown that even the "best''
theoretical models are still not capable of capturing all
the structure in the data, and this is due to our incomplete
knowledge and modelling of the full physical stellar structure or
due to problems in the data reduction process.
Key words: methods: data analysis - methods: statistical - techniques: spectroscopic - stars: fundamental parameters - stars: individual: Alpha Boo
Everything we know about the structure of stellar objects being studied is the result of a comparison between theoretical predictions and stellar observations. To give realistic answers to many physical questions induced by stellar phenomena, not only are accurate theoretical models indispensable, but also realistic uncertainty estimates on the parameters being deduced are required. In astronomy, uncertainty estimates (if assessed at all) are still often based on too simple a study of the sample of observables, resulting in too "optimistic'' error bars. A realistic knowledge of the uncertainties is however crucial and has to be taken into account if one, for example, wants to test the proposed physical mechanism explaining certain phenomena (see, e.g., De Bruyne et al. 2003). The present paper is the first of a series devoted to the development and description of a statistical method to assess the uncertainties of stellar atmospheric parameters deduced from astronomical spectra.
One way of estimating stellar atmospheric parameters
and drawing inferences from them consists of comparing the observed
spectrum of the target being
studied with a collection of synthetic spectra (e.g., Decin et al. 2000, for an application to cool
stars; Bailer-Jones 2000, for an application
using neural networks). Depending on the quality, the
resolution and the wavelength coverage of the data, different stellar
parameters can be traced.
In this paper we focus on the three most important stellar parameters
for the model structure: the effective temperature
![]() ,
the
gravity g and the metallicity [Fe/H]. Other parameters such as the
abundance pattern or the microturbulence are treated as known. Let
,
the
gravity g and the metallicity [Fe/H]. Other parameters such as the
abundance pattern or the microturbulence are treated as known. Let
![]()
![]() ,
,
![]() ,
[Fe/H]) present the
parameters of the stellar atmosphere. A synthetic spectrum,
,
[Fe/H]) present the
parameters of the stellar atmosphere. A synthetic spectrum,
![]() ,
,
![]() ,
is calculated for specific values of the parameters,
,
is calculated for specific values of the parameters,
![]()
![]() (m),
(m),
![]() ,
[Fe/H](m)) and
compared to the observed spectrum. When the
synthetic spectrum and the observed spectrum agree the parameters of
the stellar atmosphere are assumed to be known. The first question
which arises when applying this kind of method is how to measure the
goodness-of-fit between observational and theoretical data. A second
- equally important - question is then how to assess the uncertainties
on the derived stellar parameters.
These questions (and answers) become even more complicated when we want
to take measurement errors into account.
,
[Fe/H](m)) and
compared to the observed spectrum. When the
synthetic spectrum and the observed spectrum agree the parameters of
the stellar atmosphere are assumed to be known. The first question
which arises when applying this kind of method is how to measure the
goodness-of-fit between observational and theoretical data. A second
- equally important - question is then how to assess the uncertainties
on the derived stellar parameters.
These questions (and answers) become even more complicated when we want
to take measurement errors into account.
A search of the astronomical literature reveals that statistical
tests are often restricted to local deviation estimating
parameters, as e.g. the ordinary least square method (OLS) (or
derivatives from it) (Bailer-Jones 2000; Katz et al. 1998; Erspamer & North 2002; Valenti & Piskunov 1996). The first goal of this paper is to
demonstrate that parameter
ranges as determined from the use of a
local goodness-of-fit parameter can be optimized by combining a
local with a global goodness-of-fit parameter
(Sects. 3 and 4). In both methods, the estimate for ![]() is the value of
is the value of
![]() which minimises the proposed
goodness-of-fit parameter. Using the results of this first part of
the study, our second goal is to discuss (Sect. 5) how
the differences between observed and synthetic spectra can be used
to check the appropriateness of a proposed set of stellar
parameters - a step often neglected by astronomers.
This qualification can be performed using
lack-of-fit tests.
which minimises the proposed
goodness-of-fit parameter. Using the results of this first part of
the study, our second goal is to discuss (Sect. 5) how
the differences between observed and synthetic spectra can be used
to check the appropriateness of a proposed set of stellar
parameters - a step often neglected by astronomers.
This qualification can be performed using
lack-of-fit tests.
The methodology developed in this paper has broad applications in astronomy as it relies only on observed spectra and on theoretical predictions thereof. To test our method, we have chosen to apply it to the spectra of a stellar target of which the basic stellar parameters are already very well known from successful comparisons with models. Accurate estimations of stellar parameters for cool standard stars were done using data of the ISO-SWS (Decin et al. 2003a-c). We therefore have chosen to illustrate our general methodology on the ISO-SWS observations of one such star, the case study of the K2IIIp giant Alpha Bootis (Arcturus, HD 124897).
Before doing the analysis in Sects. 3-5, we give in Sect. 2 a description of the observational and theoretical data on which the method will be tested. The results of both Part I (Sects. 3 and 4) and Part II (Sect. 5) are discussed in Sects. 4.3 and 5.3 respectively. We end with a summary and some conclusions in the last section, Sect. 6. How to treat observational errors in this kind of study will be discussed in a forthcoming paper of this series.
This section describes the used observational ISO-SWS and theoretical
data. The grid of synthetic spectra calculated for the test-case ![]() Boo is specified in Sect. 2.3.
Boo is specified in Sect. 2.3.
The observational data for this study consist of near-infrared (2.38-4.08 ![]() m) spectra of
m) spectra of ![]() Boo observed with the SWS (Short Wavelength Spectrometer, de Graauw et al. 1996)
on board ISO (Infrared Space
Observatory, Kessler et al. 1996). The spectrometer was used
in the SWS observing mode AOT01 (=a single up-down scan for each
aperture with four possible scan speeds at degraded resolution) with
scanner speed 4, resulting in a resolving power of
Boo observed with the SWS (Short Wavelength Spectrometer, de Graauw et al. 1996)
on board ISO (Infrared Space
Observatory, Kessler et al. 1996). The spectrometer was used
in the SWS observing mode AOT01 (=a single up-down scan for each
aperture with four possible scan speeds at degraded resolution) with
scanner speed 4, resulting in a resolving power of ![]() 1500. The
observation lasted for 6538 s and was performed during revolution 452
1500. The
observation lasted for 6538 s and was performed during revolution 452![]() .
.
Table 1: Resolution and factors used to shift the sub-bands.
The reduction was made using the SWS Interactive Analysis Package IA
![]() (de Graauw et al. 1996) using calibration
files and procedures equivalent with pipeline version 10.0. Further
data processing consisted of bad data removal (
(de Graauw et al. 1996) using calibration
files and procedures equivalent with pipeline version 10.0. Further
data processing consisted of bad data removal (
![]() ),
aligning of the 12 detectors to their average level. Since the grid of
observational pixel values does not have a
fixed resolution, we first want to "summarise'' the observational
pixel values, and then make a comparison between this summary
(denoted as y) and a synthetic spectrum (
),
aligning of the 12 detectors to their average level. Since the grid of
observational pixel values does not have a
fixed resolution, we first want to "summarise'' the observational
pixel values, and then make a comparison between this summary
(denoted as y) and a synthetic spectrum (![]() )
with the same
resolution. The standard way to resample the input data is by
"rebinning''. To summarise the ISO-SWS data to a fixed resolution we
have applied a flux
conserving non-parametric rebinning method - i.e. for each bin
the flux value is calculated using the trapezoidal rule
- with an oversampling of 4. This means that the resolution bin used
is 4 times the grid separation determined by the resolution for a
specific wavelength range of the ISO-SWS data. To fully
recover the intervening flux values it can be shown in the context
of "rectangular filtering'' that taking 4 points in an interval of
length
)
with the same
resolution. The standard way to resample the input data is by
"rebinning''. To summarise the ISO-SWS data to a fixed resolution we
have applied a flux
conserving non-parametric rebinning method - i.e. for each bin
the flux value is calculated using the trapezoidal rule
- with an oversampling of 4. This means that the resolution bin used
is 4 times the grid separation determined by the resolution for a
specific wavelength range of the ISO-SWS data. To fully
recover the intervening flux values it can be shown in the context
of "rectangular filtering'' that taking 4 points in an interval of
length ![]() is enough to optimise the
signal-to-noise (S/N) ratio (Bracewell 1985).
The rebinning used in the data reduction procedure
introduces a correlation between the data point values. The
appropriate resolving power was taken to be the most conservative
resolving power as determined by Lorente in Leech et al. (2002) (see
Table 1), with
the exception being band 1A
is enough to optimise the
signal-to-noise (S/N) ratio (Bracewell 1985).
The rebinning used in the data reduction procedure
introduces a correlation between the data point values. The
appropriate resolving power was taken to be the most conservative
resolving power as determined by Lorente in Leech et al. (2002) (see
Table 1), with
the exception being band 1A![]() for which this value has been changed from 1500 to 1300 (Decin et al. 2003b).
for which this value has been changed from 1500 to 1300 (Decin et al. 2003b).
The individual sub-band spectra can show jumps in flux level at the
band-edges when combining them into a single spectrum. These
band-to-band discontinuities can have several causes: uncertainties in
flux calibration, the low responsivity at the band edges, pointing
errors, and a problematic dark current subtraction in combination with
the RSRF (Relative Spectral Response Function) correction, from which
the pointing errors are believed to have the largest impact for this
high-flux observation. Hence, the individual sub-bands were multiplied
by a factor to construct a smooth spectrum (see Table 1). These factors were determined using the SED (Spectral Energy Distribution) of ![]() Boo as constructed in
Decin et al. (2003b) as a reference. The estimated
Boo as constructed in
Decin et al. (2003b) as a reference. The estimated ![]() uncertainty
on these factors is 10% (Leech et al. 2002).
uncertainty
on these factors is 10% (Leech et al. 2002).
The synthetic spectra used in this study have been generated using model photospheres calculated with the MARCS code, version May 1998. This version is a major update of the MARCS model-photosphere programs first developed by Gustafsson et al. (1975), and further improved by, e.g. Plez et al. (1992), Jørgensen et al. (1992), Edvardsson et al. (1993).
The common assumption of spherical stratification in homogeneous
stationary layers, hydrostatic equilibrium and Local Thermodynamic
Equilibrium (LTE) were made. Energy conservation was required for
radiative and convective flux, where the energy transport due to
convection was treated through a local mixing-length theory. The
mixing-length l was chosen as
![]() ,
with
,
with ![]() the pressure
scale height. Turbulent pressure was neglected. The reliability of
these assumptions is discussed in Plez et al. (1992).
The continuous absorption as well as the new models will be fully
described in a series of forth-coming papers (Gustafsson et al.; Jørg
ensen et al.; Plez et al., all in preparation).
the pressure
scale height. Turbulent pressure was neglected. The reliability of
these assumptions is discussed in Plez et al. (1992).
The continuous absorption as well as the new models will be fully
described in a series of forth-coming papers (Gustafsson et al.; Jørg
ensen et al.; Plez et al., all in preparation).
Using the computed model atmospheres, the synthetic spectra were
generated by solving the radiative transfer at a high wavelength
resolution (
![]() ,
corresponding to
,
corresponding to
![]() ). With a microturbulent
velocity
). With a microturbulent
velocity
![]() ,
this means we are sure to sample
all lines in the atomic and molecular database in the generation of
the synthetic spectrum. This is necessary so as not to overestimate
the absorption in regions with a high line density, or to
underestimate it in regions with a low line density
(Ryde & Eriksson 2002). For the line opacity in the ISO-SWS
range a database of infrared lines including atoms and molecules has
been prepared. For the molecular lines, the same data have been used as
in Decin et al. (2000). The accuracy and completeness of
these line lists are discussed in Decin (2000). For the atomic
transitions, the newly generated atomic linelist of J. Sauval
(priv. comm.) based on the FTS-ATMOS (Atmospheric Trace
Molecule Spectroscopy) spectrum of the Sun
(Geller 1992; Farmer & Norton 1989) has been included.
The emergent synthetic spectra are then convolved with a Gaussian
instrumental profile with
the same resolution as the ISO-SWS sub-bands (see Table 1).
,
this means we are sure to sample
all lines in the atomic and molecular database in the generation of
the synthetic spectrum. This is necessary so as not to overestimate
the absorption in regions with a high line density, or to
underestimate it in regions with a low line density
(Ryde & Eriksson 2002). For the line opacity in the ISO-SWS
range a database of infrared lines including atoms and molecules has
been prepared. For the molecular lines, the same data have been used as
in Decin et al. (2000). The accuracy and completeness of
these line lists are discussed in Decin (2000). For the atomic
transitions, the newly generated atomic linelist of J. Sauval
(priv. comm.) based on the FTS-ATMOS (Atmospheric Trace
Molecule Spectroscopy) spectrum of the Sun
(Geller 1992; Farmer & Norton 1989) has been included.
The emergent synthetic spectra are then convolved with a Gaussian
instrumental profile with
the same resolution as the ISO-SWS sub-bands (see Table 1).
As described in the introduction, we will calculate a grid of
synthetic spectra over discrete values in the parameter vector ![]() .
In the following sections, we will use this grid over the
vector parameter
.
In the following sections, we will use this grid over the
vector parameter ![]() to estimate
to estimate ![]() with
with
![]() for which the synthetic spectrum
for which the synthetic spectrum
![]() is the "closest'' to the observed spectrum (see
Sects. 3 and 4).
is the "closest'' to the observed spectrum (see
Sects. 3 and 4).
Based on the results in Decin et al. (2003a), 125
spectra have been calculated for ![]() Boo, with parameter ranges:
Boo, with parameter ranges:
|
|
: | 4160 K, 4230 K, 4300 K, 4370 K, 4440 K |
| : | 1.20, 1.35, 1.50, 1.65, 1.80 | |
| [Fe/H] | : | 0.00, -0.15, -0.30, -0.50, -0.70. |
Table 2: Angular diameters in mas and model numbers (in between brackets) associated with the different model parameters of the grid of synthetic spectra.
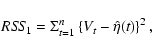
Since the ISO-SWS data are absolutely calibrated,
one also has to compute the
angular diameter to compare the rebinned observed and synthetic
data properly. Therefore, the angular diameter
![]() is deduced from the
energy distribution of the synthetic spectrum between 2.38 and 4.08
is deduced from the
energy distribution of the synthetic spectrum between 2.38 and 4.08 ![]() m and the absolute flux-values in this wavelength range of
the ISO-SWS spectrum. We therefore have minimised the residual sum of
squares
m and the absolute flux-values in this wavelength range of
the ISO-SWS spectrum. We therefore have minimised the residual sum of
squares
 |
(1) |
We try for the first time in this paper to
determine the
parameter ranges of the effective temperature, the gravity and the
metallicity of ![]() Boo. We first describe in general the model
selection based on the ordinary least square criterion
(Sect. 3.1). This is followed by the application to our
test-case, the ISO-SWS data of
Boo. We first describe in general the model
selection based on the ordinary least square criterion
(Sect. 3.1). This is followed by the application to our
test-case, the ISO-SWS data of ![]() Boo (Sect. 3.2).
Boo (Sect. 3.2).
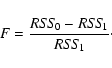
For the high-quality (absolutely calibrated) spectroscopic data that
we use, it is natural to estimate ![]() with
with
![]() for
which the synthetic spectrum
for
which the synthetic spectrum
![]() gives the best resemblance
to the observed spectrum, y. By analogy to linear
regression we can estimate
gives the best resemblance
to the observed spectrum, y. By analogy to linear
regression we can estimate ![]() by minimising the residual sum
of squares (also called the "ordinary least square''
(OLS) method):
by minimising the residual sum
of squares (also called the "ordinary least square''
(OLS) method):
Model 62 (
![]() = 4300 K,
= 4300 K,
![]() dex,
dex,
![]() dex)
has the best goodness-of-fit in band 1A. We note that
within one temperature level, the models occur in groups of size 5 (according to the value of the gravity). For example, models 1-5 have the same effective temperature, 4160 K,
and the same gravity (
dex)
has the best goodness-of-fit in band 1A. We note that
within one temperature level, the models occur in groups of size 5 (according to the value of the gravity). For example, models 1-5 have the same effective temperature, 4160 K,
and the same gravity (
![]() )
while for models 6-10
)
while for models 6-10
![]() .
Trends in the goodness-of-fit are visualised in
Fig. 3. Three patterns are observed: (a) the
goodness-of-fit increases with the level of metallicity, (b) a
parabolic shape in which the best goodness-of-fit is achieved for
models with metallicity between -0.15 to -0.5, and (c) goodness-of-fit decreases with the level of metallicity. For a
fixed temperature, the trend changes from trend (a) via trend (b) to trend (c) when the gravity increases.
Sometimes, a trend occurs twice or is absent, but the order
of trends never changes. The model having the best goodness-of-fit is
always situated at the minimum of a parabolic shape, suggesting
that we have reached a local minimum - an equilibrium - in the
parameter space.
.
Trends in the goodness-of-fit are visualised in
Fig. 3. Three patterns are observed: (a) the
goodness-of-fit increases with the level of metallicity, (b) a
parabolic shape in which the best goodness-of-fit is achieved for
models with metallicity between -0.15 to -0.5, and (c) goodness-of-fit decreases with the level of metallicity. For a
fixed temperature, the trend changes from trend (a) via trend (b) to trend (c) when the gravity increases.
Sometimes, a trend occurs twice or is absent, but the order
of trends never changes. The model having the best goodness-of-fit is
always situated at the minimum of a parabolic shape, suggesting
that we have reached a local minimum - an equilibrium - in the
parameter space.
![\begin{figure}
\par\includegraphics[angle=90,width=8.2cm,clip]{4480.f1.eps}
\end{figure}](/articles/aa/full/2004/25/aah4480/img49.gif) |
Figure 1:
Comparison between the ISO-SWS data of |
| Open with DEXTER | |
![\begin{figure}
\par\includegraphics[angle=90,width=8.5cm,clip]{4480.f2.eps}
\end{figure}](/articles/aa/full/2004/25/aah4480/img51.gif) |
Figure 2:
|
| Open with DEXTER | |
![\begin{figure}
\par\includegraphics[angle=90,width=8.8cm,clip]{4480.f3}
\end{figure}](/articles/aa/full/2004/25/aah4480/img52.gif) |
Figure 3:
Trends in the goodness-of-fit condition of
|
| Open with DEXTER | |
Table 3 shows the 10 models with
![]() having the lowest values, i.e., they have the best
goodness-of-fit. For these models
having the lowest values, i.e., they have the best
goodness-of-fit. For these models ![]() is between 1.20 and 1.65 dex,
the effective temperature ranges from 4160 K to 4440 K and [Fe/H] is between -0.15 dex and -0.70 dex.
is between 1.20 and 1.65 dex,
the effective temperature ranges from 4160 K to 4440 K and [Fe/H] is between -0.15 dex and -0.70 dex.
Table 3: Top 10 models in band 1A.
While in the previous subsection we have concentrated on band 1A of the ISO-SWS data of
The values of
![]() were ranked at each band,
and for each model we have calculated the mean of the ranks. This
means that the "best" model
is the one with the smallest mean rank. For example, model 38
(
were ranked at each band,
and for each model we have calculated the mean of the ranks. This
means that the "best" model
is the one with the smallest mean rank. For example, model 38
(
![]() = 4230 K,
= 4230 K,
![]() dex,
dex,
![]() dex)
has a rank of 2 in band 1A, but this model
is ranked 9, 28, 25 in band 1B, 1D and 1E respectively (hence, the
mean rank is 13.50). Overall, the rank of the mean rank of
model 38 is 5. The ranks of the mean ranks of the 125 models
are displayed in Fig. 4.
The models with the lowest rank are models 62 and 82. Model 62 is ranked 1, 7, 8, and 4 in the 4 bands,
respectively, with mean rank being 5.0.
dex)
has a rank of 2 in band 1A, but this model
is ranked 9, 28, 25 in band 1B, 1D and 1E respectively (hence, the
mean rank is 13.50). Overall, the rank of the mean rank of
model 38 is 5. The ranks of the mean ranks of the 125 models
are displayed in Fig. 4.
The models with the lowest rank are models 62 and 82. Model 62 is ranked 1, 7, 8, and 4 in the 4 bands,
respectively, with mean rank being 5.0.
![\begin{figure}
\par\includegraphics[angle=90,width=8.8cm,clip]{4480.f4}
\end{figure}](/articles/aa/full/2004/25/aah4480/img55.gif) |
Figure 4: Rank of the mean ranks for the 125 synthetic spectrum. |
| Open with DEXTER | |
Table 4: Stellar parameters of the models having the lowest overall rank. The overall rank is given in between brackets in the first column. In the last column, the rank in band 1A is tabulated.
The models having the best rank of the mean rank are listed in Table 4. Based on the models which rank in the top 10, the range in effective temperature is between 4230 K and 4440 K, in gravity between 1.35 and 1.65, and in metallicity between -0.70 to -0.30 dex.
In the previous section,
![]() was used as a measure for
the goodness-of-fit. In this section the analysis discussed above
was repeated using the Kolmogorov-Smirnov (
was used as a measure for
the goodness-of-fit. In this section the analysis discussed above
was repeated using the Kolmogorov-Smirnov (![]() )
statistics as
a measure for the goodness-of-fit.
)
statistics as
a measure for the goodness-of-fit.
The Kolmogorov-Smirnov statistical test
globally checks the goodness-of-fit of the observed and
synthetic spectra by computing a deviation estimating parameter ![]() (see Eq. (5) in Decin et al. 2000).
Without specifying the distribution function of
(see Eq. (5) in Decin et al. 2000).
Without specifying the distribution function of ![]() ,
we may
summarise that
,
we may
summarise that
Since both deviation estimating parameters stress a different point in the goodness-of-fit, a combination of the results based on the two parameters separately can only improve our knowledge on the stellar parameters and their uncertainties. This is illustrated in Fig. 5.
![\begin{figure}
\par {\hspace*{4cm}{\bf (a)}\hspace*{4cm}}\\
\vspace*{2mm}
\incl...
...\vspace*{2mm}
\includegraphics[angle=90,width=8.5cm,clip]{4480.f5b}
\end{figure}](/articles/aa/full/2004/25/aah4480/img57.gif) |
Figure 5:
Panel a) mean of the |
| Open with DEXTER | |
Table 5 shows the best 5 models, which besides
appearing in the lower left corner of Fig. 5a also are
ranked among the top 30 for both ![]() and
and
![]() (see
Fig. 5b and Table 4). The combined use of both
the scores of
(see
Fig. 5b and Table 4). The combined use of both
the scores of ![]() and
and
![]() themselves and the ranking of these scores does allow us
to determine a set of "best'' models! While e.g. model 54
(
themselves and the ranking of these scores does allow us
to determine a set of "best'' models! While e.g. model 54
(
![]() = 4300 K,
= 4300 K,
![]() dex,
dex,
![]() dex) has
very low
ranks based on both
dex) has
very low
ranks based on both ![]() and
and
![]() ,
the mean
,
the mean ![]() -value
is rather high. The advantage of using ranks is that all deviation
estimating parameters can be treated in the same magnitude level. The
disadvantage of using the ranks is that a
sudden increase in the deviation estimating parameter is not
translated into a sudden jump in the rank. Using both diagnostics
together solves this problem.
-value
is rather high. The advantage of using ranks is that all deviation
estimating parameters can be treated in the same magnitude level. The
disadvantage of using the ranks is that a
sudden increase in the deviation estimating parameter is not
translated into a sudden jump in the rank. Using both diagnostics
together solves this problem.
Note that one can see a correlation between the ranks of
the mean ranks of the T and ![]() parameter, but that there
are a few outliers namely in the upper left corner of Fig. 5b where a few models are situated with low T and high
parameter, but that there
are a few outliers namely in the upper left corner of Fig. 5b where a few models are situated with low T and high ![]() .
Inspecting why the deviation
estimating parameters do show this trend, shows us that all of
these models have a very low rank in T for band 1D and/or band 1E. When zooming into these bands, one indeed sees a
resemblance (see e.g. Fig. 6a for model 77:
.
Inspecting why the deviation
estimating parameters do show this trend, shows us that all of
these models have a very low rank in T for band 1D and/or band 1E. When zooming into these bands, one indeed sees a
resemblance (see e.g. Fig. 6a for model 77:
![]() = 4370 K,
= 4370 K,
![]() dex, [Fe/H] = -0.50 dex),
explaining the low T-value. The ratio between the observational
and synthetic data does, however, show a trend and is not randomly
distributed around 1, explaining the high
dex, [Fe/H] = -0.50 dex),
explaining the low T-value. The ratio between the observational
and synthetic data does, however, show a trend and is not randomly
distributed around 1, explaining the high ![]() value. This
is illustrated by the gray line in Fig. 6b with
slope -0.02. The few very strong (negative) peaks are due to
the underestimation of the OH-lines. Note also that the model having the
lowest rank in
value. This
is illustrated by the gray line in Fig. 6b with
slope -0.02. The few very strong (negative) peaks are due to
the underestimation of the OH-lines. Note also that the model having the
lowest rank in ![]() (model 40:
(model 40:
![]() = 4230 K,
= 4230 K,
![]() dex, [Fe/H] = 0.00 dex) is only ranked 46 in T.
This illustrates once more
that a combination of a local and global deviation
estimating parameter enlarges our knowledge on the estimated
stellar parameters and their uncertainties, which in this
particular case (see Table 5) results in a range in
dex, [Fe/H] = 0.00 dex) is only ranked 46 in T.
This illustrates once more
that a combination of a local and global deviation
estimating parameter enlarges our knowledge on the estimated
stellar parameters and their uncertainties, which in this
particular case (see Table 5) results in a range in
![]() from 4160 K to 4300 K, in
from 4160 K to 4300 K, in ![]() from 1.35 dex to 1.65 dex, and in [Fe/H] from -0.30 to 0.00 dex. Note that while
the local goodness-of-fit parameter T favours the lower range in
metallicity, the combined use of T and
from 1.35 dex to 1.65 dex, and in [Fe/H] from -0.30 to 0.00 dex. Note that while
the local goodness-of-fit parameter T favours the lower range in
metallicity, the combined use of T and ![]() clearly indicates a higher range in metallicity.
clearly indicates a higher range in metallicity.
Table 5:
Overall goodness-of-fit.The 5 models given in
this table do belong to the group of "best'' models based on both the
values of
![]() and
and ![]() ,
and are moreover ranked among the top 30 for both
,
and are moreover ranked among the top 30 for both
![]() and
and ![]() .
.
![\begin{figure}
\par {\hspace*{3.6cm}{{\bf (a)}}\hspace*{3.6cm}}\\
\vspace*{2mm}...
...ace*{3.6cm}}\\
\includegraphics[angle=90,width=8cm,clip]{4480.f6c}
\end{figure}](/articles/aa/full/2004/25/aah4480/img59.gif) |
Figure 6:
ISO-SWS observations of |
| Open with DEXTER | |
It is important to compare the derived parameter ranges with
literature values. We therefore will use Table D.3
as published in Decin et al. (2003a), in which a comprehensive list of
derived and assumed parameter values published in the literature is
given. These
listed parameters have already been compared with the results as
deduced from the ISO-SWS data in Sect. 3.5.2 in
Decin et al. (2003a). However, the uncertainties as given in
Decin et al. (2003a) were empirical values estimated from (1) the
intrinsic uncertainty on the synthetic spectrum (i.e., the possibility
to distinguish different synthetic spectra at a specific resolution,
i.e. there should be a significant difference in ![]() -values)
which is thus dependent on both the resolving power of the observation
and the specific values of the fundamental parameters; (2) the
uncertainty on the ISO-SWS spectrum which is directly related to the
quality of the ISO-SWS observation; (3) the value of the
-values)
which is thus dependent on both the resolving power of the observation
and the specific values of the fundamental parameters; (2) the
uncertainty on the ISO-SWS spectrum which is directly related to the
quality of the ISO-SWS observation; (3) the value of the
![]() -parameters in the KS-test; and (4) the still remaining
discrepancies between observed and synthetic
spectra. Decin et al. (2003a) obtained
-parameters in the KS-test; and (4) the still remaining
discrepancies between observed and synthetic
spectra. Decin et al. (2003a) obtained
![]() =
=
![]() K,
K,
![]() ,
and [Fe/H] =
,
and [Fe/H] =
![]() .
Comparing these results with
the ones as given in the previous section, we see that a combination
of both a global and a local deviation estimating parameter restricts
the uncertainty ranges for these 3 fundamental parameters in the case
of the ISO-SWS data of
.
Comparing these results with
the ones as given in the previous section, we see that a combination
of both a global and a local deviation estimating parameter restricts
the uncertainty ranges for these 3 fundamental parameters in the case
of the ISO-SWS data of ![]() Boo.
Boo.
Combining the results given in Table 5 with the angular
diameter values tabulated in Table 2, we obtain for
the angular diameter
![]() mas, mainly resulting
from the uncertainty in the effective temperature (compared to the
gravity and the metallicity). However, from
Eq. (2) in Decin et al. (2003b), one can see that in the case of the
ISO-SWS data the main uncertainty on the angular diameter is
determined from the uncertainty in the absolute flux level (being
mas, mainly resulting
from the uncertainty in the effective temperature (compared to the
gravity and the metallicity). However, from
Eq. (2) in Decin et al. (2003b), one can see that in the case of the
ISO-SWS data the main uncertainty on the angular diameter is
determined from the uncertainty in the absolute flux level (being ![]() 10%, see Sect. 2.1). Taking
this last uncertainty into account (as done in Eq. (2) in
Decin et al. 2003b), we obtain
10%, see Sect. 2.1). Taking
this last uncertainty into account (as done in Eq. (2) in
Decin et al. 2003b), we obtain
![]() =
=
![]() mas.
mas.
Uncertainty intervals as listed in Table D.3 in Decin et al. (2003a) are often intrinsic uncertainties or (sometimes) have been propagated from uncertainties in other parameters. However, as in this analysis, observational measurement uncertainties are never taken into account. As commented on in Decin et al. (2003a), we do see that the derived parameters from the ISO-SWS data are in good agreement with other listed values, but it should be noted that our uncertainty on the metallicity is quite large compared to other results. Several causes can be reported for this larger uncertainty range: (1) the used grid is not sensitive enough in the metallicity, and we should diminish the spacing in metallicity; (2) the used low-resolution ISO-SWS data are not that well suited to derive the metallicity; (3) the lack of a proper uncertainty estimate significantly underestimates the derived uncertainty ranges found in other studies.

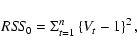
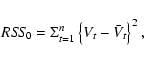
Lack-of-fit tests are an attractive tool for model diagnostics since
they allow us to asses the goodness-of-fit of a proposed model in a
formal way. For a comprehensive discussion on lack-of-fit tests we
refer to Hart (1997). In our setting, we wish to test the null
hypothesis
H0:E(Vt)=1 against the alternative hypothesis that
![]() where
where ![]() is a smooth function which is not
necessarily constant along the wavelength. For the remainder of this
section we first formulate the hypotheses to be tested in more detail,
review the test procedure proposed by Bowman & Azzalini (1997) and apply these
methods to our setting.
is a smooth function which is not
necessarily constant along the wavelength. For the remainder of this
section we first formulate the hypotheses to be tested in more detail,
review the test procedure proposed by Bowman & Azzalini (1997) and apply these
methods to our setting.
To test the hypotheses in Eq. (8), we used
the procedure as described by Bowman & Azzalini (1997). One therefore needs
to calculate the residual sum of squares under the two hypotheses and
compare them. Since the mean of Vt under H0 is
constant, the residual sum of squares under the null hypothesis is
To proceed further we need to find the distribution of F under the null hypothesis. This can be done using a bootstrap
procedure (Davison & Hinkley 1997) which we describe in more detail in the
appendix. Briefly, the bootstrap procedure we applied consists of
sampling B samples from the original sample while reflecting the null
hypothesis. For each bootstrap
sample we calculate the value of F. The empirical p-value of
the test statistics is simply the proportion of the bootstrap
statistics that is larger than the one observed in the original
sample. For a given significance level ![]() ,
one cannot reject the
null hypothesis if the p-value
,
one cannot reject the
null hypothesis if the p-value![]() .
.
To calculate the residual sum of squares under H1 we smooth Vt with Loess. Thus, the distribution of the test statistics in Eq. (11) depends on the choice of the smoothing parameter. As argued by Hart (1997), the smoothing parameter should be chosen in advance and should be fixed for all bootstrap samples. Therefore, our conclusion of whether to reject the null hypothesis or not depends on our choice of the smoothing parameter. A method to overcome this problem is to calculate the so-called "significance trace'' (Hart 1997 p. 160; Bowman & Azzalini 1997 p. 89). In this method, one computes the p-value for a wide range of smoothing parameters and the decision (whether to reject H0 or not) is based on the significance trace plot. This point will be illustrated in the following section (Sect. 5.2.1).
Table 6:
Empirical p-values in band 1A. The first column gives the
model number, and the second column the rank of the corresponding
model determined from the ![]() -value in band 1A. Empirical
p-values based on a bootstrap with B=1000 and smoothing parameter
-value in band 1A. Empirical
p-values based on a bootstrap with B=1000 and smoothing parameter
![]() are given in the third
and fourth column: the third column
shows the empirical p-values calculated under the null hypothesis
in Eq. (8), and the fourth column shows the empirical
p-values under the null hypothesis in Eq. (12). The last
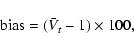
column gives the bias as determined from Eq. (14).
are given in the third
and fourth column: the third column
shows the empirical p-values calculated under the null hypothesis
in Eq. (8), and the fourth column shows the empirical
p-values under the null hypothesis in Eq. (12). The last
column gives the bias as determined from Eq. (14).
In addition to the hypotheses in Eq. (8) we test the following
hypotheses
Table 6 presents the results for the lack-of-fit tests for
the top 20 models in band 1A. For each synthetic spectrum 1000 bootstrap samples (B=1000) were drawn from the original sample as
described in the appendix. Whenever the empirical p-value is greater
than 0.05 the null hypothesis cannot be rejected. This means that the
relationship between Vt and t is assumed to be constant for all
models with p-value greater than 0.05.
(1) Testing
H0:E(Vt)= 1:
The third column in Table 6 presents the empirical p-values
calculated under the null hypothesis in Eq. (8).
Using a smoothing parameter
![]() for the Loess model, the empirical
p-values
are all 0. Thus, we reject H0 in Eq. (8) for all
models.
for the Loess model, the empirical
p-values
are all 0. Thus, we reject H0 in Eq. (8) for all
models.
(2) Testing
![]() :
:
The bias in the last column in Table 6 is defined as
We turn now to the discussion on the effect of smoothing
parameters on the estimation procedure which depends on the choice of
the smoothing
parameter of the Loess. To be able to calculate the p-value one needs
to construct the null
distribution
of the test statistics. This can be done only if the smoothing parameter is
held fixed for each bootstrap replication (e.g., see Hart 1997, Sect. 6.4). King et al. (1991) proposed to compute the
p-values corresponding to several
different choices of the smoothing parameter. The plot in which p-values
are plotted versus the smoothing parameter is called a "significance trace''.
Figure 11 shows the significance trace plot for model 51
for the
null hypothesis
![]() .
For all values of
.
For all values of ![]() the null
hypothesis is rejected (the p-value is below the horizontal line of 0.05). This means that the data do not support the
null hypothesis. The same conclusion can be drawn for all other models. The
fact that, for all models, the significance trace
for the null hypothesis
the null
hypothesis is rejected (the p-value is below the horizontal line of 0.05). This means that the data do not support the
null hypothesis. The same conclusion can be drawn for all other models. The
fact that, for all models, the significance trace
for the null hypothesis
![]() is below the 0.05 line regardless of
the choice of
the smoothing parameter means that the null hypothesis is rejected for
all possible values of the smoothing parameter.
is below the 0.05 line regardless of
the choice of
the smoothing parameter means that the null hypothesis is rejected for
all possible values of the smoothing parameter.
![\begin{figure}
\par\includegraphics[width=8.4cm,height=9.1cm,clip]{4480.f7}
\end{figure}](/articles/aa/full/2004/25/aah4480/img100.gif) |
Figure 7:
Band 1A: model 51 (
|
| Open with DEXTER | |
![\begin{figure}
\par\includegraphics[width=8.4cm,height=9.1cm,clip]{4480.f8}
\end{figure}](/articles/aa/full/2004/25/aah4480/img101.gif) |
Figure 8:
Band 1A: model 26 (
|
| Open with DEXTER | |
![\begin{figure}
\par\includegraphics[width=8.4cm,height=11.4cm,clip]{4480.f9}
\end{figure}](/articles/aa/full/2004/25/aah4480/img102.gif) |
Figure 9:
Band 1A: model 52 (
|
| Open with DEXTER | |
The results in bands 1B, 1D, and 1E are similar: the empirical p-values for all model were either zero or very close to zero. Hence, the null hypothesis in Eq. (8) was rejected for all models in the three bands which indicates that the synthetic spectra do not follow the same pattern as the rebinned observational data.
![\begin{figure}
\par\includegraphics[width=8.4cm,height=9.2cm,clip]{4480.f10}
\end{figure}](/articles/aa/full/2004/25/aah4480/img103.gif) |
Figure 10:
Band 1A: model 125 (
|
| Open with DEXTER | |
![\begin{figure}
\par\includegraphics[width=6.7cm,height=6.8cm,clip]{4480.f11}
\end{figure}](/articles/aa/full/2004/25/aah4480/img104.gif) |
Figure 11:
Significance trace for model 51 for the null
hypothesis
|
| Open with DEXTER | |
What are the lessons learned from the rejection of the null
hypothesis in so many cases? It may be clear
that this failure cannot be solved by relaxing the criteria, e.g. by
lowering the
level of significance ![]() .
These lack-of-fit tests are an objective tool
to demonstrate that there is still too much structure left in Vt. This is illustrated, e.g., in Figs. 12-15 where model 39 with a very good goodness-of-fit is
depicted in bands 1A, 1B, 1D, and 1E. As can be seen from the upper panel in
Fig. 12 the low-excitation 12CO lines are
often predicted as being too strong, while it is clearly visible in
the upper panel in Fig. 13 that the low-excitation
OH-lines are often predicted as being too
weak. This systematic discrepancy between observations and
theory is captured in Vt and its Loess smoother,
explaining why the lack-of-fit test rejects the null hypothesis. This
systematic problem is not solved by one of the other models
in the grid. Neither it is possible to solve this problem by reducing
the carbon abundance
.
These lack-of-fit tests are an objective tool
to demonstrate that there is still too much structure left in Vt. This is illustrated, e.g., in Figs. 12-15 where model 39 with a very good goodness-of-fit is
depicted in bands 1A, 1B, 1D, and 1E. As can be seen from the upper panel in
Fig. 12 the low-excitation 12CO lines are
often predicted as being too strong, while it is clearly visible in
the upper panel in Fig. 13 that the low-excitation
OH-lines are often predicted as being too
weak. This systematic discrepancy between observations and
theory is captured in Vt and its Loess smoother,
explaining why the lack-of-fit test rejects the null hypothesis. This
systematic problem is not solved by one of the other models
in the grid. Neither it is possible to solve this problem by reducing
the carbon abundance
![]() (C) or enhancing the oxygen
abundance
(C) or enhancing the oxygen
abundance
![]() (O), since then other molecular features are
mispredicted.
The described problem may be an outcome of three possible
reasons.
(1) We should enlarge our vector parameter
(O), since then other molecular features are
mispredicted.
The described problem may be an outcome of three possible
reasons.
(1) We should enlarge our vector parameter ![]() including not only
the effective temperature, the gravity, and the metallicity, but also
the carbon, nitrogen and oxygen abundance and the microturbulence,
thus enlarging our grid to a 7-dimensional grid. However, some first tests
done in the framework of the study in Decin (2000) do show that
this inflation of the parameter range does not solve the problem in
the case of
including not only
the effective temperature, the gravity, and the metallicity, but also
the carbon, nitrogen and oxygen abundance and the microturbulence,
thus enlarging our grid to a 7-dimensional grid. However, some first tests
done in the framework of the study in Decin (2000) do show that
this inflation of the parameter range does not solve the problem in
the case of ![]() Boo.
(2) Secondly, we have to consider that inaccuracies may occur in
the temperature distribution in the outermost layers of the model
photosphere (Decin et al. 2003b), indicating that some assumptions, on
which the theoretical models are based, are questionable for cool
stars. One of the assumptions in the MARCS-code is that radiative
equilibrium is required, also for the outermost layers. This implies
that temperature bifurcation, caused by e.g. effects of convection and
convective overshoot with inhomogeneities in the upper photosphere,
cannot be allowed for. Consequently the cores of e.g. the satured CO
and OH lines are not predicted with full success, resulting in a systematic
pattern in Vt and so to a rejection of the null
hypothesis. At least for
Boo.
(2) Secondly, we have to consider that inaccuracies may occur in
the temperature distribution in the outermost layers of the model
photosphere (Decin et al. 2003b), indicating that some assumptions, on
which the theoretical models are based, are questionable for cool
stars. One of the assumptions in the MARCS-code is that radiative
equilibrium is required, also for the outermost layers. This implies
that temperature bifurcation, caused by e.g. effects of convection and
convective overshoot with inhomogeneities in the upper photosphere,
cannot be allowed for. Consequently the cores of e.g. the satured CO
and OH lines are not predicted with full success, resulting in a systematic
pattern in Vt and so to a rejection of the null
hypothesis. At least for ![]() Boo, recent studies done by
Ryde et al. (2002) show that the outermost surface
layers may be a few hundreds of Kelvin cooler than predicted by the
MARCS code.
(3) Inaccuracies in the (satellite) data-reduction process
result in (non)-rebinned data being systematically off from the "true''
stellar spectrum. A problem with the Relative Spectral Response
Function (RSRF) at the shorter wavelenghts of band 1A has already been
reported by Decin et al. (2003b). Since the data are divided by the RSRF,
a small problem with the RSRF at these places may introduce a
pronounced error at the band edge. This kind of data-reduction
problem can never be captured by the synthetic
predictions, thus resulting in a systematic rejection of the null
hypothesis. Using lack-of-fit tests for a sample of standard stars covering a
broad parameter space, one can trace calibration problems.
Boo, recent studies done by
Ryde et al. (2002) show that the outermost surface
layers may be a few hundreds of Kelvin cooler than predicted by the
MARCS code.
(3) Inaccuracies in the (satellite) data-reduction process
result in (non)-rebinned data being systematically off from the "true''
stellar spectrum. A problem with the Relative Spectral Response
Function (RSRF) at the shorter wavelenghts of band 1A has already been
reported by Decin et al. (2003b). Since the data are divided by the RSRF,
a small problem with the RSRF at these places may introduce a
pronounced error at the band edge. This kind of data-reduction
problem can never be captured by the synthetic
predictions, thus resulting in a systematic rejection of the null
hypothesis. Using lack-of-fit tests for a sample of standard stars covering a
broad parameter space, one can trace calibration problems.
In general, we may conclude that a systematic rejection of the null hypothesis in the lack-of-fit tests is an indication of a still incomplete modelling of all the physical mechanisms determining the spectral footprint in the wavelength range considered or of problems with the data reduction.
![\begin{figure}
\par\includegraphics[width=8.6cm,height=9.5cm,clip]{4480.f12}
\end{figure}](/articles/aa/full/2004/25/aah4480/img106.gif) |
Figure 12: Band 1A. Upper panel: comparison between the rebinned data (solid line) and theoretical data of model 39 (dashed line). Lower panel: Vt and the Loess smoother. |
| Open with DEXTER | |
![\begin{figure}
\par\includegraphics[width=8.6cm,height=9.5cm,clip]{4480.f13}
\end{figure}](/articles/aa/full/2004/25/aah4480/img107.gif) |
Figure 13: Band 1B. Upper panel: comparison between the rebinned data (solid line) and theoretical data of model 39 (dashed line). Lower panel: Vt and the Loess smoother. |
| Open with DEXTER | |
![\begin{figure}
\par\includegraphics[width=8.6cm,height=9.5cm,clip]{4480.f14}
\end{figure}](/articles/aa/full/2004/25/aah4480/img108.gif) |
Figure 14: Band 1D. Upper panel: comparison between the rebinned data (solid line) and theoretical data of model 39 (dashed line). Lower panel: Vt and the Loess smoother. |
| Open with DEXTER | |
![\begin{figure}
\par\includegraphics[width=8.4cm,height=9.3cm,clip]{4480.f15}
\end{figure}](/articles/aa/full/2004/25/aah4480/img109.gif) |
Figure 15: Band 1E. Upper panel: comparison between the rebinned data (solid line) and theoretical data of model 39 (dashed line). Lower panel: Vt and the Loess smoother. |
| Open with DEXTER | |
In the first part of this article (Sects. 3 and 4)
we have demonstrated that the use of either a local or a
global goodness-of-fit parameter is an important first step to
objectively determine the uncertainty range on the estimated
parameters. But a very important message is that combining both
a local and a global
deviation estimating parameter allows us to pin down the
parameters with even more certainty.
In the test-case of the ISO-SWS data of ![]() Boo, we
estimate the stellar parameters
Boo, we
estimate the stellar parameters
![]() ,
,
![]() and metallicity as ranging
respectively from 4160 K to 4300 K, from 1.35 to 1.65 dex, and from -0.30 to 0.00 dex using synthetic spectra calculated from
MARCS model atmospheres.
and metallicity as ranging
respectively from 4160 K to 4300 K, from 1.35 to 1.65 dex, and from -0.30 to 0.00 dex using synthetic spectra calculated from
MARCS model atmospheres.
Having determined the "best'' models is however not the end of the story.
The use of lack-of-fit tests enables us to detect systematic patterns
in the difference between observed and theoretical data.
For the case-study of ![]() Boo, we obtained that
in all the 4 sub-bands the closest synthetic
spectra to the observational data are not capable of capturing all the
structure from the data, i.e. the "best'' models are not "good''
enough. Both gaps in our knowledge of the physical
mechanisms taking place during the life of a star, too simple assumptions in the
theoretical modelling, uncertainties in additional stellar
parameters - which are now kept fixed - and satellite data
reduction problems may result in the rejection of the null hypothesis in
the lack-of-fit tests.
Boo, we obtained that
in all the 4 sub-bands the closest synthetic
spectra to the observational data are not capable of capturing all the
structure from the data, i.e. the "best'' models are not "good''
enough. Both gaps in our knowledge of the physical
mechanisms taking place during the life of a star, too simple assumptions in the
theoretical modelling, uncertainties in additional stellar
parameters - which are now kept fixed - and satellite data
reduction problems may result in the rejection of the null hypothesis in
the lack-of-fit tests.
As was illustrated by the example of the ISO-SWS data of ![]() Boo, the
statistical methods presented in this paper for comparing observational
and synthetic data provide useful, practical and general tools:
(1) to estimate objectively the stellar parameters and
their uncertainties from observational data and a grid of synthetic
spectra; (2) to refine the uncertainty intervals by combining a local
and a global goodness-of-fit parameter;
and (3) to trace if our knowledge of the physical mechanisms
in a star, of the theoretical (numerical) modelling of the stellar photosphere
or of the calibration process still need considerable refinement. The
main limitation of this
methodology is that measurement errors are still not included. In the
following paper in this series (Shkedy et al., submitted) we
will use hierarchical Bayesian
models for the spectrum. In this approach,
the measurement errors will be incorporated in the model as well.
Boo, the
statistical methods presented in this paper for comparing observational
and synthetic data provide useful, practical and general tools:
(1) to estimate objectively the stellar parameters and
their uncertainties from observational data and a grid of synthetic
spectra; (2) to refine the uncertainty intervals by combining a local
and a global goodness-of-fit parameter;
and (3) to trace if our knowledge of the physical mechanisms
in a star, of the theoretical (numerical) modelling of the stellar photosphere
or of the calibration process still need considerable refinement. The
main limitation of this
methodology is that measurement errors are still not included. In the
following paper in this series (Shkedy et al., submitted) we
will use hierarchical Bayesian
models for the spectrum. In this approach,
the measurement errors will be incorporated in the model as well.
Acknowledgements
L.D. acknowledges support from the Science Foundation of Flanders. Z.S. and G.M. gratefully acknowledge support from the Belgian IUAP/PAI network "Statistical Techniques and Modeling for Complex Substantive Questions with Complex Data".
Non-parametric regression models aim to describe the relationship
between a response variable y and a predictor x. The model has the
general form of
For a further discussion about Loess, which stands for "local regression'', we refer to Cleveland (1979) and the book of Bowman & Azzalini (1997). An intuitive introduction about Loess can be found in Cleveland (1993). The book of (Hart 1997) gives a comprehensive discussion about smoothing and data driven choice of the smoothing parameter.
We applied the following bootstrap procedure in order to calculate the empirical p-values.
![\begin{figure}
\par\includegraphics[width=8.2cm,height=9cm,clip]{4480.fapp1}
\end{figure}](/articles/aa/full/2004/25/aah4480/img110.gif)