A&A 420, 383-388 (2004)
DOI: 10.1051/0004-6361:20034507
A study of Trans-Neptunian object 55636 (2002
TX300)
J. L. Ortiz1 - A. Sota1
- R. Moreno2 - E. Lellouch3
- N. Biver3 - A. Doressoundiram3 - P. Rousselot4
- P. J. Gutiérrez1,5 - I. Márquez1 - R. M. González Delgado1 - V. Casanova1
1 - Instituto de Astrofísica de Andalucía, CSIC, Apt 3004, 18080 Granada, Spain
2 - I.R.A.M., 300 rue de la Piscine, 38406 St-Martin d'Hères Cedex,
France
3 -
Observatoire de Paris, 5 place J. Jansen, 92195 Meudon, France
4 - Observatoire de Besançon, BP 1615, 25010 Besançon Cedex, France
5 - Laboratoire d'Astrophysique de Marseille,
Traverse du Siphon, BP 8, 13376 Marseille Cedex 12, France
Received 13 October 2003 / Accepted 3 March 2004
Abstract
We report on physical properties of the bright Trans-Neptunian
Object 2003 TX300 based on a large set of observations taken in
different wavelength ranges. Broad
band CCD observations aimed at studying the short-term rotational variability show a
low amplitude periodic signal of
 h. We cannot yet
determine
whether the lightcurve is single-peaked (i.e. the rotation period would
be 7.89 h) or double-peaked (i.e. the actual spin period would be
15.78 h). From a sinusoidal fit, the peak to peak amplitude of the brightness changes is
h. We cannot yet
determine
whether the lightcurve is single-peaked (i.e. the rotation period would
be 7.89 h) or double-peaked (i.e. the actual spin period would be
15.78 h). From a sinusoidal fit, the peak to peak amplitude of the brightness changes is
 mag.
If
the brightness changes are due to irregular shape, this amplitude
implies a minimum axial ratio of 1.09. BVRI
photometry indicates similar colors as other large Kuiper
Belt members, with
mag.
If
the brightness changes are due to irregular shape, this amplitude
implies a minimum axial ratio of 1.09. BVRI
photometry indicates similar colors as other large Kuiper
Belt members, with
 ,
,
 ,
and
,
and
 .
Thermal observations at 250 GHz (1.2 mm) result in no confident
detection of the body, with a measured flux of
.
Thermal observations at 250 GHz (1.2 mm) result in no confident
detection of the body, with a measured flux of
 mJy.
Combining
all the data and using the same thermophysical model as
in Lellouch et al. (2002) we find (at a 3-
mJy.
Combining
all the data and using the same thermophysical model as
in Lellouch et al. (2002) we find (at a 3- confidence level) a lower limit for the geometric albedo (pv>0.06) and an
upper limit for the size of this object (D< 1110 km). A more relaxed 2-
confidence level implies a diameter D< 907 km and an albedo pv> 0.08, which is significantly higher than the typical 0.04 cometary value and also higher than that of Varuna.
confidence level) a lower limit for the geometric albedo (pv>0.06) and an
upper limit for the size of this object (D< 1110 km). A more relaxed 2-
confidence level implies a diameter D< 907 km and an albedo pv> 0.08, which is significantly higher than the typical 0.04 cometary value and also higher than that of Varuna.
Key words: minor planets, asteroids
- Kuiper Belt
Large Trans-Neptunian Objects (TNOs) are important bodies because they are
the only Kuiper Belt objects for which a significant number of properties
can be derived. Their brightness is just sufficient for the largest
telescopes in the world to observe them in spectroscopy mode, which gives us
important hints on composition and surface properties. Other observing techniques can be applied; in particular, their thermal
emission can be measured in order to derive albedos and sizes.
Except for the specific case of binary objects, physical information on TNOs is very limited. Broad band BVRI photometry aimed at deriving color information is feasible with most of the TNOs, but spectroscopic and other detailed studies are restricted to large TNOs.
Very large TNOs like 50 000 Quaoar, 20 000 Varuna, 28 978 Ixion, 38 628 Huya (2000
EB173), 2002 AW197, etc.
have been studied in some detail and important properties have been derived (see
e.g.
Jewitt & Sheppard 2002; Brown & Trujillo 2004). Perhaps one of the
most remarkable findings is the fact that they may be "rubble pile'' low-density very porous
objects not far from critical rotation (with rotation periods close to
the value for which the centrifugal force can break up the body). Their shapes may therefore be
considerably distorted
(at least in the case of Varuna) as a response to rotation (Jewitt & Sheppard 2002).
In October 2002 a potentially very large new TNO with designation 2002 TX300 was discovered, which
offered an excellent opportunity to increase our knowledge on the Kuiper Belt. With that goal in mind, we tried to get as much information on 2002 TX300 as possible.
Coordinated observational campaigns were arranged on 4 different
telescopes with the aim of deriving several important properties,
including albedo, for which thermal observations in the millimetric range were
needed in combination with optical data. The longest observing runs were
devoted to determining the
period and amplitude of the suspected short-term variability due to
rotation. Other runs were scheduled for regular high signal-to-noise
BVRI photometry. The main results of the coordinated campaign are
summarized here.
Table 1:
Dates and geometric data (range) of the observations.  is heliocentric distance,
  is geocentric distance and
  is phase angle.
A log of the observations is shown in Table 1.
The CCD observations focused on short-term variability were carried out with
the Instituto de Astrofísica de Andalucía 1.5 m
telescope at Sierra Nevada Observatory, in Granada, Spain.
The data were obtained on November 28, 29, 30 and on December 2, 3, 4 and 6, 2002.
The typical exposure time was 100 s (short enough to avoid noticeable
trailing under the best seeing conditions, but long enough so that the sky
background was the dominating noise source). To get a good
enough signal to noise ratio, most of the observations were obtained with
no filter. The typical seeing during the observations ranged from 1.3
arcsec to 2.2 arcsec, with median around 1.6 arcsec. A fast readout CCD
was used so that the overhead was not a significant fraction of the observing nights.
The CCD chip format is
 pixels and the total field of
view is
pixels and the total field of
view is
 .
The images were bias subtracted in the
standard way and flat-fielded using the median of a large set of twilight
images. No cosmic ray removal algorithms were used and we simply rejected
the few images in which a cosmic ray hit was close to the object. Relative
photometry using seven field stars was carried out by means of
Daophot routines as implemented in the IDL astronomical library. The synthetic aperture used was typically 8 to 12 pixels
in diameter (the smallest possible in order to get the highest signal to
noise ratio). These apertures correspond to 3.2 to 4.8 arcsec on the sky. Care was taken not to introduce spurious signals of faint
background stars or galaxies in the aperture. In cases where the TNO was
close to faint stars or galaxies, the data were rejected.
More than 500 images were obtained and a total of 469 images were used.
.
The images were bias subtracted in the
standard way and flat-fielded using the median of a large set of twilight
images. No cosmic ray removal algorithms were used and we simply rejected
the few images in which a cosmic ray hit was close to the object. Relative
photometry using seven field stars was carried out by means of
Daophot routines as implemented in the IDL astronomical library. The synthetic aperture used was typically 8 to 12 pixels
in diameter (the smallest possible in order to get the highest signal to
noise ratio). These apertures correspond to 3.2 to 4.8 arcsec on the sky. Care was taken not to introduce spurious signals of faint
background stars or galaxies in the aperture. In cases where the TNO was
close to faint stars or galaxies, the data were rejected.
More than 500 images were obtained and a total of 469 images were used.
The typical error bars of the photometry in the individual 100 s integrations were
around 0.06 mag. This could be improved considerably by
"median averaging'' the large amount of relative
photometry data points. The approach of averaging is similar to
using longer integration times, but has the advantage that no trails
are present in the images, cosmic ray hits are fewer and images are also
less smeared by errors in the autoguider.
2002 TX300 was observed on 29-30 October 2002 and 30-31 October 2002
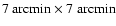
at the 3.6-m Canada-France-Hawaii telescope. We used the CFH12k panoramic CCD camera, which is a mosaic of 12
 K CCD devices, covering a field of
 square arcmin with
0.2 arcsec per pixel. The first night was not photometric with thick cirrus covering
most of the sky, and the seeing was 0.8-1.0 arcsec. The second night was photometric.
Thus, relative photometry was performed on 2002 TX300 the first night and then
calibrated on the second night. The 2002 TX300 brightness was monitored the first
night during almost 6 h through Mould BVRI broadband filters.
square arcmin with
0.2 arcsec per pixel. The first night was not photometric with thick cirrus covering
most of the sky, and the seeing was 0.8-1.0 arcsec. The second night was photometric.
Thus, relative photometry was performed on 2002 TX300 the first night and then
calibrated on the second night. The 2002 TX300 brightness was monitored the first
night during almost 6 h through Mould BVRI broadband filters.
All the images of 2002 TX300 were bias-subtracted
using an averaged bias image. They were flat-fielded
using the median set of dithered images of the twilight
sky. We used the MIDAS package to perform this data
processing. Similar processing was performed on the images acquired
during the following night and concerning the standard stars
and the field containing 2002 TX300.
Since 2002 TX300 was observed during a non-photometric
night we computed its absolute magnitudes in a two-step
process. First we computed the absolute magnitude of five different
stars by using the images obtained the following night. These
images were obtained with the same filters and the same field
of view. It was possible to
perform a good photometric reduction for this night
by using the IRAF package. Second,
we used the same five stars as reference stars for the
images containing 2002 TX300 and obtained during the
non-photometric night. The final absolute magnitudes
of 2002 TX300 were computed
by averaging the five magnitudes computed using
the reference stars and their relative difference in magnitude
with the target. To obtain a signal-to-noise ratio
as good as possible we used a 10-pixel diameter (i.e. about
two times the FWHM) for the flux measurement of 2002 TX300and of the five reference stars.
The observations consisted of 300s integrations in the R band, taken on
Nov., 6 and 7 with the ALFOSC instrument on the 2.5 m Nordic Optical
Telescope at La Palma (Spain). The field of view of the
 camera was
 arcmin, with a pixel scale of
0.188 arcsec. Four images per night were
taken on 2002 TX300,
at approximate intervals of one hour. However, one of the images had to be
discarded because 2002 TX300 was too close to a background object.
The images were bias subtracted and flatfielded using a median of
twilight sky flats. The photometry was carried out by means of Daophot
routines. The photometry was computed relative to 7 field stars. The
aperture radius used for the synthetic aperture photometry was 20 pixels (3.8 arcsec).
The seeing was of the order of 2.4 arcsec on the first night and close to 1.2 arcsec on the second
night.
arcmin, with a pixel scale of
0.188 arcsec. Four images per night were
taken on 2002 TX300,
at approximate intervals of one hour. However, one of the images had to be
discarded because 2002 TX300 was too close to a background object.
The images were bias subtracted and flatfielded using a median of
twilight sky flats. The photometry was carried out by means of Daophot
routines. The photometry was computed relative to 7 field stars. The
aperture radius used for the synthetic aperture photometry was 20 pixels (3.8 arcsec).
The seeing was of the order of 2.4 arcsec on the first night and close to 1.2 arcsec on the second
night.
The thermal observations were conducted with the IRAM 30-m
radiotelescope in Sierra Nevada (Granada, Spain) on seven dates during the 2002-2003 winter
(Dec. 6, 7, and 12, 2002; Jan. 28, Feb. 3, and Mar. 11 and 12, 2003).
We used the Max Planck Institut für Radio Astronomie 117-element bolometer
array. The beams have a half-power width of 11
 and
are separated by
and
are separated by  20
.
The instrument has a bandwidth of
about 60 GHz, and an effective frequency close to 250 GHz (1.2 mm). Observations of 2002 TX300 were performed in "on-off" mode,
in which the subreflector of the telescope was alternately
(with a 2 Hz frequency) looking at the target and at a sky position 32
away
in azimuth (either to the left or right of the source, alternating
every 10 s). While this procedure subtracts most of the
atmospheric emission, the photometric accuracy is determined
in part by the ability to eliminate its temporal fluctuations. Our multibeam
observations allow us to estimate the latter from the channels adjacent
to the central channel.
20
.
The instrument has a bandwidth of
about 60 GHz, and an effective frequency close to 250 GHz (1.2 mm). Observations of 2002 TX300 were performed in "on-off" mode,
in which the subreflector of the telescope was alternately
(with a 2 Hz frequency) looking at the target and at a sky position 32
away
in azimuth (either to the left or right of the source, alternating
every 10 s). While this procedure subtracts most of the
atmospheric emission, the photometric accuracy is determined
in part by the ability to eliminate its temporal fluctuations. Our multibeam
observations allow us to estimate the latter from the channels adjacent
to the central channel.
All bolometric measurements were obtained as "pooled observations" (i.e., service mode).
Pointing and focus of the telescope were determined by measurements on the quasar 3C 454.3
and flux calibration on Uranus. The zenith atmospheric opacity at 250 GHz was measured from sky measurements
at several elevations (skydip). Depending on the observing date, on-off measurements
were performed during 15 to 40 min (4 to 10 loops of 20 10-s subscans,
plus overheads). Observations were performed in good weather conditions (zenith
sky opacity = 0.1-0.25). Atmospheric stability was good, except on Dec. 12 and Mar. 12
where large fluctuations of the opacity occurred. These two
measurements were not considered, leaving us with a total
of five individual measurements of 2002 TX300 1.2 mm flux (see Table 2).
Data reduction was performed using both the NIC and MOPSI software packages,
and very similar results were obtained. The basic reduction processes consist of I)
despiking the data, II) computing the ON minus OFF phases III) reducing the sky noise
by applying a noise removal algorithm based on beam-to-beam correlation
IV) correcting the central channel flux by mean flux from adjacent channels, in order to
remove possible residual continuum offsets.
![\begin{figure}
\par\includegraphics[angle=90,width=8.1cm,clip]{0507fig1.ps}
\end{figure}](/articles/aa/full/2004/22/aa0507/Timg19.gif) |
Figure 1:
Periodogram of the Sierra Nevada data. The highest peak corresponds to 3.04 cycles per day or approximately 7.89 h. |
| Open with DEXTER |
![\begin{figure}
\par\includegraphics[width=8.3cm,height=8.6cm,clip,angle=90]{0507...
...degraphics[width=8.3cm,height=8.6cm,clip,angle=90]{0507fig3.ps}
\par\end{figure}](/articles/aa/full/2004/22/aa0507/Timg20.gif) |
Figure 2:
Left: lightcurve of 2002 TX300 phased to a rotation period of 7.89762 h. The bottom plot corresponds to the raw Sierra Nevada data, with different symbols for the different dates of observation. A sinusoidal fit has been superimposed. The upper plot corresponds to the median of the Sierra Nevada data, in small phase bins. The middle plot shows the median of the Sierra Nevada data (triangles) as well as the NOT data (diamonds) and the CFHT data (squares). Right: same but for a rotation period of 15.7942 h. |
| Open with DEXTER |
The time-resolved CCD photometry files were inspected for periodicities by means
of the Lomb technique (Lomb 1976) as described in Press et al. (1992).
The periodogram of the Sierra Nevada data alone (see Fig. 1) shows a highly significant periodicity peak (exceeding the 99.9% confidence level) at
h
(
 cycles per day). The periodogram shows other peaks
located at approximately
4.04 cycles/day, 2.04 cycles/day, and 1.04 cycles/day. These peaks are
daily aliases of the most significant frequency. In particular, the peak
at approximately 2.04 cycles/day or 11.8 h has a similar spectral power to the
main peak, and therefore cannot be entirely ruled out as the actual
rotation period. According to the
periodogram, the most significant peak would imply a rotation period of either 7.89 h or
cycles per day). The periodogram shows other peaks
located at approximately
4.04 cycles/day, 2.04 cycles/day, and 1.04 cycles/day. These peaks are
daily aliases of the most significant frequency. In particular, the peak
at approximately 2.04 cycles/day or 11.8 h has a similar spectral power to the
main peak, and therefore cannot be entirely ruled out as the actual
rotation period. According to the
periodogram, the most significant peak would imply a rotation period of either 7.89 h or
 h depending on whether the
lightcurve is single-peaked or double-peaked, respectively.
h depending on whether the
lightcurve is single-peaked or double-peaked, respectively.
Using the few NOT data points one can also carry out a periodogram
analysis. It turns out that the same high periodicity peak as in the Sierra Nevada
data is also present in
the NOT data, although the width of the peak is larger and the confidence
level much lower, because of the few data points. From these data, the periodicity peak is
at
 h.
h.
The rotational phase curves which result from the combination of all the data sets using two different periods
(the photometric one and twice that value) are shown in Fig. 2. In this figure, three kinds of lightcurves are shown. The raw data from the Sierra Nevada run are
shown at the bottom, a median of those data in small phase bins is shown at the top, and the middle
plot corresponds to the median of the Sierra Nevada data, as well as the NOT and CFHT data,
all combined.
Prior to combining all the data (normalized to their respective mean
values), the observation times were corrected for light travel time. Comparing both
figures, there is
no clear indication that the lightcurve for the 7.89 h period is any better than for
 h. Thus, we cannot conclude if the lightcurve is
single-peaked or double-peaked, and therefore whether the actual spin
period is 7.89 h or 15.78 h.
h. Thus, we cannot conclude if the lightcurve is
single-peaked or double-peaked, and therefore whether the actual spin
period is 7.89 h or 15.78 h.
By fitting a sinusoidal function to the data, the
amplitude of the lightcurve is
mag.
The fact that the amplitude of the 2002 TX300 lightcurve is small can indicate either that the
variability is caused mainly by albedo distributions on the surface and/or by a slightly
irregular shape. Another possibility is that the body is viewed nearly pole on.
A double-peaked lightcurve could be an indication of
irregularity, but as is well known, almost any lightcurve can be fitted by appropriate
albedo distributions (Russell 1906) in a spherical body. Nonetheless, our lightcurve
phased to a
h period
does not show clear evidence of a double-peaked structure.
If the observed variability were due to albedo variegations on the
surface of a spherical body, the amplitude of the lightcurve would imply
local albedo constrasts higher than 9%. On the other hand, if the
variability were
due to the elongation of the body, the amplitude would imply a minimum
axial ratio of 1.09 for an aspect angle of 90 deg (1.25 if the aspect
angle were 60 deg).
By equating the spin period to the expression of the critical rotation
period one can get a lower limit on the density. If the body is assumed
to be spherical with no tensile strength, and rotating with a spin
period of 7.89 h, the lower limit for the density to avoid spontaneous
break up would be approximately 175 kg/m3, using the expressions given in
Davidsson (1999). If the spin period is 15.78 h, the lower limit to the density would then be approximately 43 kg/m3. On the other hand, if the
body is assumed to be prolate with no tensile strength, the lower limit for the density can be
estimated from the expresions given by Davidsson
(2001).
For an axial ratio of 1.09 and assuming an aspect angle of 90 deg, the lower limits for
the density would be 192 kg/m3 if the body is rotating with a spin
period of 7.89 h, or 48 kg/m3 if the spin period is twice the
photometric periodicity. The lower limit for the density would be larger
for smaller aspect angles.
![\begin{figure}
\par\includegraphics[width=8.3cm,height=8.8cm,clip,angle=90,]{0507fig4.ps}
\end{figure}](/articles/aa/full/2004/22/aa0507/Timg25.gif) |
Figure 3:
BVRI magnitudes obtained from CFHT data. Asterisks represent the B data, diamonds correspond to V, triangles correspond to R data and squares correspond to I data. |
| Open with DEXTER |
In Fig. 3, the data in BVRI are shown.
The average magnitudes for each band taken from the data shown in that figure are
 ,
,
 ,
,
 ,
and
,
and
 .
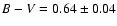
Thus, the average B-V, V-R and R-I colors are
.
Thus, the average B-V, V-R and R-I colors are
 ,
,
 ,
and
,
and
 ,
respectively.
,
respectively.
The five individual measurements of 2002 TX300's 1.2 mm flux are summarized
in Table 2. Averaging the five flux measurements of Table 1
formally gives a mean flux of
 mJy. From this result we
finally conclude that the object is not detected in our bolometric
observations and adopt a 1-
(resp. 2-
and 3-)
upper limit
of 0.51 (resp. 1.02, 1.53) mJy for its 1.2 mm flux. The values pertain to
mean helio- and geo-centric distances
mJy. From this result we
finally conclude that the object is not detected in our bolometric
observations and adopt a 1-
(resp. 2-
and 3-)
upper limit
of 0.51 (resp. 1.02, 1.53) mJy for its 1.2 mm flux. The values pertain to
mean helio- and geo-centric distances
 AU and
= 40.969
AU, respectively.
We can combine all the data sets to derive meaningful information
on albedo and size. As previously discussed in the case of Varuna (Lellouch et al. 2002) for which the general
equations were given, the thermal flux of a dark and quickly rotating TNO, assumed spherical,
is primarily dependent on its diameter. The thermal flux also depends on
the object emissivity and on orientation parameters (i.e. the sub-Earth and sub-solar
latitudes), but is rather insensitive to the precise value of visible geometric albedo
pv and thermal inertia
AU and
= 40.969
AU, respectively.
We can combine all the data sets to derive meaningful information
on albedo and size. As previously discussed in the case of Varuna (Lellouch et al. 2002) for which the general
equations were given, the thermal flux of a dark and quickly rotating TNO, assumed spherical,
is primarily dependent on its diameter. The thermal flux also depends on
the object emissivity and on orientation parameters (i.e. the sub-Earth and sub-solar
latitudes), but is rather insensitive to the precise value of visible geometric albedo
pv and thermal inertia  .
The relative independence on albedo stems from the
(1-
.
The relative independence on albedo stems from the
(1- )0.25 dependence of the equilibrium temperature, where ,
the Bond albedo,
is likely to be even smaller than pv, given the observed correlation of phase integral (q) with pv for airless bodies (Lellouch et al. 2000a). A typical value of
)0.25 dependence of the equilibrium temperature, where ,
the Bond albedo,
is likely to be even smaller than pv, given the observed correlation of phase integral (q) with pv for airless bodies (Lellouch et al. 2000a). A typical value of
 can be adopted, corresponding e.g. to
pv = 0.08 and q = 0.4. The independence
on thermal inertia is due to the fact that with a period of several hours and a
typical temperature of 40-45 K,
the thermal parameter
can be adopted, corresponding e.g. to
pv = 0.08 and q = 0.4. The independence
on thermal inertia is due to the fact that with a period of several hours and a
typical temperature of 40-45 K,
the thermal parameter  (defined
e.g. in Spencer et al. 1989) is much
larger than 1 for any plausible value of ,
so that surface temperatures are
independent on local time, i.e. constant over latitude bands ("fast rotator" regime).
In contrast, the temperature vs. latitude function is strongly dependent on the
sub-solar latitude, which is unknown given the unconstrained polar axis direction.
In Varuna's case, the presence of a well-marked visible lightcurve argued in
favor of a sub-solar (
(defined
e.g. in Spencer et al. 1989) is much
larger than 1 for any plausible value of ,
so that surface temperatures are
independent on local time, i.e. constant over latitude bands ("fast rotator" regime).
In contrast, the temperature vs. latitude function is strongly dependent on the
sub-solar latitude, which is unknown given the unconstrained polar axis direction.
In Varuna's case, the presence of a well-marked visible lightcurve argued in
favor of a sub-solar (
 )
and sub-Earth
(
)
and sub-Earth
(
 )
latitude close to 0
)
latitude close to 0 (Lellouch et al. 2000a). For 2002 TX300, we consider two limiting cases: (i)
 (Sun and Earth in Equatorial plane)
and (ii)
(Sun and Earth in Equatorial plane)
and (ii)
 (Sun and Earth on Polar axis,
with one hemisphere entirely in shadow). The local temperature is
also a function of the surface bolometric emissivity (
(Sun and Earth on Polar axis,
with one hemisphere entirely in shadow). The local temperature is
also a function of the surface bolometric emissivity (
 ), and
the emitted thermal flux
additionally depends on the spectral emissivity at the wavelength of the
measurements (
), and
the emitted thermal flux
additionally depends on the spectral emissivity at the wavelength of the
measurements (
 ). These parameters are entirely unknown for TNOs, and by analogy with
Pluto (Lellouch et al. 2000a,b),
we adopt
). These parameters are entirely unknown for TNOs, and by analogy with
Pluto (Lellouch et al. 2000a,b),
we adopt
 and
and
 .
We finally neglect any beaming effect for the thermal radiation. Maximum surface
temperatures for the two cases are indicated in Table 3, as well as the
1-, 2- and 3-sigma upper limits on the object diameter.
.
We finally neglect any beaming effect for the thermal radiation. Maximum surface
temperatures for the two cases are indicated in Table 3, as well as the
1-, 2- and 3-sigma upper limits on the object diameter.
Table 2:
IRAM 30-m observations.
Visible measurements, as described above, indicate a mean magnitude
V = 19.605on Oct. 30, 2002, i.e. at
 AU,
AU,
 AU. Neglecting
any phase effects, the upper limits on the diameter, along with this
value of V, imply lower limits to the object albedo, as detailed in
Table 3.
Adopting the 2-
confidence level, and taking the mean values for the
two orientation models discussed above, we conclude that 2002 TX300 has
a maximum equivalent diameter of 907 km and a minimum visible geometric
albedo of 8.4%. A tighter 3-
confidence level implies a maximum diameter of 1110 km and a minimum V geometric albedo of 5.6%.
Since the object has virtually the same color (
V-R = 0.40) as the Sun (V-R=0.36), this
lower limit is also very close for the red albedo (8.7%, 5.3% for 2-
and 3-
respectively).
AU. Neglecting
any phase effects, the upper limits on the diameter, along with this
value of V, imply lower limits to the object albedo, as detailed in
Table 3.
Adopting the 2-
confidence level, and taking the mean values for the
two orientation models discussed above, we conclude that 2002 TX300 has
a maximum equivalent diameter of 907 km and a minimum visible geometric
albedo of 8.4%. A tighter 3-
confidence level implies a maximum diameter of 1110 km and a minimum V geometric albedo of 5.6%.
Since the object has virtually the same color (
V-R = 0.40) as the Sun (V-R=0.36), this
lower limit is also very close for the red albedo (8.7%, 5.3% for 2-
and 3-
respectively).
2002 TX300's visual geometric albedo is therefore larger than the canonical 0.04 value of
cometary nuclei.
Varuna's albedo has been measured by Jewitt & Sheppard (2002) and Lellouch et al. (2002).
Quaoar's albedo has also been
reported (Brown & Trujillo 2004), as well as the albedo of object 2003 AW197
(Margot et al. 2002).
Judging from the lower limit to the albedo of 2002 TX300 derived here and the values of
the few other large TNOs whose albedos have been measured (see Table 4), it appears that TNOs might be
intrinsically brighter than most comet nuclei, although this might be the case of just the
largest TNOs, or of TNOs with high inclination orbits, like the brightest TNOs
discovered so far. More light on this issue will be shed when the
albedos of more, including fainter, TNOs
will be measured by SIRTF, and later by Herschel.
Table 3:
Temperature/Diameter/Albedo information.
Table 4:
List of albedos of large TNOs.
From a large set of observations of 2002 TX300,
short-term variability with a peak to peak amplitude of
mag has been detected.
The photometric period is
h and the variability can be caused by albedo distributions
on the surface, by irregular shape or by a combination of both effects.
We do not have convincing arguments to favor any of the possibilities yet.
In particular, we cannot determine whether the rotation period is 7.89 h or twice that value.
By combining the data in the visible with the thermal observations at 1.2 mm, a lower
limit of 0.056 to the V geometric albedo and an upper limit of
1110 km to the size of the object have been obtained at the 3- level. The object shows
approximately neutral colors.
Acknowledgements
We are grateful to the Sierra Nevada Observatory staff.
This research was partially based on data obtained at the Observatorio de Sierra
Nevada which is operated by the Instituto de Astrofísica de Andalucía,
CSIC. Part of the data presented here were taken using ALFOSC, which is owned by the Instituto
de Astrofisica de Andalucia (IAA) and operated at the Nordic Optical Telescope under
agreement between IAA and NBIfAFG of the Astronomical Observatory of Copenhagen. We thank the IRAM director for allocating Discretionary Time to this project. This work
was supported by contracts PNE-001/2000-C-01, AYA-2001-1177, AYA2001-2089 and
AYA-2002-0382. European FEDER funds for these contracts are also
acknowledged.
- Brown, M. E., &
Trujillo, C. A. 2004, AJ, in press
(In the text)
- Davidsson, B. J. R. 1999,
Icarus, 142, 525 [NASA ADS] [CrossRef] (In the text)
- Davidsson, B. J. R. 2001,
Icarus, 149, 375 [NASA ADS] [CrossRef] (In the text)
- Jewitt, D. C., &
Sheppard, S. S. 2002, AJ, 123, 2110 [NASA ADS] [CrossRef] (In the text)
- Lellouch, E., Laureijs,
R., Schmitt, B., et al. 2000a, Icarus, 147, 220 [NASA ADS] [CrossRef] (In the text)
- Lellouch, E., Paubert,
G., Moreno, R., & Schmitt, B. 2000b, Icarus, 147, 580 [NASA ADS] [CrossRef]
- Lellouch, E., Moreno, R.,
Ortiz, J. L., et al. 2002, A&A, 391, 1133 [EDP Sciences] [NASA ADS] [CrossRef] (In the text)
- Lomb, N. R. 1976, Astroph.
Space Sci., 39, 447 [NASA ADS] (In the text)
- Margot, J. L., Trujillo,
C., Brown, M. E., & Bertoldi, F. 2002, Amer. Astron. Soc., DPS
Meet., 34, 17.03
(In the text)
- Press, W. H., Teukolsky,
S. A., Vetterling, W. T., & Flannery B. P. 1992, in Numerical
Recipes in Fortran: the art of scientific computing, 2nd edition
(London: Cambridge Univ. Press), 569
(In the text)
- Russell, H. 1906, ApJ,
24, 1 [NASA ADS] [CrossRef] (In the text)
- Sheppard, S., &
Jewitt, D. C. 2002, AJ, 124, 1757 [NASA ADS] [CrossRef]
- Spencer, J. R., Lebofsky,
A. L., & Sykes, M. V. 1989, Icarus, 78, 337 [NASA ADS] [CrossRef] (In the text)
Copyright ESO 2004
![\begin{figure}
\par\includegraphics[angle=90,width=8.1cm,clip]{0507fig1.ps}
\end{figure}](/articles/aa/full/2004/22/aa0507/img19.gif)
![\begin{figure}
\par\includegraphics[width=8.3cm,height=8.6cm,clip,angle=90]{0507...
...degraphics[width=8.3cm,height=8.6cm,clip,angle=90]{0507fig3.ps}
\par\end{figure}](/articles/aa/full/2004/22/aa0507/img20.gif)
![\begin{figure}
\par\includegraphics[width=8.3cm,height=8.8cm,clip,angle=90,]{0507fig4.ps}
\end{figure}](/articles/aa/full/2004/22/aa0507/img25.gif)