A&A 419, 877-886 (2004)
DOI: 10.1051/0004-6361:20041019
A new type of photoionized code required
for the new era of X-ray spectroscopy
S. Collin1 - A.-M. Dumont1 - O.
Godet2
1 - LUTH, Observatoire de Paris, Section de
Meudon, 92195 Meudon Cedex, France
2 -
CESR, 9 Av. du Colonel Roche, 31028 Toulouse
Cedex 4, France
Received 12 January 2004 / Accepted 23 February 2004
Abstract
With the advent of the present and future spatial X-ray
missions, it becomes crucial to model correctly the line spectrum
of X-ray emitting media such as the photoionized plasma observed
in the central regions of Active Galactic Nuclei (AGN), or in X-ray
binaries.
We have built a photoionization code, Titan,
solving the
transfer of a thousand lines and of the continuum with the "Accelerated Lambda
Iteration'' method, which is one of the most efficient and at the same
time the most reliable for line transfer. In all other
photoionization codes
the line intensities are computed with the
so-called "escape probability formalism'', used in its simplest
approximation. In a previous paper
(Dumont et al. 2003), it was shown that this approximation
leads to a wrong estimation of the emitted
X-ray line intensities, especially in the soft X-ray range. The errors
can exceed one order of
magnitude in the case of thick media (Thomson thickness of the order
of unity). In the present paper, we show that
it also happens, but for different reasons, in the case of
moderately thin media (Thomson thickness of 0.001 to 0.1),
characteristic of the Warm Absorber in Seyfert 1 or of the X-ray
emitting medium in Seyfert 2.
Typically, the errors on the line fluxes
and line ratios
are of the order of 30 for a column density of 1020 cm-2, and a factor five for a column density of 1023 cm-2, in conditions giving rise to the spectra observed in
these objects.
We explain why this problem is less acute in
cooler media, like the Broad Line Region of AGN.
We show some examples of X-ray spectra
appropriate for Seyfert 2 and for the Warm Absorber of Seyfert 1. We conclude
that though it is quite important to introduce numerous accurate X-ray data in
photoionization codes, it should be accompanied by
more elaborate methods than escape
probability approximations to solve the line transfer.
for a column density of 1020 cm-2, and a factor five for a column density of 1023 cm-2, in conditions giving rise to the spectra observed in
these objects.
We explain why this problem is less acute in
cooler media, like the Broad Line Region of AGN.
We show some examples of X-ray spectra
appropriate for Seyfert 2 and for the Warm Absorber of Seyfert 1. We conclude
that though it is quite important to introduce numerous accurate X-ray data in
photoionization codes, it should be accompanied by
more elaborate methods than escape
probability approximations to solve the line transfer.
Key words: line: formation - radiative transfer - galaxies: seyfert - X-rays: general
Since more than three decades,
photoionization codes have been developed to compute the structure and
the spectrum of photoionized media, such as HII regions, planetary
nebulae, supernova remnants, envelopes of novae, Narrow Line Regions of Active
Galactic Nuclei (AGN), etc. At the end of the seventies, these codes
have been extended to denser and thicker media, like the Broad Emission Line
Region (BLR) in quasars and AGN or the emission regions of X-ray
binaries and cataclysmic variables. For this purpose, the formalism
of "escape probability'' has been introduced to take into account
self-absorption in lines while avoiding to solve the
line transfer (Netzer 1975), and a new type of
photoionization code has begun to be built.
These codes - Cloudy (Ferland et al. 1988),
XSTAR (Kallman & Krolik 1995), ION (Netzer 1993), for instance - have now reached
a high
degree of sophistication, including very accurate atomic data, a large
number of ions and transitions, and all the necessary processes allowing to use them
in various physical conditions.
With the advent of the X-ray missions Chandra and XMM Newton, splendid spectra
of various
types of objects have been obtained in the soft X-ray range, showing
tens of emission lines which can be used as diagnostics of the
physical state of the emitting region.
The best examples are Seyfert 2 galaxies, which display a rich
X-ray line
spectrum,
most probably
produced by the external part of the "Warm Absorber'' of Seyfert 1,
photoionized by the intense central continuum and seen in
emission because the central continuum is hidden from
our view (Antonucci & Miller 1985).
Typical column densities of this medium are 1021-23 cm-2
(Sako et al. 2000; Kinkhabwala et al. 2002; Ogle et al. 2003).
Most naturally, the photoionized codes developed for the BLR have been
used to model the X-ray emitting regions of different
objects, like the atmosphere of cataclysmic variables, X-ray
binaries, etc. These codes are also used to model the absorption lines
observed in the UV and X-ray range in quasars and AGN.
Numerous new X-ray atomic data have been
introduced in the codes, in order to obtain the best possible accuracy on
the X-ray spectrum. But the "escape probability approximation''
still lies at the center of the computation of the line intensities.
This formalism, developed in the sixties and in the
seventies, can be very useful to perform rapid approximate
computations, but it does not lead to a correct estimation of the source
function, especially in the case of strongly interlocked transitions,
including continuum ones. Moreover it uses as a
local quantity a global one, computed by an integration over
the whole medium; this is a dramatic extrapolation for very inhomogeneous
media like
photoionized plasma. These aspects have
been completely overlooked during the last twenty years, but they become now
crucial in the context of X-ray emitting media.
In a previous paper, Dumont et al. (2003, referred as D03) have
shown that
escape probability approximations, at least as they are used in the
present codes, are
unable to compute correct line intensities, within factors of ten,
when the Thomson thickness of the medium is of the order of a few units,
typical for the irradiated atmospheres of accretion discs in AGN
and X-ray binaries.
In the
present paper, we extend this study to less optically thick media, and
we show that the intensities of emission lines are also not accurately computed for
parameters typical of the Warm Absorber of Seyfert 1 galaxies
and of the region giving rise to the
X-ray spectrum in Seyfert 2 galaxies![[*]](/icons/foot_motif.gif) .
.
In the next section, we recall very briefly the essence of the
problem, and we give a few examples in Sect. 3.
The escape probability method consists in decoupling
the statistical equations of the levels giving rise to a line photon,
from the transfer
equation. This is performed by using in both equations a frequency integrated line
profile which is
identified with
the probability of the photon to
escape in a single flight from the medium. The problem has been
amply treated since the sixties
(cf. for instance "Radiation transport in spectral lines'', by Athay
1972; and several reviews
in "Methods of Radiative Transfer'', Kalkoven 1984; "Numerical
Radiative Transfer'', Kalkoven 1987; Hubeny 2001...). There are different ways to
use these escape probabilities, some being actually as sophisticated and
time consuming as real transfer.
In photoionization codes, the emphasis is put on the atomic physics,
to account for as many spectral features as possible,
and to get a correct thermal and ionization equilibrium. The escape
probability is treated in a "first order approximation'', which amounts to
replace in the population equations the net radiative rate of excitation
between two levels (called the Net Radiative Bracket, or NRB)
by
 ,
where
,
where
 |
(1) |
is identified with the escape probability (
 ,
,
 and
and
 are the
Einstein excitation and deexcitation
coefficients between the upper (u) and lower (l) levels of the
transition, and
are the
Einstein excitation and deexcitation
coefficients between the upper (u) and lower (l) levels of the
transition, and  and
and  are the number densities
of the upper and lower levels).
The escape
probability intervenes also in
the ionization and
thermal equilibria, through the reabsorption of line photons,
and in the computation of
the line fluxes emerging from both sides.
are the number densities
of the upper and lower levels).
The escape
probability intervenes also in
the ionization and
thermal equilibria, through the reabsorption of line photons,
and in the computation of
the line fluxes emerging from both sides.
The escape probability is a global quantity, expressed as a
function of the
optical thickness at the line center,  ,
between the
emission point and the surface, but it depends through the damping
constant (cf. the Appendix) also on physical parameters
which vary in the medium, such as the temperature and the density. The local
conditions are thus assumed to be valid all along the photon path.
The escape probability is
computed by an integration over the whole medium,
considered as being homogeneous, which is far from being the case in
photoionized plasma except when they are very thin. On the other hand,
this global quantity is
used in the determination of local rates, such as
ionizations by line photons.
,
between the
emission point and the surface, but it depends through the damping
constant (cf. the Appendix) also on physical parameters
which vary in the medium, such as the temperature and the density. The local
conditions are thus assumed to be valid all along the photon path.
The escape probability is
computed by an integration over the whole medium,
considered as being homogeneous, which is far from being the case in
photoionized plasma except when they are very thin. On the other hand,
this global quantity is
used in the determination of local rates, such as
ionizations by line photons.
The problem is complicated when
destruction processes occur before the escape of the photon
(on the spot or along the photon path). This is the
case if the medium is optically thick in the continuum
underlying the
line photon. Various approximate formulae are used to take continuum
absorption
into account in the escape probabilities.
Note that in hot media,
Comptonization acts as an absorption-diffusion process which
should also be taken into account in the line transfer.
As shown in D03, no escape approximation
can give accurate results when the Thomson thickness is of the order
of unity or larger. Indeed local reabsorption of line photons by continuum
processes implies a delicate balance between excitations of X-ray
transitions by the intense underlying
diffuse X-ray continuum and the net rate
of excitations by the diffuse line flux. It is not taken properly into account
in escape
probability approximations and it creates large differences in the emerging
line
spectrum.
When the medium is only moderately thick (Thomson thickness from 0.001
to 0.1), these processes are less
important, but still the escape probabilities lead to inexact results,
then
for other reasons. For optically thick
transitions,
escape probabilities
describe correctly the behavior of the source function deeply in
the medium but not at the surface. These lines are formed
close to the surface
where their upper level populations are not computed correctly. This
can be dramatic if the transition is strongly interlocked with other levels
in a "multi-level'' description. This is the case for the high
resonance lines and the Balmer lines in hydrogen-like ions,
or for the
resonance lines and the intercombination and forbidden lines for
helium-like ions. Avrett &
Loeser (1987) have shown that,
unless methods coupling transfer
and escape probabilities are used, large errors follow on the
relative intensities of the lines even for a three-level atom.
Another problem rises for moderately thick or thin media. Whereas in a thick medium,
the incident continuum is absorbed completely in resonance
transitions and it does not play any
role in line excitation (at least for the most intense lines),
in the case of thin or moderately thick media as those considered in the
present paper, the incident continuum can contribute appreciably
to the line excitation. Indeed it is
absorbed only at the line center, and a
fraction is left in the
wings. Its contribution should be
added to the population equations, as
 includes only the diffuse radiation, which in this case is weak and does not contribute
much
to the excitations. The
attenuation factor of the incident continuum is of the order of
twice the escape
probability towards the illuminated side (as it is defined in the
Appendix, cf. Elitzur 1982), but it is again an
approximation. When the medium is
extremely thin, this factor is equal to unity, and the computation is
exact.
includes only the diffuse radiation, which in this case is weak and does not contribute
much
to the excitations. The
attenuation factor of the incident continuum is of the order of
twice the escape
probability towards the illuminated side (as it is defined in the
Appendix, cf. Elitzur 1982), but it is again an
approximation. When the medium is
extremely thin, this factor is equal to unity, and the computation is
exact.
Moreover, there is also the problem
of frequency redistribution inside the lines.
Resonance lines are broadened mainly by
radiation damping, so the emission process is coherent in the frame of
the atom. It is well-known since a long time that in this case the assumption of
complete redistribution in a
Voigt profile leads to strongly overestimate the line intensity (cf.
for instance Milkey
& Mihalas 1973; Vernazza et al. 1981, who studied L in
the solar spectrum), and a way to account better for partial redistribution (PRD)
is to assume complete redistribution in the Doppler core. XSTAR
assumes
complete redistribution in a Doppler core for all lines, whereas in Cloudy,
strong resonance lines are treated
with partial redistribution within a Voigt profile, which amounts using
for the escape probability an expression computed by Hummer & Kunasz
(1980)
in
the solar spectrum), and a way to account better for partial redistribution (PRD)
is to assume complete redistribution in the Doppler core. XSTAR
assumes
complete redistribution in a Doppler core for all lines, whereas in Cloudy,
strong resonance lines are treated
with partial redistribution within a Voigt profile, which amounts using
for the escape probability an expression computed by Hummer & Kunasz
(1980)
![$P_{\rm esc}(\tau_0) = [1+ b(\tau_0)\tau_0]^{-1}$](/articles/aa/full/2004/21/aa0058-04/img17.gif) ,
where b
of the order of a few units. Note that this function is given only for a
ratio of the continuum to line opacity smaller than 10-6, and it
should be extrapolated for larger values, a
common case in the present computations. Both
treatments are close
to complete redistribution in the Doppler core, and
similar to the one used here for the resonance
lines in our escape treatment (cf. the Appendix).
,
where b
of the order of a few units. Note that this function is given only for a
ratio of the continuum to line opacity smaller than 10-6, and it
should be extrapolated for larger values, a
common case in the present computations. Both
treatments are close
to complete redistribution in the Doppler core, and
similar to the one used here for the resonance
lines in our escape treatment (cf. the Appendix).
In summary, the escape probability method is strongly approximated, both
in very thick and in moderately thick media, for different
reasons.
One may therefore ask why it is possible to use this
method to compute the optical-UV spectrum of the BLR, and
not the
X-ray spectrum of a photoionized medium.
Consider first an X-ray emitting medium photoionized by an intense X-ray continuum,
i.e. with a large "ionization parameter'', defined as the
radiation flux to the gas density ratio. The heavy elements are highly
ionized.
If the medium is only moderately thick,
the continuum underlying the X-ray lines can nevertheless be optically thick, owing
to the presence of several ion species in important proportions at
a given point in the medium (we will illustrate this discussion
later in showing which ions are
important for absorbing the continuum at the position of the OVIII L
line).
Consider now a less ionized medium like the BLR.
The ionization parameter is smaller, the
medium is colder, and only infrared, optical and UV
lines are
emitted. The column density of the ionized region emitting these lines
depends on the ionization parameter, but it never reaches
a Thomson thickness of unity. The continuum underlying the lines is optically
thin. For instance ultraviolet lines can only be reabsorbed in the
Balmer and Paschen continuum, which are optically thin because the
excited levels of HI are not populated at low temperature.
Once emitted, these line photons are therefore not reabsorbed by continuum
processes (except possibly by internal
dust). The situation is thus simpler than for an X-ray emitting
medium. On the other hand,
is larger in the optical range than in the
X-ray range by a factor
 ,
so resonance lines
are very thick in a typical BLR cloud, and escape probabilities can
be used. Finally the influence of the
attenuated
incident continuum on line excitation is not important, except
possibly for
subordinate lines whose lower level is not much populated. It was
indeed
stressed in Collin-Souffrin & Dumont (1986) that the use of escape
probability can lead to wrong results for the computed Balmer intensities.
,
so resonance lines
are very thick in a typical BLR cloud, and escape probabilities can
be used. Finally the influence of the
attenuated
incident continuum on line excitation is not important, except
possibly for
subordinate lines whose lower level is not much populated. It was
indeed
stressed in Collin-Souffrin & Dumont (1986) that the use of escape
probability can lead to wrong results for the computed Balmer intensities.
To summarize, the use of escape probability for the BLR is not too bad, both
because the emission lines are either optically very thick (resonance lines)
or very thin (forbidden lines), and because the continuum underlying
these lines
is optically thin.
In order to study X-ray emitting media, we have developed since
several years a photoionization code, Titan, which
does not make use of escape probability approximations,
but solves the transfer both in the lines
and in the continuum (cf. Dumont et al.
2000; Dumont & Collin 2001). In its last version, Titan
uses a method called "Accelerated Lambda Iteration''
(ALI), which ensures that all lines
are computed with an accuracy better than 1
(cf. D03 for a
summary of the ALI method).
Table 1:
Characteristics of the models displayed in the figures.
Without giving a full description of Titan, it is worthwhile mentioning
that it includes the 10 most abundant elements (H, He,
C, N, O, Ne, Mg, Si, S, Fe) and their ion species, i.e. 102
ions. H-like, He-like, Li-like ions, O IV and O V, include a multi-level
description up to a quantum number
 :
:
 for H-like,
and Li-like ions, and
for H-like,
and Li-like ions, and
 He-like ions and for O IV and O V.
The other ions
are treated as two-level atoms plus a continuum (they include several
resonance lines, but without interlocking).
For Li-like ions, we assume
mixing of the
different terms of level 3,
4, and 5. In the case of He-like ions, the atom is made up of all terms
for n=2 and n=3,
and 2 super-levels gather the singlet and triplet levels for n=4.
Thus the atom is
represented by 15 levels plus a continuum.
This better representation is chosen in order to get correct "triplet
line" intensities, as they can be separated and are often used as diagnostics for
the physical conditions of
X-ray emitting plasma.
Recombinations onto levels
He-like ions and for O IV and O V.
The other ions
are treated as two-level atoms plus a continuum (they include several
resonance lines, but without interlocking).
For Li-like ions, we assume
mixing of the
different terms of level 3,
4, and 5. In the case of He-like ions, the atom is made up of all terms
for n=2 and n=3,
and 2 super-levels gather the singlet and triplet levels for n=4.
Thus the atom is
represented by 15 levels plus a continuum.
This better representation is chosen in order to get correct "triplet
line" intensities, as they can be separated and are often used as diagnostics for
the physical conditions of
X-ray emitting plasma.
Recombinations onto levels
 are taken into
account in a simplified way (they are either distributed on all the
levels, or only on the highest one, whose population is thus
overestimated). We are thus aware that from the point of view
of atomic data Titan
is not comparable to codes which take
into account a larger number of
levels for each ion species, and several thousands of transitions.
are taken into
account in a simplified way (they are either distributed on all the
levels, or only on the highest one, whose population is thus
overestimated). We are thus aware that from the point of view
of atomic data Titan
is not comparable to codes which take
into account a larger number of
levels for each ion species, and several thousands of transitions.
Titan solves the ionization equilibrium of all ion species of
each element, the thermal equilibrium, the statistical equilibrium of
all levels of each ion - all the physical processes from each
level being taken into account - coupled with the transfer of the continuum
and of
about 900
lines. Comptonization of the continuum above 20 keV is
taken into account through the coupling with a Monte Carlo code, and
comptonization
of all lines is computed in an approximate way (cf. D03). Note
that though it always plays a role, it does not change appreciably
the whole line intensity in the
cases considered here. Moreover, it is treated exactly in the same way
with the escape and the transfer treatments.
Finally we should mention that presently Titan is dealing only with
complete frequency redistribution. In the future we shall
implement partial redistribution frequency in Titan. Here
all computations have been performed
assuming complete redistribution within Doppler core for
the first resonance line of He- and H-like species, and
within Voigt profiles for the
other lines. The latter assumption does not have a strong influence
on the results,
since subordinate lines are optically thin or moderately thick, and
the other resonance lines are not intense.
Like in D03, we have compared the spectra obtained when using Titan in its complete
version,
with those obtained with Titan when the line transfer is replaced by the escape
probabilities in the computation of the statistical and ionization equilibrium,
of the energy
balance, and of the emitted line fluxes. The rest of the computations
are strictly identical. This ensures that we compare
exactly the same models.
Indeed it would not be possible to
compare directly the results obtained using another photoionization code with those
of Titan, owing to the difference in the transfer of the continuum
and in the atomic data.
In the following computations, we have chosen one of the escape
probability approximations used in D03, Escape 14 bis, which we
think to be the best for reasons explained in D03. Radiative excitation
by the attenuated incident radiation was added, as
it is important for optically thin media. The equations corresponding
to this approximation are given in the Appendix.
Our models are plane-parallel slabs of constant hydrogen density
 cm-3, and total hydrogen
column density from 1015 to 1024 cm-2, irradiated on one side
by an incident continuum with a spectral distribution
cm-3, and total hydrogen
column density from 1015 to 1024 cm-2, irradiated on one side
by an incident continuum with a spectral distribution
 extending from 0.1 eV to 100 keV. We have
chosen this density, as it is probably intermediate between that of the Warm
Absorber in Seyfert 1 and that of the more dilute X-ray emitting medium in Seyfert 2.
Moreover, it was shown in Coupé et al. (2003) that the density has
not a strong impact on the line spectrum between 107 and 1012 cm-3. It is due to the fact that the most intense lines - resonance
lines of H- and He-like ions - are formed by
recombination.
We call ionization
parameter at the surface of the irradiated slab
extending from 0.1 eV to 100 keV. We have
chosen this density, as it is probably intermediate between that of the Warm
Absorber in Seyfert 1 and that of the more dilute X-ray emitting medium in Seyfert 2.
Moreover, it was shown in Coupé et al. (2003) that the density has
not a strong impact on the line spectrum between 107 and 1012 cm-3. It is due to the fact that the most intense lines - resonance
lines of H- and He-like ions - are formed by
recombination.
We call ionization
parameter at the surface of the irradiated slab
 ,
where F is the integrated incident flux.
We choose the value of the ionization parameter so as to get spectra dominated in the
soft X-ray range by H-like
and He-like lines of C, N, and O, since those are the lines observed
in Seyfert 1 and 2 spectra.
We were obliged to increase the value of the ionization
parameter for the largest column densities, otherwise only a small
fraction of the slab would be hot and X-ray emitting, and the
spectra would be
quite similar to low column density cases. When the column
density and the ionization parameter are large, several ion species
are present in successive layers, and the spectrum contains also H-
and He-like lines of more heavier species (cf.
Coupé et al. 2003), so basically the most intense lines
are shifted towards higher frequencies. We assumed cosmic abundances
with respect to hydrogen (Allen 1973): He: 0.085; C:
,
where F is the integrated incident flux.
We choose the value of the ionization parameter so as to get spectra dominated in the
soft X-ray range by H-like
and He-like lines of C, N, and O, since those are the lines observed
in Seyfert 1 and 2 spectra.
We were obliged to increase the value of the ionization
parameter for the largest column densities, otherwise only a small
fraction of the slab would be hot and X-ray emitting, and the
spectra would be
quite similar to low column density cases. When the column
density and the ionization parameter are large, several ion species
are present in successive layers, and the spectrum contains also H-
and He-like lines of more heavier species (cf.
Coupé et al. 2003), so basically the most intense lines
are shifted towards higher frequencies. We assumed cosmic abundances
with respect to hydrogen (Allen 1973): He: 0.085; C:
 ;
N:
;
N:
 ;
O:
;
O:
 ;
Ne:
;
Ne:
 ;
Mg:
;
Mg:
 ;
Si:
;
Si:
 ;
S:
;
S:
 ;
Fe:
;
Fe:
 .
.
In the Warm Absorber or in the emitting medium of Seyfert 2, a velocity gradient may be present,
which can decrease
the optical thickness of the lines.
In the line transfer, it plays the role of
a micro-turbulent velocity which should be added to the thermal velocity.
Note that if the emitting medium is made of high velocity clouds
like the BLR, the velocity gradient acts only as a
macroscopic velocity which does not influence the transfer (this
problem is discussed in more details in Godet et al. 2004).
We have thus run a model with a turbulent velocity of
300 km s-1, close to the measured width of the lines in NGC 1068 (Kinkhabwala et al.
2002).
Table 1 summarizes the
characteristics of a few models - successively the column density CD, the ionization
parameter  ,
the turbulent velocity
,
the turbulent velocity
 ,
the total optical
thickness
of the continuum at the position of the O VIII L
line at
653 eV, and
the total optical thickness at the center of the line, both for
ALI and the
escape computation.
,
the total optical
thickness
of the continuum at the position of the O VIII L
line at
653 eV, and
the total optical thickness at the center of the line, both for
ALI and the
escape computation.
An immediate result is that the opacity of the
continuum increases with the column density up to a limit
of  2. This is because the heavy elements become
completely ionized for large values of the ionization
parameter, which are required to create a thick hot layer.
The same
phenomenon exists for :
it cannot exceed
a value corresponding to the maximum column density of the
ion species, reached for an optimum value of the ionization
parameter (cf. Coupé et al. 2003 for more detailed
explanations). Model 7 with a column density of 1022 cm-2 and
2. This is because the heavy elements become
completely ionized for large values of the ionization
parameter, which are required to create a thick hot layer.
The same
phenomenon exists for :
it cannot exceed
a value corresponding to the maximum column density of the
ion species, reached for an optimum value of the ionization
parameter (cf. Coupé et al. 2003 for more detailed
explanations). Model 7 with a column density of 1022 cm-2 and  has a continuum opacity 20 times smaller than for
 ,
but it has the same value of (O VIII L),
because O VIII is still the dominant ion,
while C and N are already completely ionized. On the
contrary, Model 8 with
the same column density but
,
but it has the same value of (O VIII L),
because O VIII is still the dominant ion,
while C and N are already completely ionized. On the
contrary, Model 8 with
the same column density but
 has a smaller value of (O VIII L),
because O VIII is no more the dominant ion, it is replaced by O IX.
One sees the strong decrease of the line
optical thickness in the presence of a large micro-turbulent velocity,
while the continuum opacity is almost unchanged. Note also that
the continuum opacity and (O VIII L)
vary in
opposite directions: the first is smaller for the transfer
treatment, and the second for the escape approximation. It is
linked to the slight variation of the ionization state in the two
treatments.
has a smaller value of (O VIII L),
because O VIII is no more the dominant ion, it is replaced by O IX.
One sees the strong decrease of the line
optical thickness in the presence of a large micro-turbulent velocity,
while the continuum opacity is almost unchanged. Note also that
the continuum opacity and (O VIII L)
vary in
opposite directions: the first is smaller for the transfer
treatment, and the second for the escape approximation. It is
linked to the slight variation of the ionization state in the two
treatments.
We try first to mimic the conditions of the X-ray emitting regions of
Seyfert 2 galaxies. According to the Unified Scheme of
Seyfert galaxies, we are observing in the
X-ray range the "reflection'' of the central source produced by a
photoionized
"mirror'', and we do not see the primary photoionizing continuum.
It is actually not a purely reflecting medium, as it
reprocesses the radiation (however we shall call this emission the "reflected"
spectrum).
This
region has probably a conical geometry, and we should observe almost
perpendicularly to the cone axis.
Of course our representation of such a situation can be only very
crude, as Titan is dealing with a plane-parallel
and not a spherical or conical geometry.
Since lines having the largest equivalent widths (EWs) are best observed,
and since very often EWs are given in the literature,
we display the results as EWs with respect to the reflected continuum
instead of line fluxes.
Note that the
spectrum "reflected'' by the illuminated side is
similar to that emitted by the back side only in the case of very thin
slabs, but it is different for moderately thick slabs.
Figure 1 displays the EWs of the lines in the
reflected spectrum,
for the chosen models and for the transfer and
the escape treatments. A few intense lines are identified: the spectra
are dominated by L
lines of H-like and He-like
lines.
For larger values of the ionization parameter,
heavier H- and He-like ions are present.
![\begin{figure}
\par\includegraphics[width=18cm,clip]{0058fig1.eps}
\end{figure}](/articles/aa/full/2004/21/aa0058-04/Timg44.gif) |
Figure 1:
EWs (in eV) of the lines in the
reflected spectrum, for the different models,
with the transfer (red circles) and with
the escape treatment (blue crosses). |
| Open with DEXTER |
![\begin{figure}
\par\includegraphics[angle=-90,width=17.4cm,clip]{0058fig2.eps}
\end{figure}](/articles/aa/full/2004/21/aa0058-04/Timg45.gif) |
Figure 2:
Ratios
 as functions of the position in
the slab, for several transitions of O VIII and O VII, for Model 5 (column density 1022 cm-2,
,
no turbulent velocity): thick red lines: transfer, thin blue lines:
escape.
as functions of the position in
the slab, for several transitions of O VIII and O VII, for Model 5 (column density 1022 cm-2,
,
no turbulent velocity): thick red lines: transfer, thin blue lines:
escape. |
| Open with DEXTER |
![\begin{figure}
\par\includegraphics[angle=-90,width=17.4cm,clip]{0058fig3.eps}
\end{figure}](/articles/aa/full/2004/21/aa0058-04/Timg46.gif) |
Figure 3:
NRB (for the transfer) and escape probability
 (for the escape
treatment), as functions of the position in
the slab, for
O VIII L
and O VII w, for Model 5 (column density 1022 cm-2,
,
no turbulent velocity). The figure shows also the escape probabilities
towards the illuminated and towards the back side, respt.
(ref) and
(out) (see the
text for explanations). Note that
(ref) and
(out) are much smaller than their values at the
surface, 0.5.
(for the escape
treatment), as functions of the position in
the slab, for
O VIII L
and O VII w, for Model 5 (column density 1022 cm-2,
,
no turbulent velocity). The figure shows also the escape probabilities
towards the illuminated and towards the back side, respt.
(ref) and
(out) (see the
text for explanations). Note that
(ref) and
(out) are much smaller than their values at the
surface, 0.5. |
| Open with DEXTER |
The
transfer and the escape treatments give different results
already at very low column
densities: for Model 3 (1020 cm-2), the error is 30
for a few lines. It is clearly not due to the influence of
the continuum opacity, which is negligible, but to the
interlocking between
levels (and perhaps also partly to the approximate treatment of the incident
continuum, as
is not negligible).
A noticeable result is that, except for very
low values of the column density, the escape treatment leads to a
systematic
overestimation of the resonance line intensities, as already noticed in D03.
It is particularly obvious for L
of H-like ions, and in a lesser amount for the w-term of
He-like ions. The overestimation is smaller in the case of forbidden
or subordinate lines.
Figures 2 and 3
can help to understand these discrepancies. Figure 2 displays the
ratios of the upper to
lower populations
 ,
as functions of the position in
the slab, for several transitions of
O VIII and O VII, for Model 5 (column density 1022 cm-2,
,
no turbulent velocity). This ratio is proportional to the
source function of the lines. The figure shows that for
the two resonance lines, O VIII L
and O VII w, it differs strongly
in the whole slab with the two treatments,
contrary to those of the other transitions.
Figure 3 displays the NRB (for the transfer) and the escape
probability
(for the escape
treatment), as functions of the position in
the slab, for
these two lines.
is the sum of
the escape probabilities
towards the illuminated and towards the back side
(cf. the Appendix), which are also shown on the
figure. In principle it should be equal to the NRB, but we see that
they have almost nothing in common.
The reflected flux is mainly provided by the region located at
,
as functions of the position in
the slab, for several transitions of
O VIII and O VII, for Model 5 (column density 1022 cm-2,
,
no turbulent velocity). This ratio is proportional to the
source function of the lines. The figure shows that for
the two resonance lines, O VIII L
and O VII w, it differs strongly
in the whole slab with the two treatments,
contrary to those of the other transitions.
Figure 3 displays the NRB (for the transfer) and the escape
probability
(for the escape
treatment), as functions of the position in
the slab, for
these two lines.
is the sum of
the escape probabilities
towards the illuminated and towards the back side
(cf. the Appendix), which are also shown on the
figure. In principle it should be equal to the NRB, but we see that
they have almost nothing in common.
The reflected flux is mainly provided by the region located at
 cm from the surface, where the source
functions are overestimated
by more than one order of magnitude with the escape treatment.
cm from the surface, where the source
functions are overestimated
by more than one order of magnitude with the escape treatment.
To also help understanding the difference with a "cold" medium
like the BLR, we show for the same model the fractional
abundances of several ions able to efficiently absorb the O VIII L
photons on the top panel of Fig. 4.
We see that they are dominant through the whole slab.
The bottom panel displays the emissivity of the O VIII L
line in the escape
computation, as a function of the depth, and the optical
thickness in the continuum at the position of the
line, starting from the illuminated side. The emissivity is important
up to
 cm, where the optical thickness reaches a
value of the order of 0.5. Thus the reflected line is attenuated by
about a factor two. However it is not sufficient to explain the
discrepancy between the escape and the transfer treatments, and one
should also invoke the other reasons mentioned previously.
cm, where the optical thickness reaches a
value of the order of 0.5. Thus the reflected line is attenuated by
about a factor two. However it is not sufficient to explain the
discrepancy between the escape and the transfer treatments, and one
should also invoke the other reasons mentioned previously.
![\begin{figure}
\par\includegraphics[width=7.4cm,clip]{0058fig4.eps}
\end{figure}](/articles/aa/full/2004/21/aa0058-04/Timg50.gif) |
Figure 4:
Fractional abundances of several ions able to absorb the
O VIII L
photons ( top panel), and
emissivity of the O VIII L
line and optical thickness in the
continuum at the position of the line ( bottom panel),
as functions of the position in
the slab, for Model 5 (column density 1022 cm-2,
,
no turbulent velocity). |
| Open with DEXTER |
![\begin{figure}
\par\includegraphics[width=8.8cm,clip]{0058fig5.eps}
\end{figure}](/articles/aa/full/2004/21/aa0058-04/Timg51.gif) |
Figure 5:
Reflected spectrum for two models: solid red line: transfer;
dashed blue line: escape probability. The ordinate is proportional to
 in photon number
(actually it is equal to
in photon number
(actually it is equal to
 ). The spectra are displayed with a spectral resolution of R=30. ). The spectra are displayed with a spectral resolution of R=30. |
| Open with DEXTER |
![\begin{figure}
\par\includegraphics[width=7.6cm,clip]{0058fig6.eps}
\end{figure}](/articles/aa/full/2004/21/aa0058-04/Timg52.gif) |
Figure 6:
G ratios (see the text) in the
reflected spectrum versus the column density,
for the transfer (red circles) and
the escape treatment (blue crosses).
When another value is not indicated, . |
| Open with DEXTER |
The errors on the
escape results increase with the column density and reach a factor
five for Model 9 (1023 cm-2, ), where both the
line and the continuum opacities are large, so the influence of the
diffuse continuum becomes important. They
decrease for Model
10 (1024 cm-2,  ),
because the opacities
of the continuum and the lines are smaller. Note also that the errors
are quite small with Model
8 (1022 cm-2, ). It
is easily understood: this model is highly ionized, and the
column density is not large enough to allow the presence of low
ionized species. As a result, the spectrum is mostly made of He- and
H-like lines of heavy elements and of O VIII, and it does not display the
O VII lines characteristic of a Seyfert 2 spectrum, as can be seen in Fig. 1.
),
because the opacities
of the continuum and the lines are smaller. Note also that the errors
are quite small with Model
8 (1022 cm-2, ). It
is easily understood: this model is highly ionized, and the
column density is not large enough to allow the presence of low
ionized species. As a result, the spectrum is mostly made of He- and
H-like lines of heavy elements and of O VIII, and it does not display the
O VII lines characteristic of a Seyfert 2 spectrum, as can be seen in Fig. 1.
The comparison of Models 5 and 6
(1022 cm-2, ,
respectively without and with
a micro-turbulent velocity of 300 km s-1)
shows that
the escape probability approximation gives slightly better results in the
presence of a micro-turbulent velocity, as expected since the lines
are less optically thick. Still the
errors on line intensities and line ratios are typically of the order
of a factor two. Moreover,
the results are shifted towards
smaller column densities for a given EW (Godet et al. 2004):
here, for a turbulent velocity of 300 km s-1, the EWs of the resonance
lines are similar to those without turbulent velocity, but for a column density
about one order of magnitude smaller. The comparison
of Model 5 with Model
7 (1022 cm-2, )
shows also that
the escape probability approximation gives a better result in the
latter case, because the continuum opacity is small.
Also, due to the higher ionization parameter, the spectrum displays more intense
lines of He- and H-like heavy
elements.
In summary, the errors in the line intensities and line ratios
due to the use of the escape approximation are
not easy to predict, as they depend on different processes
in a complex and subtle way. They are important even for low column
densities.
To illustrate more clearly the effects of the use of escape
probabilities on the observed spectrum, Fig. 5 displays the reflected spectrum for two models,
in the same form as they
are generally published in the literature. Though the column densities
are relatively small (1022 and 1023 cm-2), large
discrepancies appear between the escape and the transfer treatments,
which can lead to misinterpretations of the observed spectra when
modeled by the escape treatment.
The ratio
G=(z+x+y)/w of He-like ions is used as a diagnostic
for hot plasma.
The variation of this ratio as a function of several parameters is
studied in Coupé et al. (2003)
and Godet et al. (2004). Here we focus only
on the differences between the escape and the transfer treatment.
Figure 6 displays this ratio versus the column
density for the models studied here.
Again we see that the differences are the largest (a factor three)
for Models 5 and 8. It is
however interesting to notice that in the
presence of a turbulent velocity, G is almost the same for both
treatments.
In Seyfert 1, one observes directly the central X-ray continuum,
possibly after
absorption by the Warm Absorber. About 50
of Seyfert galaxies have absorption lines, and it is most
probable that the "Warm Absorber'' is present
in all active nuclei, but it does not cross always the line of sight
of the X-ray continuum. Emission lines are produced by
the Warm
Absorber, but they are diluted by the presence of the primary continuum.
The observed
spectrum is thus the sum of reflection from the illuminated side and
emission from
the back side of the clouds, plus the primary continuum, absorbed
if the line of sight crosses the Warm Absorber.
If it is distributed spherically or axi-symmetrically,
the proportions coming from each side are identical.
Assuming a
coverage factor f, the observed EWs are thus:
 |
(2) |
where
 ,
,
 ,
,
 ,
are
the continuum flux, respectively reflected, emitted outward, and the
primary continuum (absorbed or not), at the line frequency.
If the line of sight crosses the Warm Absorber, there are also absorption lines
imprinted on the primary continuum. We will assume that they are not
located at
the same frequencies as the emission lines, owing to the existence of
velocity gradients
(for instance in the case of a wind, the emission lines are
redshifted
with respect to the absorption lines).
,
are
the continuum flux, respectively reflected, emitted outward, and the
primary continuum (absorbed or not), at the line frequency.
If the line of sight crosses the Warm Absorber, there are also absorption lines
imprinted on the primary continuum. We will assume that they are not
located at
the same frequencies as the emission lines, owing to the existence of
velocity gradients
(for instance in the case of a wind, the emission lines are
redshifted
with respect to the absorption lines).
As an illustration, Fig. 7 displays the EWs of the
emission lines produced by the Warm Absorber with a covering factor
f=0.5: 1- not crossing the line of sight (top panels),
2- crossing
the line of sight (bottom panels). Comparing these results to those of
Seyfert 2, we see that the emission line spectra are very similar in
both cases.
However when
the primary continuum is not absorbed (top panel), the EWs are always
very small, and only a few lines could be detectable (O VIIz, O VIII L,
C VI L). When the line of sight crosses the Warm
Absorber, the EWs are larger,
and many lines should be detected for a
column density of the order of 1022 cm-2 or larger. So it is a
powerful way to estimate the column density of the Warm Absorber,
independent of the absorption lines. Note also that the line ratios
differ between the case with and
without absorption of the primary continuum,
owing to the variation of the continuum
opacity with the frequency.
Anyway, our purpose in this paper is not to study the emissive regions
of Seyfert nuclei, but to estimate the validity of the computations
performed with the escape approximation. Figure 7 shows
that, like in the case of Seyfert 2, the EWs are overestimated by
large factors (up to 5 for Model 9) by the approximate treatment.
Again also, the overestimation is much larger for resonance lines than
for forbidden or subordinate lines.
![\begin{figure}
\par\includegraphics[angle=-90,width=17.4cm,clip]{0058fig7.eps}
\end{figure}](/articles/aa/full/2004/21/aa0058-04/Timg58.gif) |
Figure 7:
EWs (in eV) of the lines, in the case of a spherical "Warm
Absorber" with a coverage
factor of 0.5, for different models computed
with the transfer (red circles) and with
the escape treatment (blue crosses). The top panels correspond
to the line of sight of the central X-ray
source not crossing the Warm Absorber,
and the bottom panels to the Warm Absorber crossing
the line of sight (cf. the text). |
| Open with DEXTER |
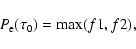
We have shown that the use of the escape probability approximation leads
to large errors in the computed line fluxes and line ratios, in
conditions which are typical of the X-ray emitting regions of Seyfert 2 nuclei, and of the Warm Absorber of Seyfert 1, i.e. for a Thomson
thickness of the order of 0.001 or larger. This completes the previous
paper (D03), where the same study was performed for thicker media,
and where it was shown that the use of the escape approximation leads to
errors by more than one order of magnitude on the line fluxes and line
ratios. We find here that the errors are of the order of 30
for a column density
of 1020 cm-2, and can reach a factor five for a
column density 1023 cm-2. We confirm that they are
almost always in the direction of an overestimation of the most intense line intensities,
especially of the L
line of H-like ions, and of the resonance w-term of He-like ions. We explain why such large errors
occur for X-ray emitting media, and not for cooler media like the BLR.
The comparison between the escape approximation and the transfer
treatment (performed through the Accelerated Lambda Iteration method
with our photoionization code Titan), is made in such a way that
no other possible explanation of the discrepancies than the use of the
escape probability approximation can be invoked. So one is led to conclude that
unless a real transfer of the lines
is introduced in the codes for modelling X-ray spectra, the results
cannot have an accuracy better than that given by the approximation,
even when the treatment of atomic physics is highly sophisticated.
Whatever the discrepancy between the results of the escape
probability and the transfer treatment, an uncertainty remains
concerning the real intensity of the resonance lines. Here they were
computed assuming complete redistribution within Doppler core, which
mimics partial redistribution within a Voigt profile. PRD
cannot be taken into account accurately with the escape probability
formalism, but it can be done with the transfer treatment, provided
the implementation in the code of
another substantial time consuming procedure. We are presently
studying such an improvement.
We compute the escape probability towards the surface
 of
a line as (cf. Collin-Souffrin et al. 1981):
of
a line as (cf. Collin-Souffrin et al. 1981):
 |
(3) |
for all subordinate and high resonance lines, and
 |
(4) |
for the first resonance lines of H- and He-like species, with
 |
|
 |
(5) |
where
is the optical thickness at the line center between
the emission point and the surface (we recall that it is taken along
the photon path, so it
is multiplied by a
factor  to take into
account the fact that the direction of the emitted photon is at
random, and to be able to compare the escape approximation to the transfer
treatment), and a is
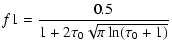
the usual damping constant. f1 corresponds to
the Doppler core, and f2 to the Lorentz wings of the
Voigt profile.
to take into
account the fact that the direction of the emitted photon is at
random, and to be able to compare the escape approximation to the transfer
treatment), and a is
the usual damping constant. f1 corresponds to
the Doppler core, and f2 to the Lorentz wings of the
Voigt profile.
The total escape probability
is the sum of the escape probability
towards the illuminated side,
 ,
and
towards the back side,
,
and
towards the back side,
 ,
where T0 is the total optical
thickness of
the slab
depth at the line center.
,
where T0 is the total optical
thickness of
the slab
depth at the line center.
In the equations for the level populations, the net radiative rate
from an excited level is replaced by
 ,
with
,
with
![\begin{displaymath}\beta_{\rm pop}={\rm min}\left[1, P_{\rm esc}(\tau) \times \l...
...appa_{\rm c}\over \sqrt{\kappa_{\rm l}}}\right)\right)\right],
\end{displaymath}](/articles/aa/full/2004/21/aa0058-04/img67.gif) |
(6) |
where
 and
and
 are respectively the absorption
coefficient in the continuum and in the line, and F is the
operator given by Hummer (1968) to account for destruction by
continuum absorption in one line scattering:
are respectively the absorption
coefficient in the continuum and in the line, and F is the
operator given by Hummer (1968) to account for destruction by
continuum absorption in one line scattering:
 |
(7) |
where  is the absorption line profile,
 ,
and
,
and
 is the Doppler width.
A term
 is added to the net radiative rate to
take into account excitations by the attenuated incident radiation
is added to the net radiative rate to
take into account excitations by the attenuated incident radiation
 ,
according to the definition of the flux,
,
according to the definition of the flux,
 being the incident flux at the frequency
  (the corresponding deexcitation rate is negligible).
The local cooling for each line is:
 |
(8) |
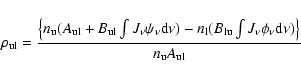
The reflected flux in a line is computed as:
![\begin{displaymath}F_{\rm ref}= \int{n_{\rm u}A_{\rm ul}h\nu \beta_{\rm ref}\
{\rm exp}[-\tau_{\rm e}] {\rm d}z},
\end{displaymath}](/articles/aa/full/2004/21/aa0058-04/img79.gif) |
(9) |
where
 is the effective optical
thickness of the slab in the
continuum at the line frequency,
between the current point and the illuminated surface.
is the effective optical
thickness of the slab in the
continuum at the line frequency,
between the current point and the illuminated surface.
In the outward emitted line flux, one must take into account the
photons absorbed in the incident continuum:
![$\displaystyle F_{\rm out} = \int{\big(n_{\rm u}A_{\rm ul}h\nu \beta_{\rm out}
{...
...rm e}-\tau_{\rm e})]}
-n_{\rm l}B_{\rm lu}J_{\nu}^{\rm inc.att.}\big) {\rm d}z,$](/articles/aa/full/2004/21/aa0058-04/img81.gif) |
|
|
(10) |
where  is the effective total optical thickness of the slab in the
continuum at the line frequency.
is the effective total optical thickness of the slab in the
continuum at the line frequency.
The ionization rate
due to the lines, at the depth z, is equal to:
![$\displaystyle \sqrt{3}\kappa_{\rm c} A_{\rm ul}
\left( \int_0^z{\left(n_{\rm u}...
...}
\beta_{\rm ref}{\rm exp}\left[-T_{\rm e}+\tau_{\rm e}\right]{\rm d}Z}\right).$](/articles/aa/full/2004/21/aa0058-04/img83.gif) |
|
|
(11) |
This expression is used also for the gains by photoionizations due to the
lines.
The escape probability is slightly different in the case of a
highly ionized and/or moderately thick medium, as one must take into
account the shift of line photons by comptonization. Thus
 is replaced by
 ,
and
,
and
 by
by
 ,
and
,
and  is replaced by
 .
.
- Allen, C. W. 1973,
Astrophysical quantities, University of London (The Athlone
Press)
(In the text)
- Antonucci, R.
R. J., & Miller, J. S. 1985, ApJ, 297, 621 [NASA ADS] [CrossRef] (In the text)
- Athay, G. 1972,
Radiation Transport in Spectral Lines (D. Reidel Publishing
Company)
(In the text)
- Avrett, E. H.,
& Loeser, R. 1987, Num. Rad. Trans., 135, ed. Kalkoven,
CUP
-
Collin-Souffrin, S., Delache, P., Frisch, H., & Dumont, S.
1981, A&A, 104, 264 [NASA ADS] (In the text)
-
Collin-Souffrin, S., & Dumont, S. 1986, A&A, 166, 13 [NASA ADS] (In the text)
- Coupé, S.,
Godet, O., Dumont, A.-M., & Collin, S. 2003, A&A, in
press
(In the text)
- Dumont, A.-M.,
Abrassart, A., & Collin, S. 2000, A&A, 357, 823 [NASA ADS] (In the text)
- Dumont, A., &
Collin, S. 2001, Spectroscopic Challenges of Photoionized Plasmas,
ASP Conf. Ser., 247, 231
(In the text)
- Dumont, A.-M.,
Collin, S., Paletou, F., et al. 2003, A&A, 407, 13 [EDP Sciences] [NASA ADS] (D03)
(In the text)
- Elitzur, M. 1982,
Rev. Mod. Phys., 54, 1125 [NASA ADS] (In the text)
- Ferland, G. J.,
Korista, T., Verner, D. A., et al. 1998, PASP, 110, 761 [NASA ADS]
- Godet, O., Collin,
S., & Dumont, A.-M. 2004, A&A, submitted
(In the text)
- Hubeny, I. 2001,
Spectroscopic Challenges of Photoionized Plasmas, ASP Conf. Ser.,
247, 197
(In the text)
- Hummer, D. G. 1968,
MNRAS, 138, 73 [NASA ADS] (In the text)
- Kalkofen, W.
1984, Methods in radiative transfer (Cambridge University
Press)
- Kalkofen, W.
1987, Numerical Radiative Transfer (Cambridge University
Press)
- Kallman, T. R.,
& Krolik, J. H. 1995, XSTAR, a Spectral Analysis Tool, Users
Guide
(In the text)
-
Kinkhabwala, A., Sako, M., Behar, E., et al. 2002, ApJ, 575,
732 [NASA ADS] [CrossRef] (In the text)
- Milkey, R. W.,
& Mihalas, D. 1973, ApJ, 185, 709 [NASA ADS] [CrossRef] (In the text)
- Netzer, H. 1975,
MNRAS, 171, 395 [NASA ADS] (In the text)
- Netzer, H. 1993,
ApJ, 411, 594 [NASA ADS] [CrossRef] (In the text)
- Ogle, P. M., Brookings,
T., Canizares, C. R., Lee, J. C., & Marshall, H. L. 2003,
A&A, 402, 849 [EDP Sciences] [NASA ADS] [CrossRef] (In the text)
- Sako, M., Kahn, S. M.,
Paerels, F., & Liedahl, D. A. 2000, ApJ, 543, L115 [NASA ADS] [CrossRef] (In the text)
- Vernazza, J.
E., Avrett, E. H., & Loeser, R. 1981, ApJS, 45, 635 [NASA ADS] [CrossRef] (In the text)
Copyright ESO 2004
![\begin{figure}
\par\includegraphics[width=18cm,clip]{0058fig1.eps}
\end{figure}](/articles/aa/full/2004/21/aa0058-04/img44.gif)
![\begin{figure}
\par\includegraphics[angle=-90,width=17.4cm,clip]{0058fig2.eps}
\end{figure}](/articles/aa/full/2004/21/aa0058-04/img45.gif)
![\begin{figure}
\par\includegraphics[angle=-90,width=17.4cm,clip]{0058fig3.eps}
\end{figure}](/articles/aa/full/2004/21/aa0058-04/img46.gif)
![\begin{figure}
\par\includegraphics[width=7.4cm,clip]{0058fig4.eps}
\end{figure}](/articles/aa/full/2004/21/aa0058-04/img50.gif)
![\begin{figure}
\par\includegraphics[width=8.8cm,clip]{0058fig5.eps}
\end{figure}](/articles/aa/full/2004/21/aa0058-04/img51.gif)
![\begin{figure}
\par\includegraphics[width=7.6cm,clip]{0058fig6.eps}
\end{figure}](/articles/aa/full/2004/21/aa0058-04/img52.gif)
![\begin{figure}
\par\includegraphics[angle=-90,width=17.4cm,clip]{0058fig7.eps}
\end{figure}](/articles/aa/full/2004/21/aa0058-04/img58.gif)