 |
(1) |
A&A 419, 357-363 (2004)
DOI: 10.1051/0004-6361:20040072
R. Kissmann1 - H. Fichtner1 - S. E. S. Ferreira2
1 - Institut für Theoretische Physik IV, Ruhr-Universität Bochum,
44780 Bochum, Germany
2 - Unit for Space Physics, School of Physics, Potchefstroom University
for C.H.E., 2520 Potchefstroom, South Africa
Received 7 May 2003 / Accepted 28 January 2004
Abstract
Much work has been done on Corotating Interaction Regions (CIRs),
see e.g. Balogh et al. (1999).
Apart from the actual impact of CIRs on the solar wind plasma environment,
the influence of CIRs on energetic particle populations has been
of special interest.
In this paper we study the influence of a CIR on the
propagation of Jovian electrons to a spacecraft located at 1 AU.
Recent modelling in this field has been concentrated on the local influence
of CIRs on the electron flux at distances greater than 1 AU.
This is due to the fact that modelling on larger spatial scales thus
reaching closer to the Sun requires
a 3D numerical model which also includes an energy and time dependence of
the intensities.
With our recently developed numerical model we were able to fulfil
these requirements.
We show the results of the calculated influence of CIRs
on the Jovian and Galactic electron intensity at 1 AU, compared to
data taken by the IMP 8 spacecraft, and discuss the implications for the CIR
effects on the transport of energetic electrons.
Key words: cosmic rays - turbulence - shock waves - convection - diffusion - methods: numerical
The research concerned with the influence of Corotating Interaction Regions (CIRs) on the continuous flux of energetic electrons, i.e. of Jovian and Galactic origin can formally be split into two fields. First, very interesting results can be obtained by a direct analysis of the data recorded by various spacecraft. Since, usually, only the data recorded on one spacecraft is available, such analysis is confined to the space regions close to the spacecraft. For an analysis of a non-local effect of CIRs one has to apply models to take into account the transport of the particles. These models constitute the second of these fields. According to the region of interest, models considering the transport of Jovian electrons are applicable to different spatial regions. For example the analytical model by Chenette et al. (1974) is only applicable in the vicinity of the Jovian source.
In contrast, considering the huge database provided by many spacecraft
at 1 AU as well as in the
outer heliosphere - e.g. the IMP 8 probe recorded data throughout more than
two solar cycles without major data gaps - a model for the influence of
CIRs on large-scale electron transport would be desirable.
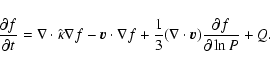
For this, one needs to solve the Parker equation (Parker 1965) considering
three spatial dimensions:
Due to the fact that, additionally, the time- and energy-dependence of the electron flux have to be taken into account most numerical studies for the transport of Jovian electrons in the inner heliosphere have been restricted to a steady state heliosphere (see e.g. Ferreira et al. 2001). With observations revealing fast variations of the electron flux obviously connected to CIRs, such a model cannot be applied to the study of the influence of CIRs on energetic particles. Therefore, models with only two spatial dimensions but including time- and energy-dependencies were applied to studies of Galactic cosmic rays (see e.g. Le Roux & Potgieter 1993). These models, however, are not capable of describing the transport of energetic electrons from the Jovian point source into the inner heliosphere. A first 3D model including time-dependence was developed by Fichtner et al. (2001) with a fluid approach avoiding the energy-dependencies by a momentum-averaging. To avoid this averaging, Kissmann (2002) developed a model that includes time variation and an approximated energy dependence of the distribution function. This consequently allows the study of the CIR effect on energetic electron fluxes. This model, also presented in Kissmann et al. (2003b), was applied to different CIR scenarios to get some principal insight into their influence on the energetic electrons. It is important to realise that a numerical model as used in this study is applied to other scales than most of the recent studies of CIRs. Most of these models are concerned with effects on much shorter time scales and, thus, much smaller spatial scales than a numerical model also taking Galactic electrons into account can address nowadays (see e.g. Crooker et al. 1999).
A CIR is created by solar wind streams flowing in the same direction with different velocities. Due to the frozen-in magnetic field a faster stream cannot overtake a slower one and, thus, running into it, causes the creation of an interaction region. If the difference in the velocities of the solar wind streams perpendicular to the stream interface exceeds twice the maximum local wave speed, a shock wave forms on both sides of this region. The region surrounded by these shock waves is called a CIR. CIRs usually form around 2 AU and decrease in strength (which is e.g. characterised by the local increase of density or mach-number of the shocks) when they are convected with the solar wind, since the shock waves reduce the difference in the velocities. Additionally, due to the velocities of the shock waves relative to the stream interface, a CIR broadens as it is convected to greater radial distances (see Gazis 2000). As long as the source regions on the Sun are stable, these structures will be stable for several solar rotations while corotating with the Sun. Due to this and to the radial broadening these structures merge at greater radii and form so-called merged interaction regions (see e.g. Le Roux & Potgieter 1993).
Thus, a list of the main features of a CIR reads as follows. Considering the radial signatures of the solar wind velocity one can distinguish a region of a slow increase of the solar wind velocity from the lowest to the highest velocity on the Sun-ward side of a CIR and a sharp decrease of the velocity inside a CIR - including the formation of two shock waves. Additionally, both the particle density and the magnetic field density - which is coupled to the solar wind plasma because it is frozen in - are increased inside a CIR. This increase is due to the pile-up of the plasma connected with the fast solar wind stream behind the slow stream. On the Sun-ward side of a CIR there is a corresponding rare faction region where the fast solar wind flows away from the subsequent slow solar wind stream.
The interaction of the streams leading to the density and magnetic field increase inside a CIR also causes an increase of the fluctuations of the magnetic field. In terms of the spatial diffusion included in the Parker equation, this should lead to more frequent scattering of charged particles inside a CIR, and thus to a shorter mean free path. In Crooker et al. (1999) an additional reason for decreased perpendicular diffusion inside CIRs is given, namely the suppressed field line braiding across the heliospheric current sheet. Observations indicate, however, that the strongest decrease is connected with the stream interface which, usually, is not identical with the position of the current sheet (see Crooker et al. 1999).
According to the remarks in the preceding section there appear to be two major effects of a CIR on the transport of energetic particles:
Since we are using mostly the same model parameters as described in
Ferreira et al. (2001) we consider only solar minimum conditions.
This ensures the stability of a CIR for a relatively long time (several solar
rotations). Even with this constraint there is a huge amount of data available - especially concerning measurements at 1 AU.
Since the data recorded in 1974 by the IMP 8 probe indicate a
stable CIR and very little disturbance by solar events, we chose this
period as an example.
For this we obtained the 2-12 MeV count-rate data of Chicago IMP-8 CRNC
telescope. These can be found at: http://ulysses.sr.unh.edu/WWW/Simpson/imp8.html.
We decided to use this channel since signatures of Jovian electrons are
clearest at this energy.
The data were corrected for solar particle events by using only data for
which the 6-hour-averaged ID2/ID3 electron ratio is less than 1.0
(see e.g. Chenette 1980).
The filtered data were subjected to a 3-day averaging process.
For the correction we rejected any data above a given spectral index calculated
by the ratio of the 0.7-2.0 MeV channel to the one under consideration here
(Heber 2003).
The (synodic) solar rotation period only becomes clearly visible after
this reduction procedure (see e.g. Kissmann et al. 2003a).
Finally, the count-rate data was scaled by a factor of ![]() 240 in order to
yield the same flux rates as given in Chenette (1980).
240 in order to
yield the same flux rates as given in Chenette (1980).
![\begin{figure}
\par\includegraphics[width=8.4cm,clip]{4514fig1.eps}\end{figure}](/articles/aa/full/2004/19/aah4514/img10.gif) |
Figure 1: 3-day averaged IMP 8 electron flux data for the energy range 2-12 MeV taken in 1974. These data are corrected for solar events. The 13-months and 27-day periodicities can clearly be seen. Note that the maximum of the 13-months period did not occur when Jupiter was in opposition at the fifth of September in 1974 (day 248 in the above plot). This is due to the fact, that the electrons do not travel radially into the inner heliosphere, since they diffuse more readily along the Parker spiral. |
| Open with DEXTER | |
The data set we use for comparison is shown in Fig. 1. The 13-months period resulting from the varying distance between the Jovian source and the spacecraft at 1 AU can clearly be seen. Additionally, one can see a 27-day periodicity which is caused by CIRs and related to the solar rotation.
The numerical calculations of the electron fluxes given in this paper were obtained by a numerical solution of the Parker equation (Eq. (1)). We employed the BiCGStab solver with the ILU preconditioner from the VLUGR3 package by Blom & Verwer (see e.g. Blom & Verwer 1996,1994). This code was used to solve the Parker equation within the context of our new time-dependent model as given in Kissmann et al. (2003b).
As the global model for these numerical calculations we consider a spherical heliosphere with the Galactic electron spectrum given at the outer boundary at 120 AU (thus omitting any modulation in the heliosheath). For the latter we used the local interstellar spectrum as given by Langner et al. (2001). A numerical representation of this spectrum can be found in Ferreira (2002). For the boundary at the inner heliosphere we used a reflecting sun. As an additional source we included the Jovian electrons at 5.2 AU with the spectrum given in Ferreira et al. (2001). In our model the Jovian source was assumed to be a point source via fixing the electron flux at one grid point at 5.2 AU in the equatorial plane. The results were finally read along the IMP-8 1974 trajectory.
Here we want to model the electron data in 1974.
Therefore we are interested in solar minimum heliospheric conditions,
where a CIR would be stable for several solar rotations.
Thus, we use the solar minimum large-scale profile for the solar wind
velocity with a value of 400
![]() in the equatorial plane and 800
in the equatorial plane and 800
![]() at the poles
(for details see e.g. Kissmann 2002).
We assume a modified Parker heliospheric magnetic field
embedded in this solar wind
(i.e. we assume enhanced diffusion towards the poles of the Sun).
Here only the direction of the field is important, since
we neglect particle drifts, which is justified at these low energies
(see Ferreira 2002).
at the poles
(for details see e.g. Kissmann 2002).
We assume a modified Parker heliospheric magnetic field
embedded in this solar wind
(i.e. we assume enhanced diffusion towards the poles of the Sun).
Here only the direction of the field is important, since
we neglect particle drifts, which is justified at these low energies
(see Ferreira 2002).
Finally, for the large-scale particle transport we use the diffusion tensor by Ferreira et al. (2001). This tensor was shown to fit the electron data (i.e. the Ulysses, Pioneer and Voyager data) for a steady-state solar minimum heliosphere (see Ferreira et al. 2001).
To include CIRs, this global model of the heliosphere was modified as given in the paragraphs below.
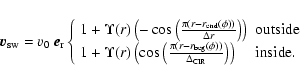
For the variation of the solar wind velocity we used a simplified analytical model which will be illustrated in the following paragraph.
The main features of this model are the slow increase of the solar wind velocity on the Sun-ward side of a CIR and the strong decrease inside the interaction region. Additionally, we allow for a radial reduction of the velocity differences. However, for simplification we omit the widening of a CIR with radial distance and we also neglect the shocks to retain numerical stability. Another limitation for the modelling arises from the fact that we use a simple analytical model. Thus, no self-consistency for the plasma interaction is incorporated.
![\begin{figure}
\par\includegraphics[width=8.15cm,clip]{4514fig2.eps}\end{figure}](/articles/aa/full/2004/19/aah4514/img12.gif) |
Figure 2: Simplified analytical model for the variation of the solar wind velocity connected with a CIR. The lower panel is a zoom into the upper to illustrate some of the parameters used in this model. For further details see also Eq. (2). |
| Open with DEXTER | |
The actual radial dependence of the model solar wind velocity in the ecliptic
plane considering a single stable CIR is given as:
The results obtained by employing this CIR structure in the time-dependent model are given in Fig. 3. There the 13-months and the 27-day period can clearly be seen. For comparison the data, which are scaled by a factor of five, are also shown in Fig. 3. For such a comparison one has to take into account that we used an arbitrary phase for the 27-day period, while the phase of the 13-months period is given by the trajectory of IMP-8. A comparison demonstrates that the basic structure of the 27-day periodicity can be described quite accurately by this simple model. This makes it clear that it is very important to include the variations of the solar wind velocity in any model which aims at the description of the influence of CIRs on the flux of energetic electrons.
![\begin{figure}
\par\includegraphics[width=8.4cm,clip]{4514fig3.eps}\end{figure}](/articles/aa/full/2004/19/aah4514/img15.gif) |
Figure 3:
Results of a numerical model exclusively taking into
account the variation of the solar wind velocity. Measurements
of the |
| Open with DEXTER | |
Figure 4 additionally gives the opportunity to study the radial
development of the perturbations of the electron flux caused by the variation of the solar wind velocity.
Here we show the computed electron intensity in the direction of the
Jovian source (which can be clearly recognised as the strong maximum at 5.2 AU)
from the Sun to 10 AU.
These plots were taken in chronological order with each plot the sixth part
of a solar rotation apart.
The solid line indicates the position of the modelled CIR, with the dotted
lines giving the width of the structure
![]() as in Fig. 2.
It can easily be seen that this variation causes a very global effect on the
electron flux - especially as compared to a model with
decreased diffusion inside the CIR (see the discussion of Fig. 7).
Figure 4 shows small intensity increases connected to a CIR
rather than any local decrease.
as in Fig. 2.
It can easily be seen that this variation causes a very global effect on the
electron flux - especially as compared to a model with
decreased diffusion inside the CIR (see the discussion of Fig. 7).
Figure 4 shows small intensity increases connected to a CIR
rather than any local decrease.
Apart from the change in adiabatic cooling caused by the variation of the solar wind velocity, the variation shown in Fig. 3 is mainly caused by the change in the convection and, thus, the changed magnetic field geometry (in the Parker magnetic field the field angle depends on the solar wind speed). Thus, the periodically changing magnetic connection is very important for the observed 27-day variation.
![\begin{figure}
\par\includegraphics[width=8.5cm,clip]{4514fig4.eps}\end{figure}](/articles/aa/full/2004/19/aah4514/img18.gif) |
Figure 4:
Time dependence of the influence of a model CIR on
the electron flux (normalised to the Galactic intensity) as calculated with the numerical model.
Here CIRs are exclusively represented via the solar wind speed variations
associated to them. The time spacing between the individual frames is
|
| Open with DEXTER | |
For the time-averaged description of the diffusion we used a diffusion tensor
![]() as given in Ferreira et al. (2001).
For the modelling of the CIRs we additionally superimposed a 27-day variation.
Though unphysical, in
order to distinguish between the effects of the reduced diffusion and the
variation of the solar wind velocity, we neglect the variation of the latter
for this model.
as given in Ferreira et al. (2001).
For the modelling of the CIRs we additionally superimposed a 27-day variation.
Though unphysical, in
order to distinguish between the effects of the reduced diffusion and the
variation of the solar wind velocity, we neglect the variation of the latter
for this model.
For a simple analytical representation of the diffusion along the magnetic
field we assume:
![\begin{figure}
\par\includegraphics[width=8.2cm,clip]{4514fig5.eps}\end{figure}](/articles/aa/full/2004/19/aah4514/img20.gif) |
Figure 5: Simple analytical model for the variation of the parallel diffusion inside a CIR. The lower panel is a zoomed-in part of the upper panel. |
| Open with DEXTER | |
In contrast to the case of the solar wind variation, which can in principle be determined by direct measurements, we included for the parallel diffusion apart from the ansatz (3) itself two parameters - namely the width of a CIR and the constant of proportionality in Eq. (3).
In Fig. 6 two of the numerical solutions are shown. For both cases the time-averaged diffusion tensor was the same as in Ferreira et al. (2001). Here we compared the results assuming CIRs with equivalent widths (see Appendix A) of 0.6 AU and 0.3 AU, respectively. Again the data are shown as a dotted line and scaled by a factor of five.
![\begin{figure}
\par\includegraphics[width=8.4cm,clip]{4514fig6.eps}\end{figure}](/articles/aa/full/2004/19/aah4514/img21.gif) |
Figure 6: Results of a numerical model only taking into account the variation of the diffusion inside a CIR with an equivalent width of 0.6 AU (dashed line) and 0.3 AU (solid line). Measurements of a virtual probe at 1 AU. A 13-months and a 27-day variation can be seen. The data (dotted line), which were scaled by a factor of five, are shown as the dotted line for comparison. |
| Open with DEXTER | |
As in the case of the variation of the solar wind velocity, both periodicities can be clearly seen. In this case, however, it is obvious that the basic structure of the 27-day variation does not resemble the data. Furthermore, the amplitude of the variation is larger than given by observations. While this might be fixed by reducing the width of the CIRs or the constant of proportionality in Eq. (3), the basic structure does not change when changing any of these parameters. Thus, we found that the simple analytical model given here does not fit the data. Additionally, one has to bear in mind that the variations of the solar wind velocity were omitted in this model. A combination of both effects would probably lead to a superposition yielding an even stronger variation than found for this simple case. This would imply that the reduction of the diffusion inside CIRs has to be significantly less than proposed by the simple assumption given in Eq. (3). This, however, has to be quantified by further numerical calculations.
Though the model results in this section cannot be used to fit the data, it is nonetheless interesting to look at the radial evolution of the influence of the diffusion barriers on the electron flux shown in Fig. 7.
![\begin{figure}
\par\includegraphics[width=8.5cm,clip]{4514fig7.eps}\end{figure}](/articles/aa/full/2004/19/aah4514/img22.gif) |
Figure 7: As Fig. 4 but for CIRs modelled as pure diffusion barriers. |
| Open with DEXTER | |
Compared to the effect of the changing solar wind velocity (see Fig. 4) the impact of the reduced diffusion inside a CIR is very local. In combination with this behaviour there are some very interesting effects visible in the calculation results.
First, it is obvious that the diffusion barriers lead to local decreases of the electron flux on the Sun-ward side of the Jovian source and to increases in the outer heliosphere. Considering that the only spatial transport processes are convection with the solar wind and diffusion, it is clear that the transport of particles from the Jovian source into the outer heliosphere is a combination of both processes working nearly in the same direction (convection is a strictly outward directed process and diffusion effectively transports particles in the opposite direction of the local flux gradient. - Considering only the line connecting Jupiter with the sun, this gradient is directed nearly radial at the Jovian source). This implies that reduced diffusion in the radial direction leads to less efficient transport and, in turn, to a pile-up of particles on the Sun-ward side of the diffusion barrier.
On the Sun-ward side of the source the situation is the other way round. Here the particle distribution is determined by convection and diffusion working against each other - as long as we consider only the radial direction. Thus, reduced diffusion allows the convection to drive the particles outward much more easily, leading to a reduced intensity inside CIRs. The recovery of the intensity on the Sun-ward side of the CIRs is caused by the 3D action of the diffusion: The particles do not only stream radially inward but they also diffuse along the field-lines. Going once around the Sun like this, they can get to the Sun-ward side of the diffusion barrier without ever crossing the CIR. So, the reason for the effect of the diffusion barriers on the Sun-ward side of the source being local is connected to the fact that most electrons reach the spacecraft at 1 AU along the magnetic field lines - never actually crossing a CIR.
It is also very interesting that the impact of a CIR is much stronger near the Jovian source than further away. This is due to the steep gradient near the source. Since the process of diffusion tries to decrease gradients, weaker diffusion leads to a steeper gradient. Consequently, a region with a strong gradient will be affected most strongly by a diffusion barrier. Measurements made near Jupiter - as for example by the Voyager and Pioneer spacecraft - should give interesting clues to the diffusion inside CIRs. This point, however, cannot be studied by a model calculation of the fluxes for the whole heliosphere, and would thus require a different model. It will also be interesting to look at the effects of CIRs at higher latitudes on the basis of the Ulysses measurements, since the mechanism of transport up to these latitudes would be more complex, taking into account the 3D structure of the inner heliosphere.
Concerning diffusion inside CIRs the numerical calculations indicate
that it is less significant for particles transported from the Jovian source
to 1 AU than in the models discussed here.
While this seems to contradict the results given in observation-based papers,
where strong indications for a reduced diffusion were found, one has to
take into account the different scales considered in both cases.
On the one hand data analyses show decreases on the order of hours - with 1 hour of data being equivalent to a spatial extent of about
0.01 AU of plasma passing the spacecraft for a solar wind speed of
![]() .
On the other hand the resolution achieved in the numerical model
is much poorer - given a radial distance of the grid points of about 0.1 AU at the position of the spacecraft.
Thus, the numerical calculations have to be understood as to have been done for
larger scales, leading to the conclusion that the effective reduction of the
mean free path is negligible - on this spatial scale.
Additionally, the fact that the observations used for this paper have been
averaged over three days has to be kept in mind, resulting in the fact that
short-scale decreases are not visible in the data set given in Fig. 1.
.
On the other hand the resolution achieved in the numerical model
is much poorer - given a radial distance of the grid points of about 0.1 AU at the position of the spacecraft.
Thus, the numerical calculations have to be understood as to have been done for
larger scales, leading to the conclusion that the effective reduction of the
mean free path is negligible - on this spatial scale.
Additionally, the fact that the observations used for this paper have been
averaged over three days has to be kept in mind, resulting in the fact that
short-scale decreases are not visible in the data set given in Fig. 1.
A second contradiction seems to arise from the fact that, in favour of reduced diffusion inside a CIR, the observations show a strong increase in the fluctuation level of the magnetic field (see Crooker et al. 1999). This is usually expected to yield a decreasing mean free path as discussed in the introduction. One has, however, to take into account the different turbulence inside a CIR. If one considers a wave interpretation of the turbulence (see e.g. Schlickeiser 1989) it is clear that the diffusion would change in an environment with additional wave modes as compared to the solar wind (for the observations of different wave modes in CIRs see Mavromichalaki et al. 1996). Thus the net diffusion might be subject to minor changes in the CIR - maybe with an additional strong decrease only in the small region about the stream interface.
An additional way to get rid of the strong intensity decreases inside a CIR despite a shorter parallel mean free path, would be a variation of the ratio of the perpendicular to the parallel mean free path, due to the changing turbulence inside the CIR. Since it is mainly the reduced transport perpendicular to the magnetic field lines inside a CIR, that leads to the intensity decreases in our numerical model, a higher ratio compensating the reduction of the parallel mean free path would also avoid these decreases.
To clarify this matter and to gain a better understanding of these problems, it is very important to apply the theoretical models for the transport of cosmic rays to the strong turbulence inside the CIRs. It would also be important to calculate the effect of shocks on the solar wind wave turbulence in the special case of CIRs (for the derivation of the influence of shock waves on Alfvén waves see e.g. Vainio & Schlickeiser 1999). Finally, we can draw the general but important conclusion that despite the good observational basis, there is much theoretical and modelling work to be done concerning diffusion of energetic particles inside CIRs.
As above we should mention some of the limitations of the models used in this paper. Apart from the shortcomings of the numerical solver which seem to be negligible (see Kissmann et al. 2003b), the limitations of the model itself should be mentioned.
To achieve a better comparison of the numerical results to the observational data it would be desirable to use a model with a higher spatial resolution than used for the results presented here. The code we used for our calculations, however, cannot be extended to a significantly increased spatial resolution. This limitation is amplified by the fact, that we also included the Galactic cosmic ray electrons in our studies, leading to the necessity to calculate a domain with a diameter of 120 AU.
Additionally, both CIR models discussed in this paper are simple analytical models, while it would be desirable - at least for the solar wind velocity - to include either actual observations or the results of a consistent MHD model. Also the shock acceleration at the CIR-shocks was not included in the model. The neglect of the structure of the outer heliosphere - in particular the termination shock and the modulation of Galactic electrons in the heliosheath, however, seems to be of no importance for our modelling (see e.g. Ferreira 2002).
Despite the simplified representations for a CIR used in this paper we were able to draw some interesting conclusions. In summary these are as follows.
The influence of the solar wind velocity variation connected to the formation
of a CIR on the electron flux is very significant on intermediate spatial
scales. This variation should not be neglected in any model considering
CIR effects on energetic particles in the energy range considered here (![]() 6 MeV).
6 MeV).
On the spatial scales considered in this paper no major reduction of the diffusive mean free path inside a CIR seems to be required to explain the observations. We were also able to clarify the resulting apparent contradiction with observational results concerning diffusion inside CIRs.
Further studies of this subject would need improved numerical solvers in connection with a higher spatial resolution. Additionally, a theoretical diffusion model for the region inside a CIR would be desirable as a starting point for a refined numerical study.
As an illustration of the equivalent width of a CIR as used in Sect. 7 first consider a box-shaped diffusion barrier instead
of the continuous variation of the parallel mean free path inside CIRs.
In order to get the equivalent width as a parameter to be used in the
analytical formula for the variation of the mean free path, we
demand for the continuous version the same integrated decrease compared
to the box-case.
This yields the following connection between the equivalent width
mentioned above and the width of the box.
 |
(A.1) |
Acknowledgements
This work was partially financed by the Deutsche Forschungsgemeinschaft (DFG) through the Sonderforschungsbereich SFB 591 and benefited from the bilateral UCRJET collaboration supported by the DFG and the South African National Research Foundation (NRF). We also thank Bernd Heber and Arik Posner for discussions - especially on data analysis. Furthermore, we thank Clifford Lopate for help concerning access to IMP 8 data.