![\begin{figure}
\par\resizebox{7.8cm}{!}{\includegraphics[clip]{4142_fig1.eps}}
\end{figure}](/articles/aa/full/2004/17/aa4142/img102.gif) |
Figure 1:
Image
magnifications. Solid line: the brighter images ( |
| Open with DEXTER | |
In the text
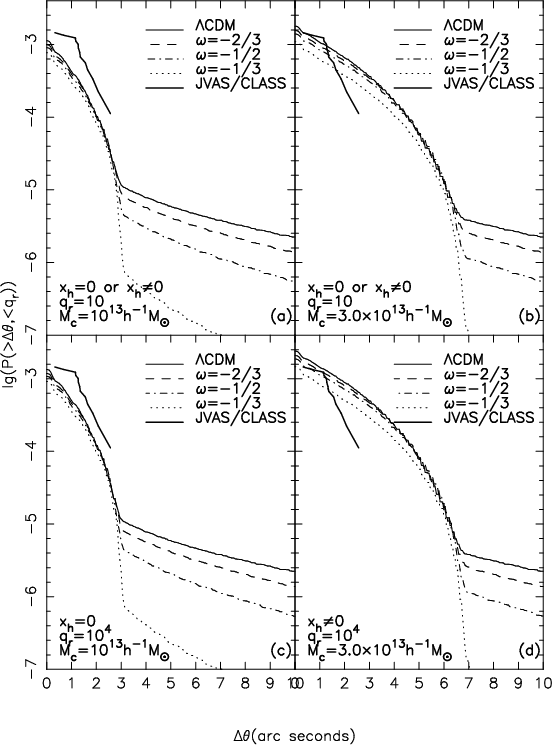 |
Figure 2:
The
integral lensing probabilities with image separations larger than
|
| Open with DEXTER | |
In the text
| |
Figure 1:
Image
magnifications. Solid line: the brighter images ( |
| Open with DEXTER | |
| |
Figure 2:
The
integral lensing probabilities with image separations larger than
|
| Open with DEXTER | |