
A&A 417, 79-91 (2004)
DOI: 10.1051/0004-6361:20034253
T. Foster 1,2 - D. Routledge 3 - R. Kothes 1,4
1 - National Research Council of Canada, Herzberg Institute of
Astrophysics, Dominion Radio Astrophysical Observatory, PO Box 248,
Penticton, BC V2A 6J9 Canada
2 -
Dept. of Physics, University of Alberta, Edmonton, Alberta, T6G 2J1 Canada
3 -
Dept. of Electrical and Computer Engineering, University of Alberta,
Edmonton, Alberta, T6G 2V4 Canada
4 -
Dept. of Physics and Astronomy, The University of Calgary, 2500 University
Drive NW, Calgary, Alberta, T2N 1N4 Canada
Received 1 September 2003 / Accepted 19 November 2003
Abstract
New Canadian Galactic Plane Survey  21 cm H I line
observations towards supernova remnant (SNR) 3C 434.1 (G94.0+1.0) are
presented. We find a fragmented and thin-walled atomic hydrogen shell
inside which the SNR is seen to be contained at
21 cm H I line
observations towards supernova remnant (SNR) 3C 434.1 (G94.0+1.0) are
presented. We find a fragmented and thin-walled atomic hydrogen shell
inside which the SNR is seen to be contained at  80 km s-1, which we report to be a highly evolved stellar wind
bubble (SWB) associated with the remnant. A dark area in the midst of otherwise
bright line emission is also seen near -71 km s-1. An absorption
profile to the extragalactic continuum source 4C 51.45 (superimposed
on the shell's north face) allows us to probe the shell's
optical depth, kinetic temperature and expansion velocity.
The material in the dark area
has the same properties as material in the fragmented shell, suggesting that
the dark area is actually the far-side "cap'' of the shell seen absorbing
emission from warm background gas, the first instance of H I
Self Absorption (HISA) seen in such a structure. We show that the
kinematic distance of 10 kpc derived from a flat Galactic rotation
model is highly improbable, and that this bubble/SNR system is most
likely resident in the Perseus Spiral Arm, lying 5.2 kpc distant.
We model the SWB shell in three dimensions as a homologously
expanding ellipsoid. Physical and dynamical characteristics of the bubble are
determined, showing its advanced evolutionary state. Finally, from a
photometric search for one or more stars associated with the SWB, we
determine that three B0V stars and one O4V star currently inhabit
this bubble, and that the progenitor of 3C 434.1 was at latest also an O4 type
star.
80 km s-1, which we report to be a highly evolved stellar wind
bubble (SWB) associated with the remnant. A dark area in the midst of otherwise
bright line emission is also seen near -71 km s-1. An absorption
profile to the extragalactic continuum source 4C 51.45 (superimposed
on the shell's north face) allows us to probe the shell's
optical depth, kinetic temperature and expansion velocity.
The material in the dark area
has the same properties as material in the fragmented shell, suggesting that
the dark area is actually the far-side "cap'' of the shell seen absorbing
emission from warm background gas, the first instance of H I
Self Absorption (HISA) seen in such a structure. We show that the
kinematic distance of 10 kpc derived from a flat Galactic rotation
model is highly improbable, and that this bubble/SNR system is most
likely resident in the Perseus Spiral Arm, lying 5.2 kpc distant.
We model the SWB shell in three dimensions as a homologously
expanding ellipsoid. Physical and dynamical characteristics of the bubble are
determined, showing its advanced evolutionary state. Finally, from a
photometric search for one or more stars associated with the SWB, we
determine that three B0V stars and one O4V star currently inhabit
this bubble, and that the progenitor of 3C 434.1 was at latest also an O4 type
star.
Key words: ISM: bubbles - ISM: supernova remnants - stars: winds, outflows
The supernova remnant (SNR) 3C 434.1 (
 ,
,
 )
is one of two remnants in the Galactic plane region near
,
and is seen among a collection of thermal objects. It appears as
a radio continuum shell of radius 14 arcmin, smaller than most shell-type
remnants visible in the Canadian Galactic Plane Survey (CGPS, Taylor et al. 2003).
The 21 cm continuum appearance of this object is similar
to the neighboring H II region NRAO 655, discussed by Foster & Routledge (2001, Paper I).
The space between these two objects appears filled by dim
continuum emission, and the objects appear bridged by this nebulosity.
We study the remnant's multi-wavelength appearance in emission and
its relationship with NRAO 655 no further here, but in a future publication.
In this present paper we report a thorough examination of the neutral material
surrounding this SNR, and submit that it is in reality a distant SNR/Stellar Wind
Bubble (SWB) pairing.
)
is one of two remnants in the Galactic plane region near
,
and is seen among a collection of thermal objects. It appears as
a radio continuum shell of radius 14 arcmin, smaller than most shell-type
remnants visible in the Canadian Galactic Plane Survey (CGPS, Taylor et al. 2003).
The 21 cm continuum appearance of this object is similar
to the neighboring H II region NRAO 655, discussed by Foster & Routledge (2001, Paper I).
The space between these two objects appears filled by dim
continuum emission, and the objects appear bridged by this nebulosity.
We study the remnant's multi-wavelength appearance in emission and
its relationship with NRAO 655 no further here, but in a future publication.
In this present paper we report a thorough examination of the neutral material
surrounding this SNR, and submit that it is in reality a distant SNR/Stellar Wind
Bubble (SWB) pairing.
Stellar winds carve much of the sponge-like structure of neutral hydrogen observed in the interstellar medium. Most of the originators of these winds, including SNR precursors, tend to cluster in associations, and it is thus not surprising to find SNRs evolving into environments greatly modified by groups of massive stars. The legacies of OB star groups are large interstellar cavities, surrounded by expanding outer shells, whose edges are often delineated by swept-up neutral hydrogen, and are thus observable in the H I spectral line. We expect pairings of supernova remnants with H I shells cloaking OB associations to be particularly common within the Galactic spiral arms, where the SNR progenitors and their siblings have formed.
A fine example of a cavity evacuated by an OB cluster and containing an SNR formed within it is seen in the H I environment surrounding the nearby SNR G106.3+2.7 (Kothes et al. 2001). Those authors suggest the formation of the progenitor was triggered by the stellar winds and supernova explosions of cluster members.
We present the discovery of a distant shell of cold atomic hydrogen that surrounds 3C 434.1, and show that it is likely an old SWB carved out mainly by two O-type stars, one of which was the progenitor of 3C 434.1. The foreground column density is found and hence the distance to the shell and its linear extent, using the new distance technique of Foster & Routledge (2003) (see Sect. 3.3 below). The availability of high-resolution CGPS continuum and H I spectral line data allows observation of the bubble's physical structure, and for the first time neutral material of a stellar wind bubble is seen absorbing emission from warm H I gas behind it. The cold gas of the shell is also seen to absorb emission from the bright and auspiciously located radio continuum point source 4C 51.45, allowing confirmation of parameters and expansion velocity calculated for the shell from emission data. The dynamics and time history of this SWB are modeled and discussed in detail. Finally, from deep UBV photometric observations of stars towards 3C 434.1, four stars are identified as candidates for association with the SWB, and the physical effects of this cluster discussed.
The field of 3C 434.1 was observed in the 1420 MHz continuum and 21 cm line
with the Synthesis Telescope (ST) at the Dominion Radio
Astrophysical Observatory (DRAO). The continuum and atomic hydrogen line observations were centred on (
 ,
1.00
,
1.00
 )
and are part of the CGPS, a project by a consortium of researchers from
five countries to map a large segment of the northern Galactic plane
in radio and infrared wavelengths at a resolution approaching 1 arcmin
(Taylor et al. 2003). The field of view is 3.1 degrees
at 21 cm to the 10% level. The FWHM of the beam achieved by the ST is
)
and are part of the CGPS, a project by a consortium of researchers from
five countries to map a large segment of the northern Galactic plane
in radio and infrared wavelengths at a resolution approaching 1 arcmin
(Taylor et al. 2003). The field of view is 3.1 degrees
at 21 cm to the 10% level. The FWHM of the beam achieved by the ST is
 in the 1420 MHz continuum. H I line
images have 1.1 arcmin resolution in each of 256 channels, and
are separated by 0.824 km s-1, with a velocity resolution of 1.3 km s-1. The H I line data have intensity uncertainty
due to calibration of
in the 1420 MHz continuum. H I line
images have 1.1 arcmin resolution in each of 256 channels, and
are separated by 0.824 km s-1, with a velocity resolution of 1.3 km s-1. The H I line data have intensity uncertainty
due to calibration of  10%, and the continuum data, 5%.
Other relevant parameters of the telescope and data reduction procedures
are given in Sect. 2.1 in Paper I, and further instrumental detail
can be found in Landecker et al. (2000).
10%, and the continuum data, 5%.
Other relevant parameters of the telescope and data reduction procedures
are given in Sect. 2.1 in Paper I, and further instrumental detail
can be found in Landecker et al. (2000).
To depict ISM structures accurately in the CGPS radio continuum and H I line images (especially those of large angular size), missing short-spacing information is routinely added to each ST map. The data are obtained from the Effelsberg 21 cm Galactic Plane Survey (Reich et al. 1997) and an all-sky H I line survey made with the DRAO 25.6m paraboloid (Higgs & Tapping 2000).
On 2001 August 9, and 2001 November 18, 407 stars in a
 field towards
,
(field 1) were observed
with the 0.5m optical telescope at the University of Alberta's Devon Astronomical
Observatory (Foster et al. 1999). Two separate nights' observations
were performed to compare the consistency and assess the final quality
of the photometry. A second field (field 2) was also observed (332 stars towards
field towards
,
(field 1) were observed
with the 0.5m optical telescope at the University of Alberta's Devon Astronomical
Observatory (Foster et al. 1999). Two separate nights' observations
were performed to compare the consistency and assess the final quality
of the photometry. A second field (field 2) was also observed (332 stars towards
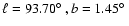 )
for another study, but overlaps some of the SWB interior, and we include the field here. UBV filters with optimal passbands for CCDs
(as determined by Bessel 1990) were used. The low quantum efficiency
of the CCD in the U-band (
)
for another study, but overlaps some of the SWB interior, and we include the field here. UBV filters with optimal passbands for CCDs
(as determined by Bessel 1990) were used. The low quantum efficiency
of the CCD in the U-band (
 nm) limits the faintest
magnitude measured in the sample of stars, and to increase this limit,
an average U-band frame was made from nine separate 600 s integrations.
Each frame was taken at slightly different altitude (and hence airmass),
and we have used the following technique to create a photometrically
accurate single frame from many individual ones.
nm) limits the faintest
magnitude measured in the sample of stars, and to increase this limit,
an average U-band frame was made from nine separate 600 s integrations.
Each frame was taken at slightly different altitude (and hence airmass),
and we have used the following technique to create a photometrically
accurate single frame from many individual ones.
After basic CCD image processing (including removal of cosmic ray strikes
and bad pixels), a uniform background level (in analog-digital units,
or ADU) for each target frame is determined. This level is subtracted
from individual frames. First-order extinction coefficients
 (in units of ADU per unit airmass) for each wavelength are determined
from observations of bright northern standard stars (Oja 1996). Stellar
fluxes in each frame are then corrected to a common airmass X of zero
by multiplying the frame by the factor
(in units of ADU per unit airmass) for each wavelength are determined
from observations of bright northern standard stars (Oja 1996). Stellar
fluxes in each frame are then corrected to a common airmass X of zero
by multiplying the frame by the factor
 .
In this way, the flux is corrected to extra-atmospheric values without
affecting the background, which tends to be mostly due to auroral
skyglow in our location. Each frame is shifted to a common centre,
and a mean image (corrected for atmospheric extinction) is made.
.
In this way, the flux is corrected to extra-atmospheric values without
affecting the background, which tends to be mostly due to auroral
skyglow in our location. Each frame is shifted to a common centre,
and a mean image (corrected for atmospheric extinction) is made.
This technique permits accurate photometry to be obtained for very
faint stars with modest-sized telescopes: the limiting magnitude for
our sample increased to
mV=16.6, compared to a limiting magnitude
of
mV=14.6 using a single 600 s U-band integration. Nine standard
stars from (Oja 1996) were also observed to derive coefficients and
zero-point values for transformation of our magnitudes and colours
to the Johnson system. Two of these stars (early A-type) were also
used as extinction candles, and were observed at varying elevations
throughout the night. Extinction and transformation coefficients were
very well determined: mean absolute differences between the standard stars'
published and measured V, B-V, and U-B values are 0.032, 0.018, and 0.036 mag, respectively. As a further check of the quality of
our photometry we identified 12 stars in field 1 and 24 stars in field 2, present in the Tycho
Catalogue (Høg et al. 2000), as observed by HIPPARCOS. Mean absolute differences
between DevonAO and Tycho photometric values (transformed to Johnson's
system) were 0.11 mag and 0.13 mag in B-V and V respectively (for field 1),
and 0.18 mag and 0.15 mag (field 2).
![\begin{figure}
\par\includegraphics[width=15cm,clip]{0253_f1.ps}
\end{figure}](/articles/aa/full/2004/13/aa0253/img34.gif) |
Figure 1:
A montage of H I channel maps, spanning the LOS velocity
range -76.5 km s
 -81 km s-1. The velocity
separation between channels is 1.5 km s-1, and the image has
been convolved to
-81 km s-1. The velocity
separation between channels is 1.5 km s-1, and the image has
been convolved to
 resolution. The eastern half of the roughly
circular outline of the shell is seen in the first two channels, while
the western half outline is seen better in the last two channels. H I contour
levels (black lines) for the images are from -20 K to 25 K, incremented in 5 K steps. Greyscale values are from -20 K (black) to +20 K (white), with the average value for each channel subtracted first (from
upper left to lower right, 52.9 K, 39.4 K, 27.6 K, and 19.3 K). The 21 cm continuum contour
lines of 3C 434.1 (9 K and 12 K) are shown in white.
resolution. The eastern half of the roughly
circular outline of the shell is seen in the first two channels, while
the western half outline is seen better in the last two channels. H I contour
levels (black lines) for the images are from -20 K to 25 K, incremented in 5 K steps. Greyscale values are from -20 K (black) to +20 K (white), with the average value for each channel subtracted first (from
upper left to lower right, 52.9 K, 39.4 K, 27.6 K, and 19.3 K). The 21 cm continuum contour
lines of 3C 434.1 (9 K and 12 K) are shown in white. |
| Open with DEXTER | |
The U-B versus B-V two-colour diagram was used, along with the reddening
curve
E(U-B)/E(B-V)=0.72+0.05E(B-V) and the optical parameter
RV=AV/E(B-V)=3.1to derive unreddened colour indices. 93 of the 407 field 1 stars have uniquely
determined dereddened colours, as did 83 of the 332 field 2 stars. These
are principally O and B-type spectral
classes. In determining their unreddened colours and distances, we
used the colour index and absolute magnitude MV calibration of
hot stars tabulated in (Cox 2000). Calibration for early-type stars
is more certain than for cooler stars (Gathier et al. 1986), and
less error in distance is introduced by uncertainties of a star's
luminosity class. Nevertheless, one can expect at least 0.3 mag of uncertainty in MV for O and early B type stars
(Russeil 2003). Luminosity Classes (LC) of the stars cannot be firmly determined
with UBV photometry alone, although it is almost certain that the
majority are LCV. For the purposes of finding candidate stars for
association with the shell around 3C 434.1 (see Sect. 5) we assume all
stars are dwarfs.
In Fig. 1, we present a montage of velocity-channel images of neutral
hydrogen towards
,
.
The angular
resolution of each of these maps is 2 arcmin. This
H I is visible as a ring of emission surrounding the SNR's
radio continuum boundary, in H I channel images between -76.5 km s-1 and
-81.0 km s-1, and has the appearance of a fragmented,
roughly circular shell, containing the SNR. The ring's mean thickness
is 2 arcmin (measured from original
 resolution data). The radius of this feature is approximately 21 arcmin, which
is 7 arcmin larger than the radius of the continuum shell of 3C 434.1.
Figure 2 shows this size relationship well with H I emission summed
over three individual channels, centred on -79.5 km s-1.
resolution data). The radius of this feature is approximately 21 arcmin, which
is 7 arcmin larger than the radius of the continuum shell of 3C 434.1.
Figure 2 shows this size relationship well with H I emission summed
over three individual channels, centred on -79.5 km s-1.
Figure 2 shows the bubble's perimeter is fairly well defined around most of its
eastern half. Its curvature is similar to the SNR's eastern boundary, and
the remnant may be interacting with the material of the H I shell in
this region. 3C 434.1 is seen as a shell-type SNR in radio continuum, and
such emission must be produced by interaction with a dense medium, in this
case the inside edge of the H I bubble within which it is evolving.
There is fairly good definition in
the west edge as well especially at -79 km s-1 to -81.0 km s-1,
though the H I shell edge is similarly fragmented. We show in Sect. 4
that this elliptical ring of H I (see Fig. 3) is most likely material accumulated
by an expanding stellar wind bubble (SWB), formed by a cluster of
early type stars (including the SNR's progenitor) and inside which
3C 434.1 is evolving.
![\begin{figure}
\par\includegraphics[width=8.5cm,clip]{0253_f2.ps}
\end{figure}](/articles/aa/full/2004/13/aa0253/img36.gif) |
Figure 2:
Average image of three channel maps at half resolution (
)
from -78 km s-1 to -81 km s-1, with 21 cm continuum contours of
3C 434.1 overlaid. H I line contour levels are from 24 K to 56 K in 4 K
increments, and the greyscale is from 20 K (black) to 40 K (white).
Both Galactic and equatorial (J2000) coordinates are shown. |
| Open with DEXTER | |
The radio source 4C 51.45 (
 ,
,
 )
is seen fortuitously projected atop the northern limb of the SNR's continuum boundary
(as shown by the contours of continuum emission in Figs. 1 and 2. We
find a 21 cm integrated flux density of
)
is seen fortuitously projected atop the northern limb of the SNR's continuum boundary
(as shown by the contours of continuum emission in Figs. 1 and 2. We
find a 21 cm integrated flux density of
 Jy. Its peak continuum brightness temperature (
 K) is higher than the mean brightness temperature of neutral hydrogen
seen surrounding it and it is absorbed by the H I
foreground. This source is projected on the face of the H I
shell approximately 7 arcmin south of the north edge. It can be seen
to be absorbed out to large negative velocities, suggesting it is extragalactic.
For example, the 21 cm H I brightness temperature at the location of
4C 51.45 decreases rapidly, showing that H I absorption is increasing,
in the range of velocities shown in Fig. 1. Its unique location allows us to probe
the structure of the SWB associated with 3C 434.1.
K) is higher than the mean brightness temperature of neutral hydrogen
seen surrounding it and it is absorbed by the H I
foreground. This source is projected on the face of the H I
shell approximately 7 arcmin south of the north edge. It can be seen
to be absorbed out to large negative velocities, suggesting it is extragalactic.
For example, the 21 cm H I brightness temperature at the location of
4C 51.45 decreases rapidly, showing that H I absorption is increasing,
in the range of velocities shown in Fig. 1. Its unique location allows us to probe
the structure of the SWB associated with 3C 434.1.
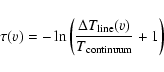
The optical depth of H I in the line of sight (LOS) towards the north edge
of 3C 434.1 is calculated as follows:
 |
(1) |
 and
and
 is the continuum brightness temperature of the un-absorbed source (4C 51.45).
The H I brightness temperature value
is the continuum brightness temperature of the un-absorbed source (4C 51.45).
The H I brightness temperature value
 was calculated in each velocity channel from
the mean emission in a 6 arcmin wide annulus (of inner radius 3 arcmin) centred on 4C 51.45, while
was calculated in each velocity channel from
the mean emission in a 6 arcmin wide annulus (of inner radius 3 arcmin) centred on 4C 51.45, while
 was measured as
the peak brightness temperature at the position of source 4C 51.45.
was measured as
the peak brightness temperature at the position of source 4C 51.45.
H I emission and absorption (
 )
brightness temperature profiles are shown
in Fig. 4, where values of the optical depth (
)
brightness temperature profiles are shown
in Fig. 4, where values of the optical depth ( )
are shown on the right. The extended peak in emission between -35 and
-75 km s-1 is caused by the Perseus Arm.
)
are shown on the right. The extended peak in emission between -35 and
-75 km s-1 is caused by the Perseus Arm.
We believe the small absorption peaks at -70 km s-1 and -96 km s-1are unrelated to large-scale features of Galactic structure, and most likely indicate where the LOS towards 4C 51.45 encounters compressed H I in the back and front edges (respectively) of the aforementioned shell (see Sect. 4.2 below). The absorption peak near -81 km s-1 is likely a cold H I cloud which does not show in emission, but is otherwise in the LOS towards 4C 51.45.
In Fig. 5, a dark area is visible through several channels (centred
on velocity -71 km s-1), and is superimposed onto the brighter
hemisphere of 21 cm synchrotron emission from 3C 434.1. The figure
shows that the radius of the dark area enlarges slightly in the first two velocity
channels, and is constant thereafter with increasing velocity. This
behaviour is what one would expect if the feature were the cap
of an expanding bubble. This dark feature does resemble the eastern half of the
continuum emission in shape. The mean 21 cm continuum
brightness temperature of the SNR's eastern half is 12 K, not enough to
be absorbed by H I in foreground channels, so the dark area cannot be
the absorbed image of the SNR. However, the resemblance is striking enough
to suggest that the SNR shell continuum emission is the result of an interaction
with the far inside edge of the H I shell. In the following
section, we show that this dark feature is most likely the end cap
of the shell, and appears dark because it is absorbing line emission
from a warm H I background behind it.
![\begin{figure}
\par\includegraphics[width=14.5cm,clip]{0253_f3.eps}
\end{figure}](/articles/aa/full/2004/13/aa0253/img45.gif) |
Figure 3:
Three views of the elliptical shell model (thick black ellipses)
fitted to the observed H I emission patterns of the shell, in
( ), ( ), ( ), and (b,v) H I images. The continuum
outline of the supernova remnant is shown (white contour). ), and (b,v) H I images. The continuum
outline of the supernova remnant is shown (white contour). |
| Open with DEXTER | |
Figure 4 shows the absorption profile
 towards 4C 51.45. Using the optical depth of the shell's near edge
(
towards 4C 51.45. Using the optical depth of the shell's near edge
(
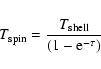
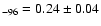 ), one can find the Boltzmann (spin)
temperature of the shell via Eq. (2):
), one can find the Boltzmann (spin)
temperature of the shell via Eq. (2):
 |
(2) |
 is the brightness temperature (above background)
of the shell fragments. We find
is the brightness temperature (above background)
of the shell fragments. We find
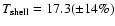 K,
and
K,
and
 K for the ring comprising the shell's
edge seen in Fig. 2 (summed channel map at v=-80 km s-1).
K for the ring comprising the shell's
edge seen in Fig. 2 (summed channel map at v=-80 km s-1).
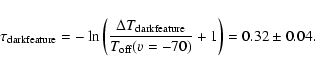
If the dark area near -71 km s-1 in Fig. 5 is to be considered a self-absorbed portion of the SWB shell, two conditions must be met: a) the optical depth of the H I in this far-side cap should be comparable to that measured in the shell's near-side (-96 km s-1), and b) the brightness temperature of the background gas must be much greater than the brightness temperature of gas comprising the shell.
From the brightness temperature of background emission seen at -70 km s-1 (
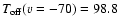 K), and the average value of
 K found from values of
 measured across the dark feature we find:
 |
(3) |
![\begin{figure}
\par\includegraphics[width=8.8cm,clip]{0253_f4.eps}
\end{figure}](/articles/aa/full/2004/13/aa0253/img56.gif) |
Figure 4:
The average H I emission spectrum (thick black line) towards
the SWB surrounding 3C 434.1 is shown, along with the absorption profile
 (thin black line) towards source 4C 51.45
(
,
). The corresponding optical
depth
values are read off the right-hand vertical axis. The
absorption peaks from the front (-96 km s-1) and back
(-70 km s-1) of the H I shell edges are marked with arrows.
(thin black line) towards source 4C 51.45
(
,
). The corresponding optical
depth
values are read off the right-hand vertical axis. The
absorption peaks from the front (-96 km s-1) and back
(-70 km s-1) of the H I shell edges are marked with arrows. |
| Open with DEXTER | |
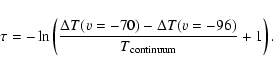
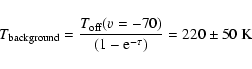
We next separate the component of absorption due to a shell (optical depth similar to -96) at -70 km s-1 from that due to unrelated
material at the same velocity by subtracting the absorption peaks  .
We find an optical depth of
.
We find an optical depth of
 for the remaining
material by:
for the remaining
material by:
 |
(4) |
 |
(5) |
CTB104A and 3C 434.1 are the only supernova remnants known in the Galactic
plane vicinity of
.
Until recently, their distances
have been elusive, as have most supernova remnant distances. Uyaniker et al. (2002)
kinematically determined the distance to CTB104A (G93.7-0.3)
as
 kpc, a reasonable value considering that the kinematic
distance method is probably more valid for local objects than anywhere
else (Foster & Routledge 2003). The large line of sight velocity of the SWB associated with
3C 434.1 (
kpc, a reasonable value considering that the kinematic
distance method is probably more valid for local objects than anywhere
else (Foster & Routledge 2003). The large line of sight velocity of the SWB associated with
3C 434.1 ( -79 km s-1) suggests it is very distant: with R0=8.5 kpc and v0=220 km s-1, a kinematic distance of 10 kpc
follows. This value can almost certainly be dismissed as inaccurate
because of the unreasonable physical parameters indicated for the supernova
remnant (e.g. 80 pc diameter). On the basis of the
-79 km s-1) suggests it is very distant: with R0=8.5 kpc and v0=220 km s-1, a kinematic distance of 10 kpc
follows. This value can almost certainly be dismissed as inaccurate
because of the unreasonable physical parameters indicated for the supernova
remnant (e.g. 80 pc diameter). On the basis of the  -D-z relationship,
Mantovani et al. (1982) find a more reasonable range (3.8-6.4 kpc),
though this highly disputed method overestimates the distance to CTB104A
by nearly a factor of two.
-D-z relationship,
Mantovani et al. (1982) find a more reasonable range (3.8-6.4 kpc),
though this highly disputed method overestimates the distance to CTB104A
by nearly a factor of two.
![\begin{figure}
\par\includegraphics[width=15.5cm,clip]{0253_f5.ps}
\end{figure}](/articles/aa/full/2004/13/aa0253/img64.gif) |
Figure 5:
A montage of H I channel maps, spanning velocities -69.0 km s
-73.5 km s-1, showing the dark area (centred
on
,
 )
described in Sects. 3.1 and
3.2. Resolution and channel separation are the same as in Fig. 1.
The dark area appears within a generally uniform warm H I background,
and is likely cold end-cap material of the shell absorbing this background
emission. Contour levels and greyscale are the same as Fig. 1, with the
following average values subtracted: 96.5 K, 92.2 K, 85.4 K, and 76.9 K. )
described in Sects. 3.1 and
3.2. Resolution and channel separation are the same as in Fig. 1.
The dark area appears within a generally uniform warm H I background,
and is likely cold end-cap material of the shell absorbing this background
emission. Contour levels and greyscale are the same as Fig. 1, with the
following average values subtracted: 96.5 K, 92.2 K, 85.4 K, and 76.9 K. |
| Open with DEXTER | |
The observed LOS velocity of the SWB surrounding 3C 434.1 is within the velocity range occupied by the Perseus Spiral arm as seen in the H I emission spectrum (see Fig. 6), which crudely suggests that the system is at least as far as the centre of the Perseus arm, likely lying on the Arm's far edge. The large line of sight velocity of the system likely includes contributions from non-circular motions (e.g. the Spiral shock, Roberts 1972), and does not accurately reflect the system's circular velocity from Galactic rotation, causing a severe overestimate of the kinematic distance.
To find a non-kinematic distance to our SNR/SWB system, we apply the
new method of Foster & Routledge (2003, hereafter F&R) in the direction
,
.
The method of F&R
begins with a model of the
integrated H I column density versus distance
 (r).
After transforming to velocity space (using a velocity-to-distance
mapping function v(r) with variable parameters), the model is
fitted to the observed cumulative
(v) with a
(r).
After transforming to velocity space (using a velocity-to-distance
mapping function v(r) with variable parameters), the model is
fitted to the observed cumulative
(v) with a  minimization
method. Parameters of both the model
(r) and the mapping
function v(r) are allowed to vary until an acceptable fit is
achieved. The results of this approach are both the model
(r)
and the function v(r) that together best reproduce the observed
distribution
(v). The distance to an individual object
for which a radial velocity is known is then calculated with either
result.
minimization
method. Parameters of both the model
(r) and the mapping
function v(r) are allowed to vary until an acceptable fit is
achieved. The results of this approach are both the model
(r)
and the function v(r) that together best reproduce the observed
distribution
(v). The distance to an individual object
for which a radial velocity is known is then calculated with either
result.
This new technique principally assumes that on a large scale, the observed
line of sight velocity (for atomic hydrogen emission) is increasingly
negative with distance. For H I in emission and in circular
rotation, the assumption that distance is monotonic with velocity
is fundamentally true. However, the presence of HISA near -70 km s-1shows that the warm emission throughout the field is physically behind the
shell. Thus, when calculating the column density
to the SNR/SWB,
integrating emission in all channels to the systemic velocity -80 km s-1
may overestimate the true foreground column. Conversely, integrating only to an upper limit of
v=-70 km s-1; (where the shell begins to appear in velocity space;
see Fig. 3) may
miss some foreground material appearing at greater negative velocities. We
choose our upper limit as an intermediate velocity -75 km s-1, and
believe this reasonably estimates the true foreground column density.
We thus integrate H I emission (shown in Fig. 6) alone to this velocity, and
find the foreground H I column density to 3C 434.1 to be
 cm-2. To the Galactic edge, we find
 cm-2. The
distance to the SNR/SWB that corresponds with
is
cm-2. The
distance to the SNR/SWB that corresponds with
is
 kpc.
Figure 6 shows this distance predicted by the method's output of
cumulative column density as functions of distance and velocity for
this direction. Most of the distance uncertainty derives from
uncertainties in
and
kpc.
Figure 6 shows this distance predicted by the method's output of
cumulative column density as functions of distance and velocity for
this direction. Most of the distance uncertainty derives from
uncertainties in
and
 ).
).
![\begin{figure}
\par\includegraphics[width=8.8cm,clip]{0253_f6.ps}
\end{figure}](/articles/aa/full/2004/13/aa0253/img71.gif) |
Figure 6:
The observed cumulative column density-velocity relation
 (open triangles) towards
,
.
The
fitted model
is also shown (solid line). The distance-velocity
relation v(r) that results from the fit is used to determine the corresponding
heliocentric distance (plotted on the top horizontal axis).
The integration limit
velocity (-75 km s-1) to which we believe all H I emission
between the SWB/SNR and the Sun is foreground
is shown with an arrow. The SWB/SNR distance predicted by the
fitted model (open triangles) towards
,
.
The
fitted model
is also shown (solid line). The distance-velocity
relation v(r) that results from the fit is used to determine the corresponding
heliocentric distance (plotted on the top horizontal axis).
The integration limit
velocity (-75 km s-1) to which we believe all H I emission
between the SWB/SNR and the Sun is foreground
is shown with an arrow. The SWB/SNR distance predicted by the
fitted model
 is is
 kpc. kpc. |
| Open with DEXTER | |
In the ()
image in Fig. 3, a ring of H I emission
is visible surrounding the SNR. This image shows the H I emission summed over four channels
centred on -78.5 km s-1. The H I ring has the appearance
of a fragmented shell, possibly an expanding SWB surrounding the SNR.
We searched for the corresponding elliptical "cross sections''
of such an expanding shell in longitude-velocity and latitude-velocity
images, and the results are shown in the ()
and (b,v)
plots in Fig. 3, respectively.
The (), (), and (b,v) H I emission
patterns seen in Fig. 3 are crudely compatible with a spherical H I
shell of radius 
 centred on (
 ,
1.10
), having a systemic velocity
,
1.10
), having a systemic velocity
 km s-1, and a radial expansion velocity given by half its extent
in velocity, i.e.
km s-1, and a radial expansion velocity given by half its extent
in velocity, i.e.
 km s-1. However, the ()
outline of the H I shell is actually elliptical, and the ()
outline is also slightly skewed. This suggests that rather than being spherical,
the expanding H I shell may in fact be ellipsoidal,
and that the ellipsoid is inclined with respect to our line of sight.
km s-1. However, the ()
outline of the H I shell is actually elliptical, and the ()
outline is also slightly skewed. This suggests that rather than being spherical,
the expanding H I shell may in fact be ellipsoidal,
and that the ellipsoid is inclined with respect to our line of sight.
A simple kinematic model for an expanding ellipsoid was constructed
for the H I shell. The objective of creating the model was
to reproduce the appearance of the (), (), and (b,v) "sections'' through the ellipsoidal shell which are
recognizable in Fig. 3. To minimize the number of free parameters,
the ellipsoid was allowed only two parameters of size: a semimajor
axis a1 and a semiminor axis a2. The ellipsoid is assumed
to have a circular cross-section; the nomenclature implies that it
is prolate, though it could equally well be oblate. The major axis
can be rotated in yaw ( )
and pitch (
)
and pitch ( )
as shown
in Fig. 7. The observer is located on the z-axis; hence Galactic coordinates
)
as shown
in Fig. 7. The observer is located on the z-axis; hence Galactic coordinates  and b correspond to -x and y, respectively. As shown,
positive
yaws the ellipsoid's major axis counterclockwise
as seen from above, while positive
pitches the end of its
major axis upwards which is closest to the observer.
and b correspond to -x and y, respectively. As shown,
positive
yaws the ellipsoid's major axis counterclockwise
as seen from above, while positive
pitches the end of its
major axis upwards which is closest to the observer.
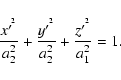
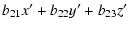
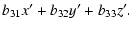
In the kinematic model, a shell of one voxel thickness is created
which occupies all voxels satisfying
 |
(6) |
 |
(7) |
| y | = |  |
|
| = |  |
(8) |
| z | = |  |
|
| = |  |
(9) |
 as the
systemic line-of-sight velocity of the origin of the ellipsoid. The
z-axis points toward the observer, as shown in Fig. 7, but astronomical
convention is that positive velocities are directed away from
the observer; hence the line-of-sight velocities must be negated to
conform to convention.
as the
systemic line-of-sight velocity of the origin of the ellipsoid. The
z-axis points toward the observer, as shown in Fig. 7, but astronomical
convention is that positive velocities are directed away from
the observer; hence the line-of-sight velocities must be negated to
conform to convention.
To create a (b,v) plot, all voxels can be found in which a plane
at x=0 intersects the tilted ellipsoid, with the z-coordinate
of each such voxel (the component of its radius vector projected onto
the z-axis) being proportional to the LOS expansion velocity
of that voxel, relative to
.
For a power-law expansion
 ,
for example, the proportionality relation between radial position
of a voxel and its radial expansion velocity is
,
for example, the proportionality relation between radial position
of a voxel and its radial expansion velocity is
 for any expansion age t.
![\begin{figure}
\par\includegraphics[width=8.2cm,clip]{0253_f7.ps}
\end{figure}](/articles/aa/full/2004/13/aa0253/img87.gif) |
Figure 7:
Sketch of the model H I shell's orientation and
geometry, showing the
viewing angles
and
(defined in Sect. 4.1) and points
of intersection (P1, P2) between the shell and the LOS towards background
continuum source 4C 51.45 (shown by the star symbol). The ellipticity of the
model is exaggerated. |
| Open with DEXTER | |
Similarly, to create an ()
plot, a plane at y=0 intersects
the tilted ellipsoid. To permit the (b,v) and ()
"sections''
through the ellipsoid to be taken at
and b positions which
do not coincide with the origin, however, fixed offsets in x and y respectively are permitted. Thus in the (b,v) plot in
Fig. 3,
 ,
and in the ()
plot
,
and in the ()
plot
 ,
whereas the origin
of the ellipsoid is taken as (
,
whereas the origin
of the ellipsoid is taken as (
 ,
1.123
).
,
1.123
).
In a similar manner, in constructing an ()
plot a plane
at z=0 can intersect the tilted ellipsoid. To allow the line-of-sight
velocity chosen for the ()
plot to differ from
of the ellipsoid, a fixed offset in z is permitted, corresponding
to sliding this plane, which is orthogonal to the line of sight, toward
or away from the observer along the z-axis. Thus in Fig. 3, the ()
"section'' is at v=-78.5 km s-1, whereas
for this modelling process is set to -82 km s-1, corresponding to an offset in zof 7 pc away from the observer using the relation R=tv/n above.
The parameters chosen for the model ellipsoid whose "sections''
are drawn in Fig. 3 are a1=36 pc, a2=29 pc,
 ,
,
 ,
and
,
and
 km s-1. The distance
is assumed to be 5.2 kpc, the origin is taken as (
km s-1. The distance
is assumed to be 5.2 kpc, the origin is taken as (
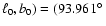
 ) = (93.961
,
1.123
), the exponent n in
is
assumed to be 3/5, and the age t of the expansion is 1.2 Myr. While
likely not unique, this set of parameters reproduces the H I
emission appearance of the shell reasonably well in (),
(), and (b,v), as shown in Fig. 3.
) = (93.961
,
1.123
), the exponent n in
is
assumed to be 3/5, and the age t of the expansion is 1.2 Myr. While
likely not unique, this set of parameters reproduces the H I
emission appearance of the shell reasonably well in (),
(), and (b,v), as shown in Fig. 3.
We are very fortunate in the case of the SWB surrounding 3C 434.1, to find a strong extragalactic continuum source, 4C 51.45, on the same line of sight. The line-of-sight velocities at which H I absorption of this source is produced by the shell of the SWB can now be used to check the parameters for the expanding ellipsoid found above using only H I in emission.
The expanding ellipsoidal shell model introduced in Sect. 4.1 above
is useful for interpreting H I absorption spectra as well
as for producing (), (), and (b,v) "sections''
of an H I shell seen in emission. For an absorption spectrum,
given the position (
 )
of a background
continuum source relative to the origin (
)
of the
ellipsoidal shell, the points P1, P2 in Fig. 7 can be found at which
the line of sight to the source intersects the ellipsoidal shell.
Then the corresponding line-of-sight velocities follow from the z-coordinates
of P1, P2 under the assumption that the expansion velocity of any
voxel in the shell is proportional to its distance from the origin,
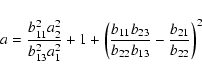
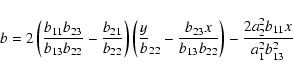
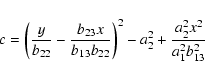
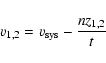
as stated earlier. Using
)
of a background
continuum source relative to the origin (
)
of the
ellipsoidal shell, the points P1, P2 in Fig. 7 can be found at which
the line of sight to the source intersects the ellipsoidal shell.
Then the corresponding line-of-sight velocities follow from the z-coordinates
of P1, P2 under the assumption that the expansion velocity of any
voxel in the shell is proportional to its distance from the origin,
as stated earlier. Using
 )
and
)
and
 )
we find:
)
we find:
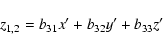 |
(10) |
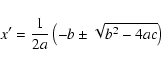 |
(11) |
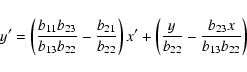 |
(12) |
 |
(13) |
 |
(14) |
 |
(15) |
 |
(16) |
of the ellipsoid:
 |
(17) |
Since 4C 41.45 is located at (
 ,
1.22
)
whereas the origin of the ellipsoid is set to be (
,
1.123
), we enter
,
1.22
)
whereas the origin of the ellipsoid is set to be (
,
1.123
), we enter
 (25 pixels) and
 (16 pixels) in the foregoing. Using the parameters for the SWB deduced
in Sect. 1.1 from the (), (), and (b,v) H I
emission patterns, the expressions above predict that H I
absorption occurring in the ellipsoidal shell should appear at line-of-sight
velocities of -93.8 km s-1 and -70.1 km s-1.
(16 pixels) in the foregoing. Using the parameters for the SWB deduced
in Sect. 1.1 from the (), (), and (b,v) H I
emission patterns, the expressions above predict that H I
absorption occurring in the ellipsoidal shell should appear at line-of-sight
velocities of -93.8 km s-1 and -70.1 km s-1.
Figure 4 shows the observed H I absorption profile towards 4C 51.45,
and in it we see a weak absorption peak near -96 km s-1 and
another peak near -70 km s-1. Thus the absorption features seen
in the 4C 51.45 H I absorption profile do substantiate
the values found for the SWB parameters in the previous H I
emission analysis. An important physical result from this kinematic
analysis is the expansion velocity (along the degenerate minor axes
of the ellipsoid):
 km s-1.
Table 1: Observed and calculated physical and dynamical characteristics of the ellipsoidal stellar wind bubble surrounding 3C 434.1.
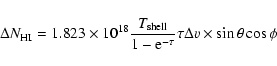
The differential column density of the shell wall measured at the
position of 4C 51.45, and adjusted for path length is:
 |
(18) |
is the brightness temperature (above background)
of the shell (from Sect. 3.2, 17.3 K), and  (50
)
and (9.6
)
are the angular locations (in spherical polar coordinates) of
the 4C 51.45 absorption feature on the surface of the shell, assumed
a sphere for this estimate. Integrating across the velocity
width of the -line centred on -96 km s-1
(see Fig. 4),
we find
(50
)
and (9.6
)
are the angular locations (in spherical polar coordinates) of
the 4C 51.45 absorption feature on the surface of the shell, assumed
a sphere for this estimate. Integrating across the velocity
width of the -line centred on -96 km s-1
(see Fig. 4),
we find
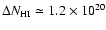 cm-2. This is
taken as representative of the typical column density through the
shell normal to its surface. Assuming a uniform thickness of
and the elliptical shape for the shell modelled in the previous section,
the mean density of swept-up neutral hydrogen within the shell is
cm-2. This is
taken as representative of the typical column density through the
shell normal to its surface. Assuming a uniform thickness of
and the elliptical shape for the shell modelled in the previous section,
the mean density of swept-up neutral hydrogen within the shell is
 cm-3. We thus infer that the environment into
which the bubble expanded had an original ambient density of
cm-3. We thus infer that the environment into
which the bubble expanded had an original ambient density of
 cm-3, a typical value for the interstellar medium within a spiral arm undisturbed
by massive stars. The mass of material swept up in the shell is 14 500
cm-3, a typical value for the interstellar medium within a spiral arm undisturbed
by massive stars. The mass of material swept up in the shell is 14 500
 ,
(accounting for 9% helium abundance by number in the surroundings),
and the kinetic energy of the shell
,
(accounting for 9% helium abundance by number in the surroundings),
and the kinetic energy of the shell
 erg.
Table 1 lists these and other physical characteristics of the shell.
The observed size and expansion rate of our H I bubble suggests
it has certainly evolved beyond the first stage of bubble evolution
(free expansion), and is likely well into the second, longest-lasting
phase of evolution (the energy-driven phase) where the formation of
a thin cold outer shell is expected due to minor radiative losses at the
shell periphery.
erg.
Table 1 lists these and other physical characteristics of the shell.
The observed size and expansion rate of our H I bubble suggests
it has certainly evolved beyond the first stage of bubble evolution
(free expansion), and is likely well into the second, longest-lasting
phase of evolution (the energy-driven phase) where the formation of
a thin cold outer shell is expected due to minor radiative losses at the
shell periphery.
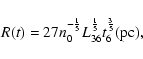
The following
equation governs the evolution of a typical energy-conserving interstellar
bubble ( Eq. (51), Weaver et al. 1977) with no losses:
 |
(19) |
 )
responsible for the shell's formation
(in units of 1036 erg s-1), and t6 is the time (106 yr).
Accounting for radiative loss produces an analytically intractable equation.
Weaver et al. (1977) numerically simulate the evolution of a bubble accounting
for radiative loss, and find that R(t) evolves as a power law with
exponent 0.58, intermediate between Eq. (19) and the law
)
responsible for the shell's formation
(in units of 1036 erg s-1), and t6 is the time (106 yr).
Accounting for radiative loss produces an analytically intractable equation.
Weaver et al. (1977) numerically simulate the evolution of a bubble accounting
for radiative loss, and find that R(t) evolves as a power law with
exponent 0.58, intermediate between Eq. (19) and the law
 of Steigman et al. (1975). Koo & McKee (1992) find a similar solution
for a partially radiative bubble, for which the shell radius will
expand with a power law of index 4/7. One can see that partial radiative
losses affect the time evolution of a bubble in only a small way. Therefore,
in estimating parameters for our SWB, we retain the use of Weaver et al.'s analytic evolutionary equation
(Eq. (19)) for the analysis. The dynamical age of the bubble is calculable
by combining R(t) with its first derivative:
of Steigman et al. (1975). Koo & McKee (1992) find a similar solution
for a partially radiative bubble, for which the shell radius will
expand with a power law of index 4/7. One can see that partial radiative
losses affect the time evolution of a bubble in only a small way. Therefore,
in estimating parameters for our SWB, we retain the use of Weaver et al.'s analytic evolutionary equation
(Eq. (19)) for the analysis. The dynamical age of the bubble is calculable
by combining R(t) with its first derivative:
 .
With R=34 pc and
.
With R=34 pc and
 km s-1 we find
 yr, agreeing reasonably well with the estimate of 1.2 Myr from Sect. 4.1.
We assume the SWB was created by the progenitor and other O and B stars of the same
cluster, and therefore the age of the SWB must be at least equal to the
main-sequence lifetime of the progenitor star (assuming the age of the SNR
itself is negligible). Since there is no massive star
with such a short lifetime (1.4 Myr), an apparent conflict exists between the dynamical
age of the bubble and the age of the SNR progenitor. Conflicts
between kinematic and evolutionary ages of stellar wind bubbles have
been observed by numerous authors (e.g. Cazzolato & Pineault 2003; Cappa et al. 2002)
and the puzzle is highlighted in the review of
Garmany (1994), who states the discrepancy is often by a factor of 2. This is similar to the uncertainty that lies within the non-radiative
stellar wind bubble solutions of Weaver et al. (1977). Explanations
such as noncoeval star formation have been proposed (Saken et al. 1992),
but cannot be proven here. We must believe that the
true age of our system is likely much greater than 1.4 Myr, possibly
up to 2.8 Myr. A plausible age nearer to this upper limit is supported
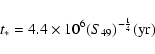
by the discovery of an O4V type star within our bubble (see Sect. 5). The
main-sequence lifetime given by Chiosi et al. (1978):
 |
(20) |
in Schaerer & de Koter (1997),
who show evolutionary models for O4V stars from 60
(3.4 Myr) to
85
(1.7 Myr).
Simultaneously in solving for the SWB age t, we solve for the wind luminosity
of the enclosed star(s). At the minimum age of the system (1.4 Myr),
 erg s-1, and at the maximum (2.6 Myr),
 erg s-1. Assuming a constant wind luminosity over the bubble's minimum
lifetime, the energy imparted to the SWB's expansion is
erg s-1. Assuming a constant wind luminosity over the bubble's minimum
lifetime, the energy imparted to the SWB's expansion is
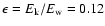 times the total energy output (
 ergs).
This efficiency is 0.07 if the bubble is considered as old as the 2.6 Myr main sequence lifetime of the O star we find within it.
ergs).
This efficiency is 0.07 if the bubble is considered as old as the 2.6 Myr main sequence lifetime of the O star we find within it.
 and mass-loss rate (
 yr-1)
as
yr-1)
as
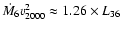 (where we define
 km s-1). From the above wind luminosity one calculates
 .
Following McKee et al. (1984), the characteristic wind luminosity
for a bubble formed in a medium with density n0 is:
.
Following McKee et al. (1984), the characteristic wind luminosity
for a bubble formed in a medium with density n0 is:
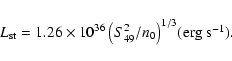 |
(21) |
20%) photons per second (Abbot 1982; Panagia 1973), and
if the star(s) that formed our SWB are similar, then S49=3. McKee et al. (1984) also define the dimensionless wind
luminosity
 as a gauge of the relative
strength of the outflow. The minimum age of the bubble (1.4 Myr) gives
as a gauge of the relative
strength of the outflow. The minimum age of the bubble (1.4 Myr) gives
 ,
while at the bubble's plausible age of 2.6 Myr,
we find
,
while at the bubble's plausible age of 2.6 Myr,
we find
 indicating a weak outflow, and that the
wind-blown cold H I shell is likely filled with the hot wind
of the resident stars. Thus cool shell material is evaporating and
mixing with the internal hot wind, reducing the pressure caused by
the wind and slowing the shell's expansion. It is probable that the
H I shell's expansion has slowed due in part to such
cooling, and its exterior is beginning to fragment, consistent with
its current appearance.
indicating a weak outflow, and that the
wind-blown cold H I shell is likely filled with the hot wind
of the resident stars. Thus cool shell material is evaporating and
mixing with the internal hot wind, reducing the pressure caused by
the wind and slowing the shell's expansion. It is probable that the
H I shell's expansion has slowed due in part to such
cooling, and its exterior is beginning to fragment, consistent with
its current appearance.
Table 2:
Comparison of observed SWB parameters to those calculated from a simple
time-evolution model of a SWB formed by the wind of a single O5.5V
star, chosen to match the observed wind luminosity
at the
minimum age of the bubble (t=1.4 Myr). Model is from McKee et al. (1984).
The stall
velocity and age for the bubble are near the lower and upper limits
of those same parameters as measured, respectively. The stall radius
is 30% larger than the observed radius, but is within uncertainties.
The SWB surrounding 3C 434.1 is apparently in its early stages of dissipation.
Using the equations of McKee et al. (1984) we have calculated a simple
time history model of a SWB blown by a single star, into a medium
with n0=5 cm-3. A single O5.5V star is used, as the wind
luminosity of such a star (
L36=3.5) is the closest match to the
wind luminosity of the bubble found in Sect. 4.3 at its minimum age (
L36=5.1). In our
model, the O5.5V star's entire mechanical energy output contributes to the
formation of the bubble, whereas in reality the energy conversion efficiency
is 20% or less (Koo & McKee 1992).
The characteristic wind luminosity of the system at time t=0is
 ,
closely matching the value calculated for our
bubble at its minimum age (
). The radius,
velocity and age are found at which the bubble stalls, and are where
pressure between the bubble's interior is balanced by the confinement
pressure of the photoionized hydrogen surrounding the bubble. The
bubble also becomes radiative at this point. Table 2 shows that the
model bubble stalls when it reaches t=2.6 Myr, at a radius of 50
(10) pc, within the uncertainty of our elliptical model's mean
radius (
,
closely matching the value calculated for our
bubble at its minimum age (
). The radius,
velocity and age are found at which the bubble stalls, and are where
pressure between the bubble's interior is balanced by the confinement
pressure of the photoionized hydrogen surrounding the bubble. The
bubble also becomes radiative at this point. Table 2 shows that the
model bubble stalls when it reaches t=2.6 Myr, at a radius of 50
(10) pc, within the uncertainty of our elliptical model's mean
radius ( pc). The stall velocity of 11.4 km s-1 is
very nearly that calculated for the ellipsoidal model (14 km s-1 in
Sect. 4.2). Considering the fragmented appearance we observe
our SWB to have, the above simple model suggests that it is certainly
highly evolved, and has certainly reached the last stages of Phase II.
The rate of expansion due to momentum conservation has slowed to nearly
the sound speed of the unperturbed medium,
and the SWB's dissipation in the ISM has begun. For a "standard'' bubble
( n0=1 cm-3,
L36=1.3, Weaver et al. 1977) the dissipation
time is approximately given by the main-sequence lifetime of the star,
in this case
pc). The stall velocity of 11.4 km s-1 is
very nearly that calculated for the ellipsoidal model (14 km s-1 in
Sect. 4.2). Considering the fragmented appearance we observe
our SWB to have, the above simple model suggests that it is certainly
highly evolved, and has certainly reached the last stages of Phase II.
The rate of expansion due to momentum conservation has slowed to nearly
the sound speed of the unperturbed medium,
and the SWB's dissipation in the ISM has begun. For a "standard'' bubble
( n0=1 cm-3,
L36=1.3, Weaver et al. 1977) the dissipation
time is approximately given by the main-sequence lifetime of the star,
in this case
 yr. We are thus likely viewing
the last period of this bubble's identity within the ISM.
yr. We are thus likely viewing
the last period of this bubble's identity within the ISM.
![\begin{figure}
\par\includegraphics[width=12cm,clip]{0253_f8.ps}
\end{figure}](/articles/aa/full/2004/13/aa0253/img157.gif) |
Figure 8:
A composite optical, radio continuum and H I line image,
showing V-band optical images of the sky within the contoured H I
line image of the stellar wind bubble. Each optical field of view is
 (that of the Devon Astronomical Observatory telescope).
Only part of field 2 (upper right) overlaps the
bubble, while field 1 is fully within it. The four stars identified as residents
of the SWB (see Sect. 5) are circled. The three B0V stars are seen
at left, while the O4V star is very nearly centred within the H I
bubble. The continuum contours of 3C 434.1 are also drawn, showing
the SNR's relation to the SWB and the stars responsible for its formation.
Coordinates on axes are
(that of the Devon Astronomical Observatory telescope).
Only part of field 2 (upper right) overlaps the
bubble, while field 1 is fully within it. The four stars identified as residents
of the SWB (see Sect. 5) are circled. The three B0V stars are seen
at left, while the O4V star is very nearly centred within the H I
bubble. The continuum contours of 3C 434.1 are also drawn, showing
the SNR's relation to the SWB and the stars responsible for its formation.
Coordinates on axes are
 . . |
| Open with DEXTER | |
An observational bias of overweighting luminous objects will afflict
a magnitude-limited sample of stars, especially out to great distances.
This Malmquist bias will affect our observations, which therefore will
reveal only the most massive and brightest stars at the distance of
the SNR/SWB (5.2 kpc). This bias is pushed further towards luminous
stars by the large total extinction AV suffered by radiation (see
below). On the other hand,
the patchiness of interstellar extinction (Boyle et al. 1992, the effects of which have
been found on scales down to 30 square arcmin by)
makes it likely that many stars within our 730 square arcmin
fields will be observed through transparent "windows'' in the
dust column (or conversely through dust screens). These effects, coupled
with uncertainties in absolute magnitude MV calibration (at
least 0.3 mag, or 15% distance uncertainty) mean that a wide
range of stars could be considered as possible candidates for association
with the SWB. We quantify the selection criteria as follows.
First, we estimate the mean extinction to the SWB by measuring the
hydrogen column density in the foreground. We express this column
in visual magnitudes using the gas to dust ratio of Predehl & Schmitt (1995),
 cm-2 mag-1.
From H I in emission, the column density from Sect. 3.3 amounts
to 6 mag of extinction. This is likely a lower limit as H I
within the entire column may not all be optically thin, a fact illustrated
by the higher extinction found using the absorption profile towards
4C 51.45, which shows an H I column amounting to at least 7 mag of foreground extinction. This optically thick H I
may not be uniformly distributed over the observed field and distance
column, so a mean extinction of 6.5 mag to the SNR/SWB is adopted,
equivalent to a reddening of
cm-2 mag-1.
From H I in emission, the column density from Sect. 3.3 amounts
to 6 mag of extinction. This is likely a lower limit as H I
within the entire column may not all be optically thin, a fact illustrated
by the higher extinction found using the absorption profile towards
4C 51.45, which shows an H I column amounting to at least 7 mag of foreground extinction. This optically thick H I
may not be uniformly distributed over the observed field and distance
column, so a mean extinction of 6.5 mag to the SNR/SWB is adopted,
equivalent to a reddening of
 mag. We conservatively
estimate the variation in E(B-V) across the observed field 1
by calculating the standard deviation
mag. We conservatively
estimate the variation in E(B-V) across the observed field 1
by calculating the standard deviation
 of reddenings
for all stars in distance bins 250 pc wide, out to 2.5 kpc. A total
reddening scatter of
of reddenings
for all stars in distance bins 250 pc wide, out to 2.5 kpc. A total
reddening scatter of
 mag is calculated
in this manner. Since our photometric error is small (see Sect. 2.2),
this scatter is likely due to the irregular distribution of local
dust across the field.
mag is calculated
in this manner. Since our photometric error is small (see Sect. 2.2),
this scatter is likely due to the irregular distribution of local
dust across the field.
Thus stars for which E(B-V) falls within
 mag, and
distance d within
mag, and
distance d within
 kpc are considered candidates.
For the given extinction (
kpc are considered candidates.
For the given extinction (
 mag) and distance,
the expected minimum stellar type that could be detected in our magnitude-limited
sample (
mV=16.6 mag) is B1V (
MV=-3.2 mag). At the edge
of the uncertainties, we may find stars down to B2.5V (
MV=-2.0 mag).
mag) and distance,
the expected minimum stellar type that could be detected in our magnitude-limited
sample (
mV=16.6 mag) is B1V (
MV=-3.2 mag). At the edge
of the uncertainties, we may find stars down to B2.5V (
MV=-2.0 mag).
Table 3:
Eleven stars towards 3C 434.1 with observed reddenings
that are consistent
with that observed toward the SNR/SWB (
E(B-V)=2.1 mag), i.e.
 mag. The uncertainty in the assigned spectral type is on average plus or
minus one sub-type (e.g. an O5 is O4-O6 within uncertainty). Distances
are calculated using reddening law
RV=AV/E(B-V)=3.1. All distances
have an uncertainty of 30%.
mag. The uncertainty in the assigned spectral type is on average plus or
minus one sub-type (e.g. an O5 is O4-O6 within uncertainty). Distances
are calculated using reddening law
RV=AV/E(B-V)=3.1. All distances
have an uncertainty of 30%.
Of the 100 or so classified O and B stars seen towards the interior of the SWB, only 12 have reddenings
 mag or greater. If we assume all are main sequence
stars, then eleven remain for which
mag or greater. If we assume all are main sequence
stars, then eleven remain for which
 kpc.
Table 3 lists the characteristics of these stars, and
shows their photometric
distances (assuming a common luminosity class of V). Three B0V stars
have distances and reddenings that are very consistent with the SWB:
Stars 1, 4, and 10 are the most likely residents. The O4-type Star
7 also has a very consistent distance and reddening. Much less certain
and barely within the distance uncertainties is Star 2 and other stars
fall short of being solid candidates. We can comfortably conclude that
only Stars 1, 4, 7 and 10 are candidates for association with the
SWB surrounding 3C 434.1. Figure 8 shows the positions of these stars
(circled) within the SWB, and with respect to the radio continuum appearance
of 3C 434.1. The wind-dominant O4V star is found very nearly in the centre
of the bubble. There are no stars in field 2 that match the selection
criteria.
kpc.
Table 3 lists the characteristics of these stars, and
shows their photometric
distances (assuming a common luminosity class of V). Three B0V stars
have distances and reddenings that are very consistent with the SWB:
Stars 1, 4, and 10 are the most likely residents. The O4-type Star
7 also has a very consistent distance and reddening. Much less certain
and barely within the distance uncertainties is Star 2 and other stars
fall short of being solid candidates. We can comfortably conclude that
only Stars 1, 4, 7 and 10 are candidates for association with the
SWB surrounding 3C 434.1. Figure 8 shows the positions of these stars
(circled) within the SWB, and with respect to the radio continuum appearance
of 3C 434.1. The wind-dominant O4V star is found very nearly in the centre
of the bubble. There are no stars in field 2 that match the selection
criteria.
Table 4:
Four stars from Table 3 with photometric distances and reddenings
consistent with the SWB around 3C 434.1. Sources of the physical values
 ,
luminosity, mass and effective temperature
are from Schaerer & de Koter (1997).
,
luminosity, mass and effective temperature
are from Schaerer & de Koter (1997).
We now consider whether the observed wind luminosity and energy requirements
of the bubble are met by the winds of the observed candidate stars.
For our analysis, we use terminal wind velocities and mass loss rates from
the models of Schaerer & de Koter (1997). The adopted parameters are listed in
Table 4, and it is seen that the integrated wind luminosity of the
observed stars is
 ,
accounting for 50%
of the wind luminosity sustaining the bubble at age 1.4 Myr
(
,
accounting for 50%
of the wind luminosity sustaining the bubble at age 1.4 Myr
(
 ). This is predominantly from the O4V star.
That there are no other stars observed within this SWB
with outputs significant enough to affect the bubble's evolution is likely,
considering that B0V stars are the latest type observed
here, and these are seen in Table 4 to have an almost negligible contribution
to the wind luminosity
 .
The missing
wind luminosity gives us an estimate of the latest stellar type for
the progenitor of SNR 3C 434.1. Another O4V star would bring the total
internal wind luminosity up to
.
The missing
wind luminosity gives us an estimate of the latest stellar type for
the progenitor of SNR 3C 434.1. Another O4V star would bring the total
internal wind luminosity up to
 ,
and
such a star has a main-sequence lifetime consistent with the upper-limit
estimate of the bubble's age (2.6 Myr). The progenitor
may even have been of an earlier spectral type than this, but should
not have been much cooler, as such a star would have outlived the
currently observed O4V star within the bubble. This suggests it is
probable that SNR 3C 434.1 marks the first supernova event to occur
within this bubble, and the explosion was of type Ib or Ic.
,
and
such a star has a main-sequence lifetime consistent with the upper-limit
estimate of the bubble's age (2.6 Myr). The progenitor
may even have been of an earlier spectral type than this, but should
not have been much cooler, as such a star would have outlived the
currently observed O4V star within the bubble. This suggests it is
probable that SNR 3C 434.1 marks the first supernova event to occur
within this bubble, and the explosion was of type Ib or Ic.
Figure 8 shows that there is 30% (by area) of the SWB's interior not covered in the optical observations. It is very unlikely that other powerful stars related to the SWB lurk in these peripheral unobserved regions, as their winds would have certainly distorted the elliptical outline of the bubble (see Fig. 3).
kpc), and we confirm
what its tattered appearance and low expansion velocity (14 km s-1)
suggest: it is an old stellar wind bubble which has hosted only 1 supernova
event, and is now beginning to dissipate in the ISM. Much of the shell is
comprised of cool (80 K) H I gas, and it is concluded that
the far end cap (seen as a dark area amidst a bright emission field) is
absorbing emission from a warm uniform background of H I emission. We develop a
geometric model of this bubble in three dimensions, and fit it to the
bubble's appearance in velocity space.
Acknowledgements
The authors would like to thank Tom Landecker (DRAO) for his thoughtful comments on our manuscript. The Dominion Radio Astrophysical Observatory is operated as a national facility by the National Research Council of Canada. The Canadian Galactic Plane Survey is a Canadian project with international partners, and is supported by a grant from the Natural Sciences and Engineering Research Council of Canada (NSERC). This work has been supported by NSERC operating grants to T. Landecker, D. Routledge, D. Hube, and S. Morsink. T. Foster has been supported by an NSERC Graduate Scholarship.