| |
Figure 1:
Observational constraints in the HR diagram for |
| Open with DEXTER | |
In the text
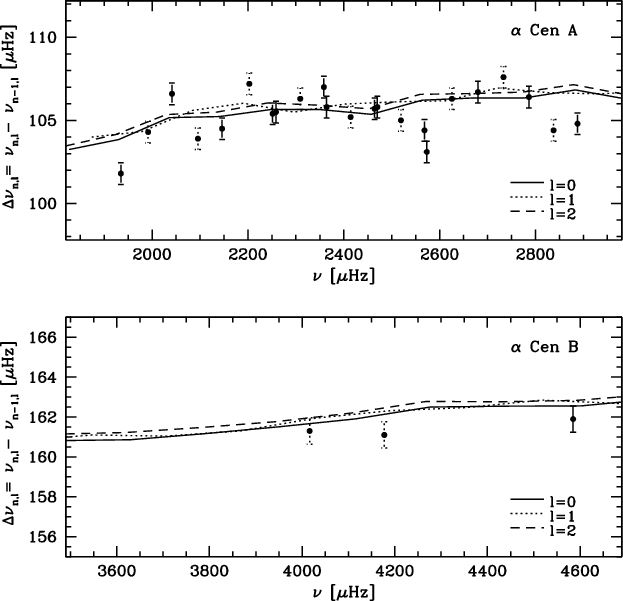 |
Figure 2:
Large spacing versus frequency for |
| Open with DEXTER | |
In the text
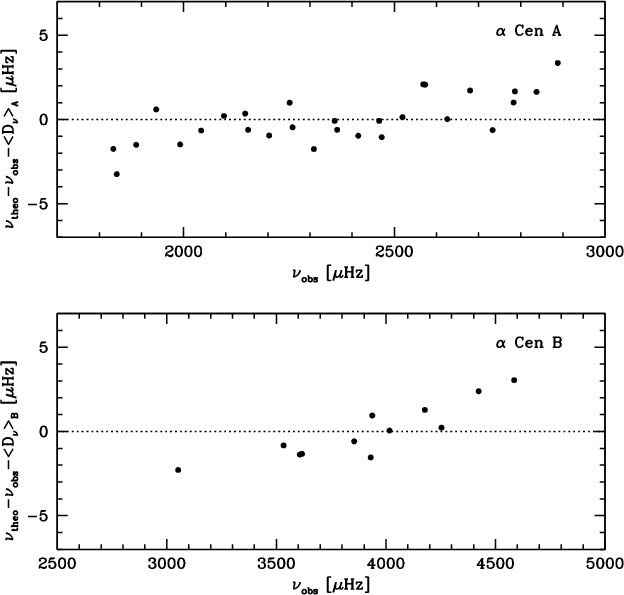 |
Figure 3:
Differences between calculated and observed frequencies for the model with 1-sigma error boxes on the observed radii (model M1).
The systematic shifts for |
| Open with DEXTER | |
In the text
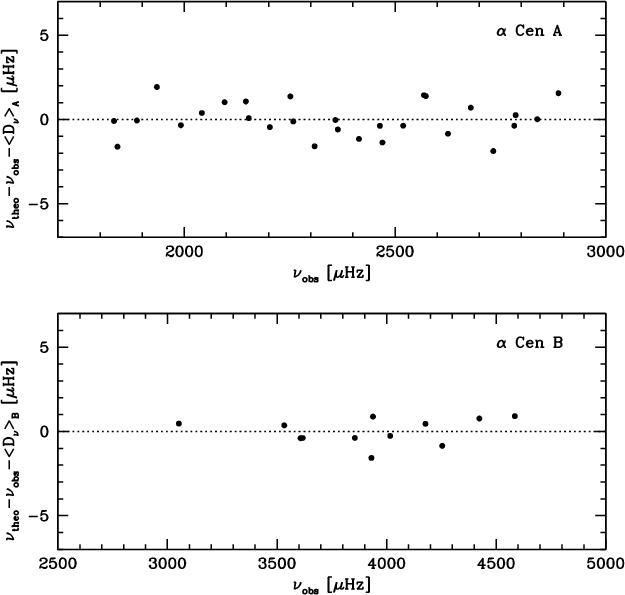 |
Figure 4:
Differences between calculated and observed frequencies for the model with 2-sigma error boxes on the observed radii (model M2).
The systematic shifts between theoretical and observed frequencies for |
| Open with DEXTER | |
In the text
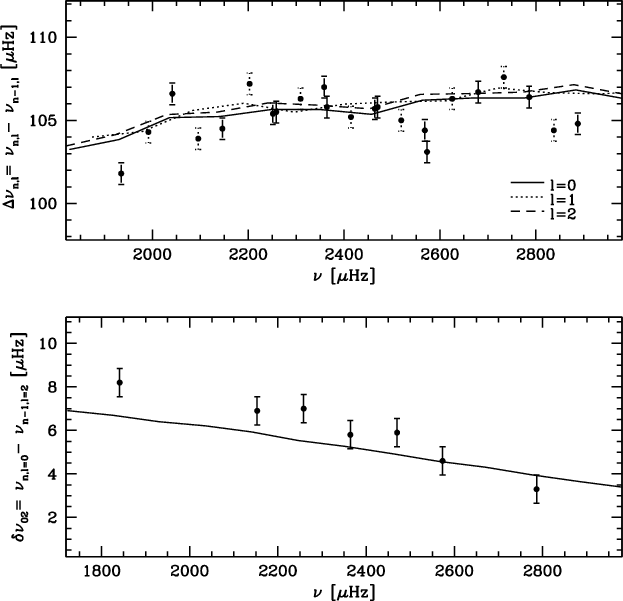 |
Figure 5:
Large and small spacings versus frequency for |
| Open with DEXTER | |
In the text
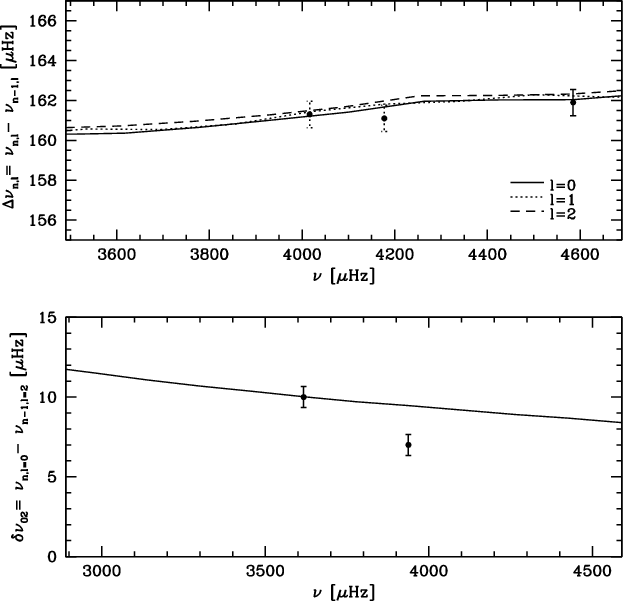 |
Figure 6:
Large and small spacings versus frequency for |
| Open with DEXTER | |
In the text
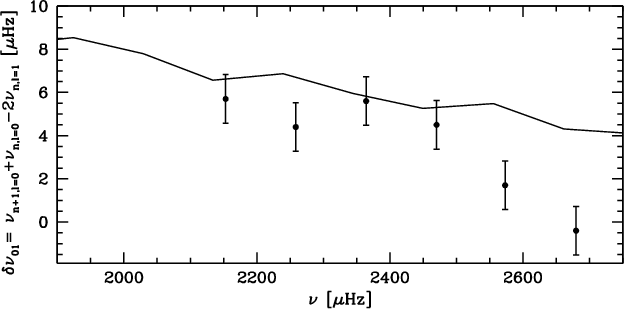 |
Figure 7:
|
| Open with DEXTER | |
In the text
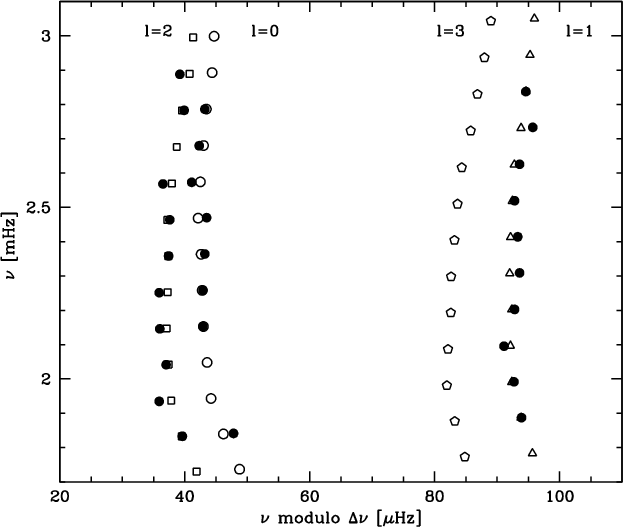 |
Figure 8:
Echelle diagram of |
| Open with DEXTER | |
In the text
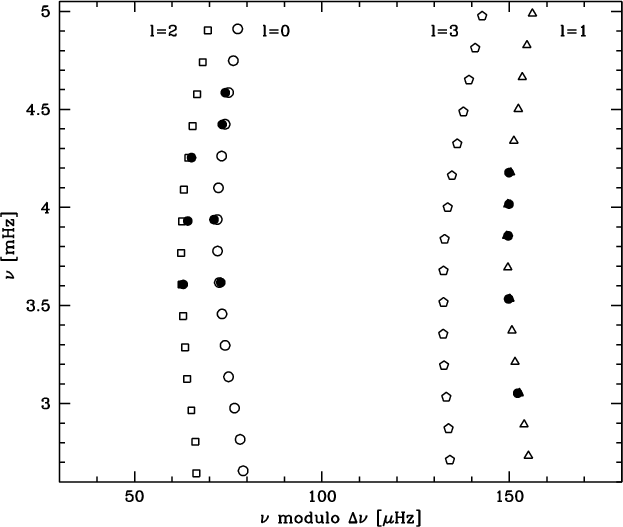 |
Figure 9:
Echelle diagram of |
| Open with DEXTER | |
In the text