![[*]](/icons/foot_motif.gif)
A&A 416, 251-262 (2004)
DOI: 10.1051/0004-6361:20031714
O. Marggraf - H. Bluhm - K. S. de Boer
Sternwarte der Universität Bonn, Auf dem Hügel 71, 53121 Bonn, Germany
Received 16 June 2003 / Accepted 2 December 2003
Abstract
The FUSE far-ultraviolet interstellar spectra toward seven targets in
NGC 6231 show that the molecules H2, HD, and CO as well as various
atomic species are distributed in several clouds.
The main absorption component found on the sight lines lies in the Lupus cloud
region at a distance of about 150 pc, and there is a weaker second one,
presumably in the Sco OB1 shell surrounding NGC 6231
(
 kpc).
H2 excitation modelling is used to constrain the radiation field and the
density in the gas;
HD is used to estimate the abundance of H+.
The small angular separation of the target stars allows column density
variations to be probed over the field of view, on scales of 0.05 pc in the
case of the Lupus cloud distance.
They are
kpc).
H2 excitation modelling is used to constrain the radiation field and the
density in the gas;
HD is used to estimate the abundance of H+.
The small angular separation of the target stars allows column density
variations to be probed over the field of view, on scales of 0.05 pc in the
case of the Lupus cloud distance.
They are  for H2 and
  for H I.
A rather strong radiation field inside the molecular clouds suggests a
separation of the gas into smaller cloudlets also along the line of sight.
for H I.
A rather strong radiation field inside the molecular clouds suggests a
separation of the gas into smaller cloudlets also along the line of sight.
Key words: ISM: structure - ISM: molecules - ISM: abundances - structure - ultraviolet: ISM
When observing the interstellar medium (ISM) using absorption line spectroscopy, one has to live with the restriction that the data gives just pencil beam information along single lines of sight towards selected background sources. Absorption line analysis will never provide as wealthy structural information as the analysis of emission lines or imaging.
However, one can get closer to this goal by choosing groups of close together background sources, in this way enlarging the information density per angular element.
Open star clusters, rich in young UV bright background sources, play an
important role in such projects when dealing with far-UV (FUV) absorption line
spectroscopy of the ISM.
In particular, the open cluster NGC 6231 in the
Sco OB1 association provides at least seven early-type stars in its
central region which are suitable as background sources for FUV spectroscopy,
and it still shows moderate extinction in this wavelength region for a far-away
object in the Milky Way disk.
The cluster is located in the Galactic plane (
 ,
,
 ),
at a distance of
),
at a distance of  1.8 kpc (Raboud et al. 1997).
The E(B-V) values for its stars vary between 0.43 and 0.46 mag
(Baume et al. 1999, see Table 1).
1.8 kpc (Raboud et al. 1997).
The E(B-V) values for its stars vary between 0.43 and 0.46 mag
(Baume et al. 1999, see Table 1).
We will analyse the sight lines towards these seven background sources
with respect to absorption by the Galactic interstellar medium, paying
particular attention to the variation in the physical parameters of the gas
over small angular scales.
The background sources span a total area of
 .
At the distance of the cluster this means a linear extent of the gas
of about 3.0 pc
.
At the distance of the cluster this means a linear extent of the gas
of about 3.0 pc
 pc.
Part of the absorbing gas will very probably be located more nearby, resulting
in an even higher spatial resolution.
pc.
Part of the absorbing gas will very probably be located more nearby, resulting
in an even higher spatial resolution.
The spectral range of the FUSE instrument covers the Lyman and Werner bands
of molecular hydrogen H2 and of deuterated hydrogen HD, the
H I Lyman series from Ly  on bluewards, the CO E-X band,
and various metals.
We are thus able to derive physical parameters for the gas like excitation
temperatures and densities from excitation and column density ratios.
Section 2 introduces the data themselves and the analysis methods
used;
Sect. 3 gives an overview of the results and a
discussion of their reliability.
Section 4 contains the interpretation, followed by
concluding remarks in Sect. 5.
on bluewards, the CO E-X band,
and various metals.
We are thus able to derive physical parameters for the gas like excitation
temperatures and densities from excitation and column density ratios.
Section 2 introduces the data themselves and the analysis methods
used;
Sect. 3 gives an overview of the results and a
discussion of their reliability.
Section 4 contains the interpretation, followed by
concluding remarks in Sect. 5.
Table 1: List of the targets and observational parameters. The spectrum of HD 152270 was observed in 5 separate pointings, thus no unique ID is given. The E(B-V) values are from Baume et al. (1999).
The FUSE instrument consists of four coaligned telescopes with Rowland
spectrographs and two microchannel plate detectors.
The spectral range of operation is between 905 and 1187 Å, at a resolution
of about
 or 20 km s-1 (FWHM).
An extended overview of the instrumentation and the on-orbit performance of the
satellite is found in Moos et al. (2000) and in Sahnow et al. (2000).
or 20 km s-1 (FWHM).
An extended overview of the instrumentation and the on-orbit performance of the
satellite is found in Moos et al. (2000) and in Sahnow et al. (2000).
![\begin{figure}
\par\includegraphics[width=8.8cm,clip]{h4600f1.ps}
\end{figure}](/articles/aa/full/2004/10/aah4600/img17.gif) |
Figure 1:
Positions of the target stars. The background shows the
60  IRAS emission map (see intensity scale at right).
 |
| Open with DEXTER | |
The open cluster NGC 6231 was selected as a target with the
criteria in mind of
a) a cluster with a number of hot early type stars (earlier than about B3, see Table 1) providing clean UV
continua without perturbing stellar atmospheric absorption and b) a moderate colour excess so that the UV flux is not diminished
by a too strong interstellar grain absorption.
Table 1 lists the FUSE targets and the observational
parameters.
As an additional benefit the individual background sources are all separated
by at least
 ,
thus we are able to use the large LWRS aperture (
,
thus we are able to use the large LWRS aperture (
 )
for observation.
The separation is large enough to assure that always only one UV bright star
is located within the aperture.
A map of the NGC 6231 region and the locations of the FUSE targets
is given in Fig. 1.
)
for observation.
The separation is large enough to assure that always only one UV bright star
is located within the aperture.
A map of the NGC 6231 region and the locations of the FUSE targets
is given in Fig. 1.
We use the CalFUSE standard reduction package (version 2.0.5) for the basic data reduction and calibration. The different exposures for each target are cross correlated and coadded for each detector channel. The coadded spectra are then rebinned to a binsize of 4, which results in a resolution of 0.028 Å per bin (or 8.4 km s-1 at 1000 Å), still well below the instrument's spectral resolution.
![\begin{figure}
\par\includegraphics[width=18cm,clip]{h4600f2.ps}
\end{figure}](/articles/aa/full/2004/10/aah4600/img20.gif) |
Figure 2:
Absorption lines from the seven target star spectra.
The sample portions are binned (to 8.4 km s-1),
but not normalised to a continuum.
The Ar I line at 1048 Å is located in the left wing of
a strong H2 absorption feature.
Stellar wind features affect the continuum in the WR star
HD 152270.
For some sight lines (HD 152249, HD 152270,
HD 326329) a second blueward velocity component is
clearly visible, while it is much weaker in the others.
The dashes above the spectra mark the positions of the main
velocity component at -8 km s-1 and of the weaker
second component at -40 km s-1.
At the left end of the box of the N I line the transition of
N I (1134.4 Å) can be seen, shortwards of the HD R(0) line
a blend of the H2 transitions R(3), 4-0 and R(6), 5-0. |
| Open with DEXTER | |
![\begin{figure}
\par\includegraphics[width=17.4cm,clip]{h4600f3.ps}
\end{figure}](/articles/aa/full/2004/10/aah4600/img21.gif) |
Figure 3: Sample curves of growth. Curves of growth were only used to determine an initial preliminary b value for the fitting process; this b value was then subject to some adjustment during the fit. Shown are single-component curves of growth for the b values that resulted from the fit, but the equivalent widths plotted are sums over the full absorption features, i.e. sums over the equivalents widths of the individual blended velocity components. For this reason a discrepancy between equivalent widths and the curve of growth is visible for the curve of the two-component sight line HD 152270. |
| Open with DEXTER | |
The analysis of the absorption lines is only possible if one applies full Voigt profile fitting to the absorption as a whole. Strong damping wings and heavy blends especially of the molecular lines hamper the identification of single absorption lines and the determination of equivalent widths for them; blends of lines of different species or excitation levels are common.
The Doppler parameter of the absorption b was estimated beforehand using a standard curve of growth analysis, but on a restricted set of absorption lines. This was done separately for the molecular and for the atomic gas since they possibly exist in different environments. For the molecules we used the H2 transitions of the J3, J4, and J5 excitation states which, for our sight lines, define the full flat part of the curve of growth (as preparatory plots showed). These lines thus tend to have only moderate damping wings, if at all, and readily provide equivalent widths. For the metals we used the full series of available iron absorption lines except the few that are obviously blended.
The b values so estimated were then taken as input parameters for an
interactive  fit to the FUSE spectra.
We generate a full theoretical Voigt profile absorption line spectrum over the FUSE wavelength range, fitting the radial velocity of the absorbing gas and the
column densities of all major absorbing species (including H I) at once.
A continuum level is estimated by eye.
This way we can also handle the extended damping wings and blends in the lines
in particular of the lower H2 excitation levels and also the various
inter-species blends.
In the process of fitting the initially estimated b values were adjusted
as well, if nessessary.
Figure 3 shows a sample of curves of growth using the final b
values and column densities.
fit to the FUSE spectra.
We generate a full theoretical Voigt profile absorption line spectrum over the FUSE wavelength range, fitting the radial velocity of the absorbing gas and the
column densities of all major absorbing species (including H I) at once.
A continuum level is estimated by eye.
This way we can also handle the extended damping wings and blends in the lines
in particular of the lower H2 excitation levels and also the various
inter-species blends.
In the process of fitting the initially estimated b values were adjusted
as well, if nessessary.
Figure 3 shows a sample of curves of growth using the final b
values and column densities.
The lines' transition parameters are taken from Abgrall et al. (1993a,b)
for the H2 Lyman and Werner band (utilising the electronic version of the
data provided by
S. R. McCandliss),
Morton (1978,1975) and Wright & Morton (1979) for HD, and Morton & Noreau (1994) and
Federman et al. (2001) for CO.
The metal transitions are from Morton (2003), with some values for Fe taken
from Howk et al. (2000).
The full set of transitions is included in the fitting process, however the
weakest lines do not neccessarily contribute to the result.
A small number of stronger transitions had to be disregarded due to
unidentified blends or detector effects.
We use the wavelength/velocity calibration that is provided by the FUSE 1A LiF spectra. Although the FUSE wavelength calibration is, at present, known to be problematic (see, e.g., the discussion in Sect. 3.4 of Wakker et al. 2003) comparison with the velocity structure observed in high resolution optical spectra (Crawford 2001,1995) shows a high similarity. We thus assume that the wavelength scale defined in the 1A LiF (and also the 2A LiF) spectra is very close to reality. Corrections would have had to be applied to the spectra of some of the other detectors, though, but they are not used in this work.
Figure 2 shows samples of various unblended absorption lines on the
seven sight lines.
In Fig. 4 a sample of typical heavily blended H2
absorption structures is given, together with the full Voigt profile fit.
![\begin{figure}
\par\includegraphics[angle=-90,width=11.2cm,clip]{h4600f4.ps}
\end{figure}](/articles/aa/full/2004/10/aah4600/img24.gif) |
Figure 4: Sample portion of the HD 152234 spectrum with a one-component fit, in which the positions of the fitted transitions are indicated. The continuum count rate in this region of the spectrum is ca. 6000 (binned). The full wealth of H2 transitions mainly of the (4-0) vibrational states is visible. Also visible is a strong HD line of the J=0 state (HD R(0), 4-0). For the J=1 state of HD we measure only upper limits. The Ar I transition at 1048 Å (see also Fig. 2) is affected by some unknown absorption on its left wing, maybe by a weak second component bluewards. Also other lines hint at the presence of a weak second component. |
| Open with DEXTER | |
Errors for the column densities are determined as  deviations from
the fit.
In addition to these, we have to take care of additional uncertainties from
four sources which are not included in the fitting process itself.
deviations from
the fit.
In addition to these, we have to take care of additional uncertainties from
four sources which are not included in the fitting process itself.
The FWHM:
The instrumental FWHM in our spectra seems to change over the FUSE detector
segments, with the 1A LiF spectra having a slightly higher FWHM
(24 km s-1, in the case of HD 152200) than the 2A LiF spectra
(22 km s-1).
This adds some uncertainty to the column density fit, however it measurably
affects only the fits for N I (near
 Å) and for the
J=3 to 5 levels of H2.
In general, the variation of column density with FWHM is in the range of the
small error from the
fit.
For the few elements mentioned one may get up to three times this value.
Å) and for the
J=3 to 5 levels of H2.
In general, the variation of column density with FWHM is in the range of the
small error from the
fit.
For the few elements mentioned one may get up to three times this value.
The three H2 levels are the ones which we use in fixing the b value because of their location on the flat part of the curve of growth. The curve of growth procedure, however, deals with equivalent widths only and is thus independent from changes in FWHM. Thus, the origin of this particular variation on changing FWHM is rather caused by the general uncertainty in fitting elements on the flat part of the curve of growth, not by the uncertainty in FWHM itself.
The lines of N I are in general difficult to fit due to their close triplet nature, they are highly sensitive to changes in any fitting parameter, including FWHM.
The continuum:
Another question is the dependency of the resulting column densities on the assumed continuum. There seems to be no proper way to quantify this dependency. Of course, elements with only few transitions are more sensitive to changes in the local continuum of a particular line. Among those, the saturated lines of especially O I and N I are more affected, since the fit is here mainly sensitive to changes in the flanks of the absorption profile, while the profiles themselves are not very sensitive to changes in column density.
Overall, we find a variation in column density of about the size of the
fit errors (about twice that value for O I and N I)
if one varies the local continuum by about  of the originally assumed
level.
The resulting continua are outside the range of what would be considered a
valid continuum for our spectra; therefore this gives a good estimate of the
uncertainty introduced by the continuum selection.
of the originally assumed
level.
The resulting continua are outside the range of what would be considered a
valid continuum for our spectra; therefore this gives a good estimate of the
uncertainty introduced by the continuum selection.
The b value:
The b value is the largest and also the easiest to underestimate contributor of errors, whether one uses the conventional curve of growth technique or any sophisticated fitting procedure. Even in high-quality spectra it can be difficult to fix.
For the metals, only iron is suitable for determining b, all other elements having too few usable transitions in the FUSE spectral range. As a consequence, some of the latter are also more error-prone. In our case, the column densities in particular of oxygen and nitrogen are extremely sensitive to changes in b, with their line strengths at the level of the flat part of the curve of growth. The less abundant elements are located on the linear part of the curve and are thus well defined, but for the same reason they cannot be used to fix the b value.
The various H2 excitation states are located all over the curve of growth, but only the slightly saturated middle levels define the b value for the molecular gas. As for the metals, their column densities again are most sensitive to changes in the b value, while the equivalent widths of the transitions and their profiles change only marginally. The quality of the fit therefore does not suffer much and does not provide any measure for the quality of the b value.
Fitting the spectrum with different b values gives an impression of the
variation.
We varied the originally determined b value by  1 km s-1.
Column densities for elements having only absorption lines with a strength of
the flat part of the curve of growth changed by up to 0.5 dex, for elements
low on the linear part or high in the damping part about 0.1 dex or even
less.
As error from the b value uncertainty we assume, for each element, the mean
deviation for
fits with
1 km s-1.
Column densities for elements having only absorption lines with a strength of
the flat part of the curve of growth changed by up to 0.5 dex, for elements
low on the linear part or high in the damping part about 0.1 dex or even
less.
As error from the b value uncertainty we assume, for each element, the mean
deviation for
fits with  km s-1.
The stellar contribution:
Stellar atmospheric features are relatively few in number and then easily visible, mostly wide features. Strong wind profiles are found, especially in the Wolf-Rayet star HD 152270. We tested modelling the stellar spectra using Kurucz atmospheric models, without a satisfying result. Broad stellar features are therefore included by eye in the assumed continuum. If interstellar lines are affected by narrow stellar atmospheric lines in a way that such a continuum cannot unambiguously be defined, these regions are excluded from the fit.
The individual errors from all these sources -
fit and uncertainties
in FWHM, continuum, and b value - add up to the given total errors.
In most cases, the errors from the fit itself are very small, so the larger
contribution comes from the uncertainty in the continuum, in the FWHM, and
especially the b value.
Table 2:
List of column densities  [
[
 ]
towards NGC 6231.
FWHM, radial velocities v, and Doppler widths b are in km s-1.
Upper limits are at least
]
towards NGC 6231.
FWHM, radial velocities v, and Doppler widths b are in km s-1.
Upper limits are at least  .
The b values are "effective'' values for the measured absorption
lines and should be lower for individual unresolved subcomponents.
.
The b values are "effective'' values for the measured absorption
lines and should be lower for individual unresolved subcomponents.
The column densities resulting from the fit are listed in Table 2.
If a species is not detected we give
upper limits determined at the
positions of strong, but not neccessarily the strongest, unblended transitions.
We find one prominent absorption component, and in some spectra a second one bluewards which is weaker but clearly distinguishable.
The first, stronger velocity component is seen in H2 absorption in all spectra at heliocentric velocities of about -8 km s-1. Velocities can be fitted with a precision of 1 km s-1 or below.
We observed that the velocity of some metal absorption lines is different from
that of the molecules by up to 6 km s-1 bluewards.
This is observable only in those spectra which show a single velocity
component.
In the other spectra it is probably obscured by blendings of the components.
We fitted these lines using slightly different velocity offsets.
In two cases the O I transition at 1039 Å is seen to be shifted by
another -4 km s-1.
The origin of this shift may be unresolved substructure in the form of an additional blueward component that is visible only in metal lines. A complex velocity substructure is known to exist from ultra-high resolution optical spectra of sight lines in this general direction (Crawford 2001,1995). A problem in the FUSE wavelength calibration would not be restricted to the transitions of metals and thus can be ruled out as a cause for such a shift.
The second, less prominent velocity component is found in at least three of the spectra (HD 152249, HD 152270, HD 326329), mainly in the weaker metal transitions at a velocity of about -40 km s-1. It should be noted that these three sight lines are located closely together at the eastern edge of the target field. On other sight lines a second component may also be present at that velocity judged from well-defined metal lines like P II (1152).
In optical ultra-high resolution spectra, Crawford (2001) resolves numerous velocity components in Na I and K I, with stronger column density peaks around -39 km s-1, -9 km s-1, and +2 km s-1. Crawford (1995) finds numerous absorptions of CH, CH+, and CN, again peaking around velocities of -9 km s-1 and +2 km s-1. Especially the velocity of the -9 km s-1 component varies, however, depending on the environment the absorbing element lives in.
CO emission line surveys for this general direction show two main velocitiy components as well (e.g., Bronfman et al. 1989). However, the component velocity separation in that data is slightly larger than in our spectra (about 40 km s-1 compared to our 32 km s-1), and the velocities are shifted by -10 km s-1. As supposed by Bronfman et al. (1989), the emission at negative velocities should originate in the far background of NGC 6231. It is therefore not related to the absorption in the NGC 6231 star spectra, despite the similar velocity. The emission components seen at positive velocities can be associated with the Lupus molecular cloud region at a distance of about 150 pc (Crawford 2000), and those may indeed interfere with our sight lines.
![\begin{figure}
\includegraphics[width=12cm,clip]{h4600f5.ps}
\end{figure}](/articles/aa/full/2004/10/aah4600/img182.gif) |
Figure 5: Element depletions as derived from the seven sight lines observed. The width of the error boxes varies for better readability only. The bold lines represent the values typically found in the interstellar medium in warm ( upper bold line) and cool ( lower bold line) gas (Savage & Sembach 1996). The scatter especially in Ar, O, and Si is due to difficulties in determining the column densities for these metals. |
| Open with DEXTER | |
H2 can be fitted with high accuracy due to the multitude of transitions
covering a large range of transition probabilities.
Only the middle excitation states (esp. J=2,3) are less accurate, resulting
from their location on the flat part of the curve of growth (see above,
Sect. 2).
A mean
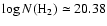 indicates a sizeable amount, in line
with the values of E(B-V).
The higher excitation levels J=6 and 7 which are highly desired for
excitation modelling are hardly separated from the noise, though.
indicates a sizeable amount, in line
with the values of E(B-V).
The higher excitation levels J=6 and 7 which are highly desired for
excitation modelling are hardly separated from the noise, though.
Also the HD absorption is, in the J=0 state, strong enough for a clean fit. The J=1 state is close to the detection limit but may be visible in some cases. We give upper limits for the HD J=1 column density.
Fitting CO is more difficult. The resolution of FUSE is too low to resolve the individual transitions in the CO absorption bands. Typically, the Doppler b value in an environment where CO is found is low. This means that the equivalent widths are not neccessarily located on the linear part of the curve of growth; they are thus no longer additive. The column densities can therefore only be lower limits.
The CO abundances along our sight lines are, with respect to the H2
abundances, within the usual range.
CO column densities in the ISM typically increase significantly at H2column densities >1019 cm-2.
The ratio of
 found fits into the relation drawn by
Federman et al. (1980).
However, the ratio of
found fits into the relation drawn by
Federman et al. (1980).
However, the ratio of
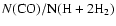 deviates from other
Galactic sight lines, presumably due to the fact that the total sight line
samples large amounts of H I in regions where no molecular gas, and
especially no CO, exists.
deviates from other
Galactic sight lines, presumably due to the fact that the total sight line
samples large amounts of H I in regions where no molecular gas, and
especially no CO, exists.
The molecule column densities, of H2 as well as of HD and CO, are not automatically linearly related to those of H I, because they have their origin in a far more constrained fraction of the sight line. Molecular gas is in general confined in the denser regions of the interstellar clouds and is thus of a more clumpy nature.
The deviation of the column densities of H I is of prime importance. They are the basis for the depletion values and thus any analysis of their variation, as well as for any statement on a possible abundance variation between the different sight lines. Judged from the relative abundances of the, in general, only marginally depleted P and of Fe (see, e.g., the review by de Boer et al. 1987), all our H I abundances are consistent with the typical P and Fe values observed along high column density sight lines (Fig. 5). The values towards HD 152234 and HD 152249 fully agree with the results from the IUE survey of Diplas & Savage (1994) as well.
We observe a variation in the total gas column density,
 ,
between
,
between
 (HD 152200) and 21.52
(HD 152270), which is about
(HD 152200) and 21.52
(HD 152270), which is about  over an angle of
 (
if one only takes H I into account).
The variation is rather a linear increase from the western to the eastern
edge of the field of view than a fluctuation due to structure on even smaller
scales.
The expected large number of H I absorbers along the sight lines will,
even if they are spatially structured, smear out any fluctuation, leaving just
a general smooth increase of column density.
This increase in
(
if one only takes H I into account).
The variation is rather a linear increase from the western to the eastern
edge of the field of view than a fluctuation due to structure on even smaller
scales.
The expected large number of H I absorbers along the sight lines will,
even if they are spatially structured, smear out any fluctuation, leaving just
a general smooth increase of column density.
This increase in
 is in agreement with the map from IRAS for
this region, which shows a smooth rise in dust emission in the same general
direction (Fig. 1).
The effect may also be connected to the second velocity component that we
observe towards the group of targets located in the north-eastern region of
our field.
is in agreement with the map from IRAS for
this region, which shows a smooth rise in dust emission in the same general
direction (Fig. 1).
The effect may also be connected to the second velocity component that we
observe towards the group of targets located in the north-eastern region of
our field.
The column densities derived for the metals are given in Table 2. Fe II is the only metal with a large number of usable transitions in the FUSE spectral range, which results in a reliable fit and the smallest uncertainties in column density.
Also P II seems, with only two transitions
(
 ,
1152 Å),
to give good results if one compares its derived depletion with typical values
(de Boer et al. 1987).
To get proper metal depletions we use the metal column densities summed over
all velocity components, since we are unable to separate any velocity
components in H I.
This, however, reduces the value of the depletions for the interpretation of
the physical conditions in a particular velocity component.
,
1152 Å),
to give good results if one compares its derived depletion with typical values
(de Boer et al. 1987).
To get proper metal depletions we use the metal column densities summed over
all velocity components, since we are unable to separate any velocity
components in H I.
This, however, reduces the value of the depletions for the interpretation of
the physical conditions in a particular velocity component.
The C I ground state transitions blend with various transitions of the excited states of neutral carbon and are difficult to unravel. Therefore, upper limits are listed in most cases. Information on C II, which is the dominant state of carbon in neutral gas, is not available in the FUSE spectral range.
For some important ions the number of usable transitions in the FUSE spectral
range is small (N I
 1134.165, 1134.415, 1134.980,
1159.817; O I
1134.165, 1134.415, 1134.980,
1159.817; O I  1039.230; Si II
1020.699),
and we cannot rule out stellar contamination.
We therefore have to assume large errors for these column densities.
1039.230; Si II
1020.699),
and we cannot rule out stellar contamination.
We therefore have to assume large errors for these column densities.
The accuracy of the Ar I abundance is compromised due to difficulties in fitting the only two transitions. The second velocity component at -40 km s-1 seems to be present on all sight lines for Ar I, which has an effect on the b value to choose for the fit. Also, the Ar I lines are located on the flat portion of the curve of growth, making a column density determination highly sensitive to the chosen b value.
O I is especially hard to fit on the two-component sight lines, in particular towards HD 152249 and HD 152270. Fits are possible only to one flank of the profile, which requires a precise wavelength calibration at the position of the transition. Table 2 states the results from the fit for O I, but the errors given are only the results from the fitting process itself and cannot represent the larger true uncertainty.
NGC 6231 is located in the centre of the Sco OB1 association, at the near side of the Sagittarius spiral arm. The structure of the interstellar medium along the line of sight is complex.
The extinction survey of Neckel & Klare (1980, field 343/+1) shows in this
direction a sharp increase in interstellar extinction by AV=0.75 mag that
takes place between about 100 and 300 pc distance.
As mentioned before (Sect. 3.1), the sight line passes the outer
regions of the Lupus molecular cloud region,
an extended star forming region at the near edge of the Sco-Cen OB association.
The 12CO emission maps of Bronfman et al. (1989) show that our sight
line misses this CO cloud by
 ,
only about 2.6 pc at a distance
of 150 pc.
,
only about 2.6 pc at a distance
of 150 pc.
Another sharp increase in extinction is found by Neckel & Klare (1980) at a distance of 700-1000 pc, again by AV=0.75 mag. Beyond this point, the sight line seems to be clear up to the cluster at about 1900 pc.
The heliocentric radial velocity of NGC 6231 is about -25 km s-1, depending on the method used in the determination (e.g., Dambis et al. 2001; Laval 1972). Gas surrounding the association is expected to have been cleared away, so its absorption velocity will be more negative. In consequence, we can assume that gas at more positive absorption velocities is not associated with the cluster but located somewhere on the line of sight.
Table 3: H2 Boltzmann temperatures T01 and equivalent excitation temperatures T35 for the -8 km s-1 component.
Following this reasoning, the velocity component seen at -40 km s-1 probably originates in the outwards-moving shell of Sco OB1. Ultra-high resolution optical spectra towards HD 152249 (Crawford 2001) show substructure in this velocity component that is not resolved by FUSE.
It seems reasonable to assume that the absorption at -8 km s-1
is associated with the outer regions of the Lupus molecular clouds where
strong absorption is expected to happen.
However, velocities at this longitude do not provide, using Galactic rotation
models, any distance information that would back up this assumption.
The detection of the second velocity component at
 km s-1 in only a subgroup of the sight lines may also
point to a location of that component in the background, near Sco OB1.
km s-1 in only a subgroup of the sight lines may also
point to a location of that component in the background, near Sco OB1.
The slightly velocity-shifted metal lines then may result from an unresolved blend of absorption at the Lupus cloud distance and at larger distances, maybe including even more unresolved components not containing H2. The extinction observed between 700 and 1000 pc may be connected to these unresolved components.
Table 4: Total column densities and logarithmic column density ratios for the molecules in the -8 km s-1 component.
![\begin{figure}
\par\includegraphics[width=8.4cm,clip]{h4600f6.ps}
\end{figure}](/articles/aa/full/2004/10/aah4600/img227.gif) |
Figure 6:
Measured H2 excitation and excitation model for
HD 152234.
Testing of various models restricts the parameters to a hydrogen
density n of not more than 1000 cm-3 and a radiation
field at
 Å with Å with
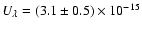 erg cm-3 Å-1.
Shown is the fit for n=100 cm-3. erg cm-3 Å-1.
Shown is the fit for n=100 cm-3. |
| Open with DEXTER | |
The excitation of the H2 molecule results from two separate mechanisms: The lower levels are predominantly excited by collisional excitation that is described by a Boltzmann temperature. The higher levels (from J=2 on upwards) are populated mainly by molecules cascading back from even higher excitation states after either being pumped to these states by UV photons, or in the molecule formation process. This excitation is in general described by fitting another Boltzmann distribution characterised by a so called equivalent excitation temperature. The low level H2 excitation temperatures for the individual sight lines are given in Table 3.
We did extensive excitation modelling of H2 for some of the sight lines. Appendix A gives a more detailed description of the model. In short, the model assumes a single isothermal cloud of constant density and the equilibrium population of the rotational levels J=0 to J=7 for a given total H2 column density is calculated.
Using simplifications such as a constant interstellar radiation field and an approximate treatment of the UV attenuation by dust inside the cloud, the models allow an estimate of the level of the FUV radiation field and of the hydrogen density.
For most stars it is not possible to fully fit the excitation using a single H2 component model. Interestingly, this may again point to a hidden two component structure in the gas, with physically distinct environments.
As it was shown, e.g., by Flower et al. (1986), the shock front of an expanding shell can also excite H2 in a way that is comparable to relatively high Boltzmann excitation temperatures. There are, however, indications against a current shock in the Sco OB1 shell (Crawford 2001) and also no indications for a shock in the Lupus clouds (Crawford 1995). The Na I/Ca II ratios indicate a previous shock in the Sco OB1 environment that released part of the Ca bound in dust grains, but since then the gas has cooled down again.
Gas in the Sco OB1 shell, however, would have a different, more negative, velocity and thus would not hide in the main velocity component. The most plausible explanation for a hidden second component is found in either substructure inside the Lupus cloud region or in the gas causing the strong extinction at 700 to 1000 pc distance. From our data it is not possible to make any definitive statement on this or on any even more complicated velocity structure.
The excitation on the HD 152234 sight line allows a fit of a one component
model (Fig. 6).
Fitting a range of models constrains the gas density n to not more than
1000 cm-3 and the radiation field to
 Å
Å
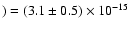 erg cm-3 Å-1.
This value is about 100 times the typical Galactic disk radiation field
(e.g., Habing 1968), which could hint at a significant source of
radiation closeby.
erg cm-3 Å-1.
This value is about 100 times the typical Galactic disk radiation field
(e.g., Habing 1968), which could hint at a significant source of
radiation closeby.
Another estimate of the conditions in the gas is provided by the ratio of the two lowermost excitation levels of HD. In contrast to H2, transitions between even and odd rotational excitation states are possible. The population of the J=0 and J=1 states of HD therefore depends not only on collisional but also on excitation by the prevailing radiation field.
However, if one assumes the temperature, density, and radiation field derived
from the H2 excitation to be valid also for HD, one would get a much higher
population of the HD J=1 level than is observed
(
 /
/
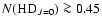 instead of the observed
0.2).
The ratio that is observed constrains the radiation field in the gas to not
more than
instead of the observed
0.2).
The ratio that is observed constrains the radiation field in the gas to not
more than
 erg cm-3 Å-1
(or I<35), which is at least a factor 2 smaller than the value from the
H2 models.
erg cm-3 Å-1
(or I<35), which is at least a factor 2 smaller than the value from the
H2 models.
To explain this discrepancy, one has to recall that the H2 excitation model assumes a single cloud. A high radiation field is needed to penetrate this large cloud and produce the observed excitation pattern. A number of smaller clouds with the same overall column density along the sight line would show an excitation pattern similar to the observed one already at a smaller radiation field, provided the radiation is not attenuated by other cloudlets.
We tested additional models for a series of clouds with only a fraction of the total column density each. The observed excitation pattern is equally well fitted by two or four smaller clouds and by a radiation field smaller by the same factor, plus a smaller b value for each cloud. Such a model would still be consistent with the larger number of absorption lines and the correspondingly low b values Crawford (2001) finds from optical ultra-high resolution spectra.
This suggests a considerably smaller radiation field than required by the simple one-cloud model (possibly not much higher than the Galactic radiation field) and a number of smaller distinct clouds along the sight line.
The modelling of the H2 excitation furthermore allows us to estimate the
formation rate of H2 in the gas.
The H2 dissocitation rate from the one-component model is
 s-1.
This would require a formation rate coefficient
s-1.
This would require a formation rate coefficient
 cm3 s-1 (for a density of n=100 cm-2)
to maintain equilibrium between formation and dissociation of the H2.
However, the commonly accepted value for the H2 formation rate is
1-
cm3 s-1 (for a density of n=100 cm-2)
to maintain equilibrium between formation and dissociation of the H2.
However, the commonly accepted value for the H2 formation rate is
1-
 cm3 s-1, depending mainly on the composition of
the interstellar dust.
Provided that the H2 formation takes place at only the usual rate, the
local radiation field will then dissociate the H2 gas within a time scale of
roughly 106 a.
A stable condition might exist if the gas density is as high as
500 cm-3, thus lowering the required formation rate coefficient.
cm3 s-1, depending mainly on the composition of
the interstellar dust.
Provided that the H2 formation takes place at only the usual rate, the
local radiation field will then dissociate the H2 gas within a time scale of
roughly 106 a.
A stable condition might exist if the gas density is as high as
500 cm-3, thus lowering the required formation rate coefficient.
Crawford (1989) gives an analysis of the CH column densities towards
Sco OB1.
Using a simple model with an assumed density of  cm-3, he
reproduces these column densities, but the model fails to reproduce the CH+ abundance.
Provided that H2 and CH coexist in the same region of space, this
constrains the density in the molecular gas to be in the range of
100 cm
cm-3, he
reproduces these column densities, but the model fails to reproduce the CH+ abundance.
Provided that H2 and CH coexist in the same region of space, this
constrains the density in the molecular gas to be in the range of
100 cm
 cm-3.
cm-3.
The quality of most of the metal abundances is too low for any constraints on physical gas parameters.
The ratios of the molecular species, H2/HD and H2/CO, are, within the range of the errors (Table 4), constant over the sight lines. This allows a good estimate of these astronomically important parameters.
We get a mean
 /
/
 of
of
 .
Although the physical conditions are different, this value can be compared
with results from other models, e.g. from
van Dishoek & Black (1988, especially their model H1) for the
.
Although the physical conditions are different, this value can be compared
with results from other models, e.g. from
van Dishoek & Black (1988, especially their model H1) for the
 Oph sightline.
As expected, this locates the NGC 6231 gas at the low density edge
of these translucent cloud models, at a radiation level probably near
the Galactic disk average (e.g., Draine 1978) and densities of about
500 cm-3.
Oph sightline.
As expected, this locates the NGC 6231 gas at the low density edge
of these translucent cloud models, at a radiation level probably near
the Galactic disk average (e.g., Draine 1978) and densities of about
500 cm-3.
Also, we obtain a mean
/
 of
of
 .
This value is not related to the H/D ratio in a linear way but it also depends,
due to the formation processes involved, on additional parameters like the
proton density in the gas.
Also, in all dominant processes involved in the production of HD ionised
hydrogen or deuterium plays a role.
For this reason the ratio of H2/HD leads to an estimate for the ionisation
level in the molecular cloud.
Assuming a density of n=100 cm-3 and an optical depth at 1000 Å of
.
This value is not related to the H/D ratio in a linear way but it also depends,
due to the formation processes involved, on additional parameters like the
proton density in the gas.
Also, in all dominant processes involved in the production of HD ionised
hydrogen or deuterium plays a role.
For this reason the ratio of H2/HD leads to an estimate for the ionisation
level in the molecular cloud.
Assuming a density of n=100 cm-3 and an optical depth at 1000 Å of
 we get a fraction of ionised hydrogen of
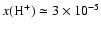 .
We assume N(D)/N(H
.
We assume N(D)/N(H
 ,
the mean value from recent
measurements (Bluhm et al. 1999; Moos et al. 2002; Hoopes et al. 2003) on sight lines beyond the Local
Bubble.
This low ion fraction, however, does not allow conclusions on the abundance
of free electrons in the gas, which are mainly provided by C II under
the prevailing conditions.
,
the mean value from recent
measurements (Bluhm et al. 1999; Moos et al. 2002; Hoopes et al. 2003) on sight lines beyond the Local
Bubble.
This low ion fraction, however, does not allow conclusions on the abundance
of free electrons in the gas, which are mainly provided by C II under
the prevailing conditions.
The excitation of neutral carbon and its dependence on gas density and
temperature is described by de Boer & Morton (1974).
The ratio of C I (3P1)/C I (3P0) is probably
<-0.2 dex for our gas, on the HD 152234 sight line roughly
-0.2 dex.
With this value and the temperature of 64 K that was derived above
(Sect. 4.2) for the H2 gas, one gets a gas density of
 cm-3.
Alternatively, a gas density of 100 cm-3 as derived from the H2models would require a gas temperature of
cm-3.
Alternatively, a gas density of 100 cm-3 as derived from the H2models would require a gas temperature of  K for the observed
C I excitation.
In general, the gas pressure
K for the observed
C I excitation.
In general, the gas pressure
 from C I is around
8000 K cm-3.
from C I is around
8000 K cm-3.
The depletion of the metals seems, with the uncertainties in mind, not
unusual.
The values for phosphor and iron are in the range that is typical for cool disk
gas.
For Ar I one might, from the depletion diagram
(Fig. 5), crudely estimate an additional underabundance by
-0.2 dex due to partial ionisation.
This would correspond with an ionisation rate of the gas of 0.07, which
would require a photoionisation rate of  H
H
 s-1(assuming T=5000 K and
 cm-3) or,
density independent, H
cm-3) or,
density independent, H
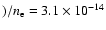 s-1.
However, the uncertainty in the Ar I column density is large
(as discussed in Sect. 3.2.3) and these rates should not be
overinterpreted.
s-1.
However, the uncertainty in the Ar I column density is large
(as discussed in Sect. 3.2.3) and these rates should not be
overinterpreted.
In all these considerations we have to bear in mind that there is velocity substructure in our absorption lines which we are unable to resolve, and that there is probably also absorption at similar velocities from physically distinct regions in the ISM. The gas seen in the partially ionised Ar I is surely distinct from the gas seen in the molecules, the Ar I being in the outer boundaries of denser regions or possibly warmer intercloud medium. Also the number of molecular clouds is unclear, or its separation into smaller cloudlets along the line of sight. The CO is expected to exist in the shielded cores of these clouds, so its density will be somewhat higher than that of the H2 gas. Nevertheless, all methods and all models seem to point at an extended substructure of small cloudlets which can be deeply penetrated by the surrounding radiation field.
Besides the structure of the gas along the lines of sight, a main aspect of this paper is the structure over the field of view, perpendicular to the sight lines. Of the metals only Fe II and P II provide useful information on this structure. To get a valid comparison with the H I abundance that is not resolved in velocity, one has to use the column density sums over the velocity components observed, which results, again, in a lack of significant variation for both species. Thus, the statistical blend of different absorbers hides any information on column density fluctuations over a particular cloud.
The molecular gas may, however, provide some insight since it very likely is
more sparsely distributed along the sight lines.
We observe a rather irregular variation of the H2 column density over
the field of view, with variations of 40% over a scale of roughly
(HD 152219 and CPD -41 7712 being the extremes).
The angular separation of these two sight lines corresponds to only
0.05 pc at the distance of 150 pc assumed for the molecular gas.
Under the - simplifying - assumption of circular H2 cloudlets, one
derives a radius of not more than 0.1 pc (
 )
for the strongly
absorbing H2 cloud in front of CPD -41 7712, at the edge of the
triangle formed by HD 152200, HD 152219, and
HD 152249.
)
for the strongly
absorbing H2 cloud in front of CPD -41 7712, at the edge of the
triangle formed by HD 152200, HD 152219, and
HD 152249.
The difference in column density in this region is about
 cm-2.
With a radius of 0.1 pc such a cloutlet would then have an average density
of roughly 300 cm-3, again in accord with the values derived above.
cm-2.
With a radius of 0.1 pc such a cloutlet would then have an average density
of roughly 300 cm-3, again in accord with the values derived above.
Some variation is also visible in the equivalent excitation temperatures that are connected to the intensity of the radiation field at the location of the gas. These temperatures, however, are only slightly anticorrelated with the H2 column density.
The imperfections in the calibration of the FUSE spectra do not allow us to make any hard statement on potential velocity substructure over the field of view. From the agreement of the individual H2 absorption velocities we assume a quite homogeneous velocity distribution of at least the H2 gas over our field of view.
Absorbers seen in metal lines are far more abundant along the sight lines, so the absorption is seen at many more different velocities. The variation seen in the velocities of these lines probably rather comes from faint variations in the blends of different absorbers than from real velocity substructure.
We find a main absorption component at a velocity of -8 km s-1, and a weak second one at about -40 km s-1 that is resolved only on some of the sight lines. The main component is probably associated with the Lupus molecular cloud region at 150 pc distance, while the second one may show gas in the Sco OB1 shell.
For the molecular gas we find strong arguments for a density of the order of
magnitude of 100 cm-3.
The radiation field
 in the molecular cloud region may be strong,
if one considers single-cloud H2 excitation models.
The CO abundance rather hints to a radiation field near the mean Galactic
value, which could also be consistent with multi-cloud models for the H2
excitation.
At a high level of radiation in the clouds the molecular gas may be in
a process of dissolution.
in the molecular cloud region may be strong,
if one considers single-cloud H2 excitation models.
The CO abundance rather hints to a radiation field near the mean Galactic
value, which could also be consistent with multi-cloud models for the H2
excitation.
At a high level of radiation in the clouds the molecular gas may be in
a process of dissolution.
In addition to this indicated clumpiness along the sight lines
the gas structure perpendicular to the sight lines is analysed.
The spatial variation in the column densities for the Lupus cloud gas is
found to be
for H2 and
for H I.
This strongly indicates clumpiness in the gas on scales of 0.1 pc and below.
We are not able to resolve any spatial variation in the velocity of the
absorbing gas over the field of view.
Clumpiness of the molecular interstellar medium has been detected in several recent works and on various scales, e.g., Pan et al. (2001) on sub-parsec scales and Lauroesch & Meyer (2000) on scales down to almost ten AU.
This work is another confirmation of the inhomogeneous structure of the Galactic ISM on sub-parsec scales.
This Appendix gives a concise overview of the H2 excitation model used in our analysis (Sect. 4.2). The full details are found in Bluhm (2003).
The basic properties of the model are:
 ,
b, T,
,
b, T,
 ,
,
 ,
)
are used to calculate 8 column densities
N(J=0...7).
,
)
are used to calculate 8 column densities
N(J=0...7).
 ,
,
 ,
,
 ,
and
,
and
 (where l is the depth along the sight line in the
cloud).
refers to the irradiated edge of the cloud.
(where l is the depth along the sight line in the
cloud).
refers to the irradiated edge of the cloud.
Acknowledgements
OM was in part supported by Deutsche Forschungsgemeinschaft (DFG) grant Bo 779/24, HB in part by the DFG Graduiertenkolleg "The Magellanic Clouds and other dwarf galaxies'' (GRK 118). We thank the referee, S.R. Federman, for helpful suggestions.