A&A 414, 445-451 (2004)
DOI: 10.1051/0004-6361:20034155
G. A. Mamon 1,2 - T. Sanchis 3 - E. Salvador-Solé3,4 - J. M. Solanes3,4
1 - Institut d'Astrophysique de Paris (CNRS UMR 7095), 98bis Bld Arago,
75014 Paris, France
2 -
GEPI (CNRS UMR 8111), Observatoire de Paris, 92195 Meudon Cedex, France
3 -
Departament d'Astronomia i Meteorologia, Universitat de Barcelona, Martí i
Franquès 1, 08028 Barcelona, Spain
4 -
CER on Astrophysics, Particle Physics, and Cosmology, Universitat de Barcelona, Martí i
Franquès 1, 08028 Barcelona, Spain
Received 1 August 2003 / Accepted 21 October 2003
Abstract
Spiral galaxies that are deficient in neutral hydrogen are observed
on the outskirts of the Virgo cluster. If their orbits have crossed the inner
parts of the cluster, their interstellar gas may have been lost through ram
pressure stripping by the hot X-ray emitting gas of the cluster. We estimate
the maximum radius out to which galaxies can bounce out of a virialized system
using analytical arguments and cosmological N-body simulations. In
particular, we derive an expression for the turnaround radius in a flat
cosmology with a cosmological constant that is simpler than previously derived
expressions. We find that the maximum radius reached by infalling galaxies as
they bounce out of their cluster is roughly between 1 and 2.5 virial radii.
Comparing to the virial radius of the Virgo cluster, which we estimate from
X-ray observations, these H I-deficient galaxies appear to lie significantly
further away from the cluster center. Therefore, if their distances to the
cluster core are correct, the H I-deficient spiral galaxies found outside of
the Virgo cluster cannot have lost their gas by ram pressure from the hot
intracluster gas.
Key words: galaxies: evolution - methods: analytical - methods: N-body simulations
Radio observations at 21cm have revealed that spiral galaxies within clusters
are deficient in neutral hydrogen (e.g. Chamaraux et al. 1980), and their
H I-deficiency, normalized to their optical diameter and morphological type, is
largest for the spirals near the cluster center
(Solanes et al. 2001; Haynes & Giovanelli 1986; Cayatte et al. 1990). Chamaraux et al. (1980) suggested that the H I-deficiency
of cluster spirals was caused by the ram pressure stripping of their
interstellar Hydrogen by the hot intracluster gas that emits in X-rays.
Galaxies falling face-on into a cluster experience a ram pressure that scales
as
![]() (Gunn & Gott 1972), where
(Gunn & Gott 1972), where
![]() is the
cluster gas density and v is the relative velocity of the spiral galaxy in
its cluster. Therefore, ram pressure stripping requires the large infall
velocities present in rich clusters.
is the
cluster gas density and v is the relative velocity of the spiral galaxy in
its cluster. Therefore, ram pressure stripping requires the large infall
velocities present in rich clusters.
Solanes et al. (2002) recently discovered deficient spirals in the periphery of the Virgo cluster, with several ones typically over 5 Mpc in front or behind the cluster core. In an ensuing study, Sanchis et al. (2002) could not discard the possibility that some of these galaxies could have passed through the cluster core and in the process had their interstellar gas swept out by the ram pressure caused by the intracluster hot diffuse gas.
The idea of galaxies beyond the virial radius having passed through the main
body of a cluster in the past has been addressed by Balogh et al. (2000) in the
context of the discovery of reduced star formation rates on the outskirts of
clusters in comparison with the field
(Balogh et al. 1997).
Using cosmological simulations,
Balogh et al. analyzed
6 clusters within a sphere of 2
times their final virial radius and found that ![]() % of the particles
between r200 and 2 r200 (where r200 is the radius where the
mean density of the cluster is 200 times the critical density) have actually
been inside the virial radius of the main cluster progenitor at some earlier
time.
Unfortunately, Balogh et al. do not provide any precision on the maximum
distances that such particles that were
once within a cluster progenitor can move out
to. Furthermore, one needs to check if 2 r200 represents a sufficient distance for particles bouncing out of
virialised structures to explain the H I-deficient
galaxies on the outskirts of the Virgo cluster.
% of the particles
between r200 and 2 r200 (where r200 is the radius where the
mean density of the cluster is 200 times the critical density) have actually
been inside the virial radius of the main cluster progenitor at some earlier
time.
Unfortunately, Balogh et al. do not provide any precision on the maximum
distances that such particles that were
once within a cluster progenitor can move out
to. Furthermore, one needs to check if 2 r200 represents a sufficient distance for particles bouncing out of
virialised structures to explain the H I-deficient
galaxies on the outskirts of the Virgo cluster.
In this paper, we ask whether the H I-deficient galaxies on the outskirts of the Virgo cluster have previously passed through the core of the cluster, using both analytical arguments and the output of cosmological N-body simulations. In Sect. 2, we describe the N-body simulations analyzed in this paper. Next, in Sect. 3, we study the structure in radial phase space of dark matter halos of the simulations. In Sect. 4, we compute the maximum rebound radius, both analytically, making use of the turnaround radius of cosmological structures, which we compute in an appendix, and by studying the structure of our simulated halos in radial phase space, as well as analyzing the orbital evolution of particles in the cosmological simulations of Fukushige & Makino (2001). In Sect. 5, we estimate the virial radius and other virial parameters of the Virgo cluster to permit the estimation of the Virgo rebound radius in physical units. We discuss our results in Sect. 6.
In a companion paper (Sanchis et al. 2004), we discuss in more detail the origin of the H I-deficiency in galaxies on the outskirts of the Virgo cluster, by analyzing 2D slices of the 4D phase space (right ascension, declination, distance and radial velocity) and comparing them with the cosmological N-body simulations used here.
The N-body simulations used here to find N-body replica of the Virgo
cluster were carried out by Ninin (1999,
see Hatton et al. 2003) in the
context of
the GALICS (Hatton et al.) hybrid
N-body/semi-analytic model of hierarchical galaxy formation.
Here we are basically
interested in the density and velocity fields directly traced by dark matter
particles. The N-body simulation contains 2563 particles of mass
![]() in a box of 150 Mpc size and it is run with a softening
length amounting to a spatial resolution of 29 kpc. The simulation was run for
a flat universe with cosmological parameters
in a box of 150 Mpc size and it is run with a softening
length amounting to a spatial resolution of 29 kpc. The simulation was run for
a flat universe with cosmological parameters
![]() ,
,
![]() ,
and
,
and
![]() .
Once the simulation is run, halos of dark matter are
detected with a "Friends-of-Friends'' (FoF) algorithm (Davis et al. 1985), with a
variable linking length such that the minimum mass of the FoF groups is
.
Once the simulation is run, halos of dark matter are
detected with a "Friends-of-Friends'' (FoF) algorithm (Davis et al. 1985), with a
variable linking length such that the minimum mass of the FoF groups is
![]() (20 particles) at any time step. With this method,
over
(20 particles) at any time step. With this method,
over
![]() halos are detected at the final timestep, corresponding
to the present-day (z=0) Universe. The GALICS halo finder does not
allow halos within halos, so that a cluster, to which is assigned a massive
halo, cannot contain smaller halos within it.
halos are detected at the final timestep, corresponding
to the present-day (z=0) Universe. The GALICS halo finder does not
allow halos within halos, so that a cluster, to which is assigned a massive
halo, cannot contain smaller halos within it.
![\begin{figure}
\par {\includegraphics[width=17.cm,clip]{0155_f1.ps} }
\end{figure}](/articles/aa/full/2004/05/aa0155/img11.gif) |
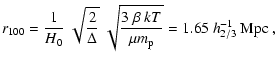
Figure 1:
3D radial phase space plots (radial velocity versus radial distance,
both relative to the halo center and normalized to the virial circular velocity
and radius, respectively) of dark matter particles in a |
| Open with DEXTER | |
Figure 1 shows the radial phase space diagrams, i.e. radial velocity
vs. radial distance, both relative to the halo center, for 4 massive halos. We
have studied the final output of the simulation at z=0. The centers of the
isolated halos shown in Fig. 1 are provided by the simulation output
and correspond to the barycenter of the FoF groups of particles. Radial
distances are normalized to the virial radius
![]() ,
corresponding
to the radius where the mean density is 100 times the critical density of the
Universe. We use r100 instead of r200 because the former represents
better the virial radius in universes with non zero cosmological constant
(Kitayama & Suto 1996). Velocities are normalized to the respective circular
velocities at r100.
,
corresponding
to the radius where the mean density is 100 times the critical density of the
Universe. We use r100 instead of r200 because the former represents
better the virial radius in universes with non zero cosmological constant
(Kitayama & Suto 1996). Velocities are normalized to the respective circular
velocities at r100.
Most of the massive halos in the simulation have a phase space diagram
similar to those for the 4 halos shown in Fig. 1, once scaled to
the virial radius and circular velocity at the virial radius. In particular,
all plots show a virialized region for radii smaller than the r100(although this virialization is not perfect, for example see the excess of
positive velocity particles in the lower left plot, presumably caused by a
large group that is bouncing out of the cluster), and an infalling region with
velocity increasing with radius and asymptotically reaching the (linear) Hubble
flow. One clearly notices groups or small clusters of particles in the outer
regions (e.g. at
r = 3 r100 in the upper right plot), which display
Fingers of God patterns in phase space. The material within 1 or
2 r100 that bounces out of the cluster should form a pattern symmetric
to the infalling pattern relative to the zero velocity line. It is smeared out
by numerical two-body relaxation (S. Colombi informed us that the rebounding
region is seen more sharply when simulations are run with increased potential
softening lengths that reduce the numerical relaxation). The global aspect of
these phase space plots is similar to those shown by Fukushige & Makino
(2001, Fig. 21), at various epochs of their cosmological simulations
(run with a standard -
![]() ,
,
![]() - CDM
cosmology).
- CDM
cosmology).
An inspection of Fig. 1 shows that dark matter particles beyond the virialized core and outside the infalling/expanding zone of phase space can reach 2 or 2.5 times the virial radius, but not any further, and moreover come in groups of particles which appear to be tidally shredded in phase space. In other words, particles that cross through the core of a cluster cannot bounce out beyond 2.5 virial radii.
Now galaxies are not just particles, but arise within particle condensations known as dark matter halos, which should arise as vertically-elongated (Fingers of God) particle condensations in phase space, and therefore ought to avoid the fairly sparse regions of phase space where the outermost outgoing particles are seen. The open circles in Fig. 1 indicate the halos without galaxies within them in GALICS. The absence of galaxies within halos is a feature of GALICS for halos that cross a larger one (its galaxies become part of the larger halo). Empty halos can also occur in GALICS for isolated halos in which galaxies have not yet had time to form. The empty halos outside the infalling/expanding region do not extend beyond 1.7 r100 (upper left and lower right panels, with the former possibly a member of the group at 1.9 r100). In contrast, the normal halos (filled circles in Fig. 1) outside the infalling/expanding region do not extend as far from the main halo. The positions of the empty circles in Fig. 1 therefore suggests that halos crossing the main halo do not bounce out further than 1.7 r100.
This maximum rebound radius is consistent with a close inspection of the
right panel of Fig. 20 from Fukushige & Makino (2001), which shows that the largest
rebound radii in one of their cosmological simulations, i.e. the largest radii
of a particle that has experienced at least one pericenter, is 2 Mpc, occurring
at the present epoch, for a cluster whose present-day virial radius
(r200) is at 1.7 Mpc (see their Table 2). Hence for that particular shell,
the rebound radius is only 1.2 times r200 and an even smaller factor
times r178 (the canonical radius for the cosmology used). Given the
![]() cosmology used, for which the spherical infall model yields
scale-free growth, the rebound radius should be proportional to the turnaround
radius, which itself should be proportional to the virial radius, with a time
growth of
cosmology used, for which the spherical infall model yields
scale-free growth, the rebound radius should be proportional to the turnaround
radius, which itself should be proportional to the virial radius, with a time
growth of
![]() (Gott 1975). We checked that the other rebound
radii occurring earlier were even smaller than the scaled expectation of a 2
Mpc radius today.
(Gott 1975). We checked that the other rebound
radii occurring earlier were even smaller than the scaled expectation of a 2
Mpc radius today.
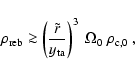
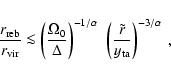
One can confirm this result through simple analytical arguments. First, if one identifies the virial radius to the radius where infalling shells meet the rebounding shells, this will be very close to the rebound radius itself, defined as the radius where a shell reaches its second apocenter (see Fig. 1 of Mamon 1992), so that the rebound radius will be very close to r100.
Moreover, one can estimate the rebound radius for a flat cosmology in the
following manner. To begin, assume that the rebound radius is ![]() times smaller than the turnaround radius (the first apocenter of the shell),
and occurs at a time equal to
times smaller than the turnaround radius (the first apocenter of the shell),
and occurs at a time equal to ![]() times the epoch of turnaround. The
mass within a shell that has reached its second apocenter will be close to but
greater than the mass M within the same shell at turnaround, since some
additional matter will be infalling for the first time. We write this as
times the epoch of turnaround. The
mass within a shell that has reached its second apocenter will be close to but
greater than the mass M within the same shell at turnaround, since some
additional matter will be infalling for the first time. We write this as
| M | = | ||
| = |  |
(2) |
There are two ways one can reach a large rebound radius today: either with a
large ratio of rebound to turnaround radius for a given shell (i.e. ![]() as small as possible, but it cannot be smaller than unity), or with a
turnaround as late as possible (i.e.
as small as possible, but it cannot be smaller than unity), or with a
turnaround as late as possible (i.e. ![]() as small as possible),
which implies a lower turnaround density, hence a lower rebound density (for
given
as small as possible),
which implies a lower turnaround density, hence a lower rebound density (for
given ![]() ).
).
In the first case, the rebound radius could be equal to the initial turnaround
radius, i.e.
![]() .
One then expects that a shell that is
presently at its second apocenter, should have reached turnaround at epoch
t0/3, i.e.
.
One then expects that a shell that is
presently at its second apocenter, should have reached turnaround at epoch
t0/3, i.e.
![]() .
We make use of the reasonably simple
expression for the turnaround radius versus time obtained in the Appendix.
Solving Eq. (A.21) for
.
We make use of the reasonably simple
expression for the turnaround radius versus time obtained in the Appendix.
Solving Eq. (A.21) for ![]() ,
using Eqs. (A.18) and (A.19) for
,
using Eqs. (A.18) and (A.19) for
![]() and
and
![]() ,
yields
,
yields
![]() and
and
![]() .
Eq. (5) and
.
Eq. (5) and
![]() then lead to
then lead to
![]() .
.
Second, in the spirit of the shell rapidly virializing through violent
relaxation at full collapse, one can assume that the shell reaches its second
apocenter right after its first pericenter (full collapse), i.e.
![]() ,
with a radius near half its turnaround radius (
,
with a radius near half its turnaround radius (
![]() ).
This yields (not surprisingly)
).
This yields (not surprisingly)
![]() .
The very best
case requires
.
The very best
case requires
![]() and
and
![]() ,
and leads to
,
and leads to
![]() .
Table 1 summarizes these estimates
of the rebound radius, where
.
Table 1 summarizes these estimates
of the rebound radius, where ![]() and
and
![]() come from
Eqs. (A.18), (A.19) and (A.21) and
come from
Eqs. (A.18), (A.19) and (A.21) and
![]() from Eq. (5). The last four lines are
for the four particle orbits from the simulations of Fukushige & Makino (2001) that rebound
within the last 7 Gyr, and for these
from Eq. (5). The last four lines are
for the four particle orbits from the simulations of Fukushige & Makino (2001) that rebound
within the last 7 Gyr, and for these ![]() is computed so that the epoch
of the second apocenter is the present time, hence the epoch of turnaround is
is computed so that the epoch
of the second apocenter is the present time, hence the epoch of turnaround is
![]() .
.
Table 1: Rebound radius in different scenarios.
Although, the uncertain effects of relaxation as the shell crosses through the
virialized region lead to uncertain values of the ratios of rebound to
turnaround radius (![]() )
and time (
)
and time (![]() ), in the most
favorable spherical infall model, the rebound radius cannot be greater than
2.5 times the virial radius. The cosmological simulations of Fukushige & Makino
suggest rebound radii of order of r100, but recall that they are for a
different cosmology (
), in the most
favorable spherical infall model, the rebound radius cannot be greater than
2.5 times the virial radius. The cosmological simulations of Fukushige & Makino
suggest rebound radii of order of r100, but recall that they are for a
different cosmology (
![]() ). The use of real
simulations has the added advantage of incorporating the effects of two-body
encounters that can push material beyond the theoretical rebound radius.
However, it is not always easy to distinguish in a given snapshot of phase
space (e.g. Fig. 1) the material that is bouncing out of a structure
with material that is infalling for the first time (except that the former
particles are in halos without galaxies), and the analysis of particle
histories, done for the simulations of Fukushige & Makino, is beyond the scope
of this paper for the GALICS simulations.
). The use of real
simulations has the added advantage of incorporating the effects of two-body
encounters that can push material beyond the theoretical rebound radius.
However, it is not always easy to distinguish in a given snapshot of phase
space (e.g. Fig. 1) the material that is bouncing out of a structure
with material that is infalling for the first time (except that the former
particles are in halos without galaxies), and the analysis of particle
histories, done for the simulations of Fukushige & Makino, is beyond the scope
of this paper for the GALICS simulations.
For the application of results of Sect. 4 to the Virgo cluster, we require an
estimate of the virial radius of the cluster. We estimate r100 through the
large-scale X-ray observations of the Virgo cluster
obtained with the ROSAT All-Sky Survey by Schindler et al. (1999).
The peak of the X-ray emission in Virgo coincides with the position of the
giant elliptical M 87, and we use the integrated mass profile around
M 87
obtained by Schindler et al. to derive the virial radius.
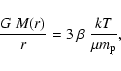
With their isothermal approximation for the total mass profile (their
Fig. 11a), M(r)/r is independent of radius for
![]() and also of the
assumed distance to Virgo, yielding
and also of the
assumed distance to Virgo, yielding
The Virgo cluster is believed to have a complex structure, as it may be
composed of several subclusters (Binggeli et al. 1987) around the elliptical galaxies
M 87 (NGC 4486), M 86 (NGC 4406), and
M 49 (NGC 4472). The virial radius of
![]() is such that the important substructure
surrounding M 86 is well within it, at a distance of 0.22 (projected)
and 0.42 (3D) times r100
of M 87. Similarly, the important substructure
around M 49 lies just within the virial radius, at a distance of 0.78
(projected) and 0.84 (3D) times the virial radius of M 87. Among the
other Messier elliptical galaxies in Virgo, which all have fairly secure distances,
M 60 is well within the virial radius, M 89 lies just at the
virial radius, while M 59 is outside.
is such that the important substructure
surrounding M 86 is well within it, at a distance of 0.22 (projected)
and 0.42 (3D) times r100
of M 87. Similarly, the important substructure
around M 49 lies just within the virial radius, at a distance of 0.78
(projected) and 0.84 (3D) times the virial radius of M 87. Among the
other Messier elliptical galaxies in Virgo, which all have fairly secure distances,
M 60 is well within the virial radius, M 89 lies just at the
virial radius, while M 59 is outside.
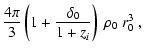
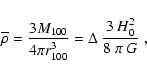
Analyzing the X-ray emission of the intra-cluster gas, Schindler et al. (1999) found that the M 49 subcluster is 2.4 times less massive than the M 87 subcluster. The ratio of masses between the M 87 and the M 86 subclusters is even larger (Böhringer et al. 1994). It therefore appears that the structure surrounding M 87 is by far the most massive component in the Virgo cluster, and it is not a bad approximation to choose a single halo to represent the cluster, so we can apply the results of Sect. 4.
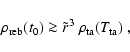
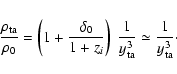
The analysis of Sect. 4 indicates that the maximum rebound
radius is between 1 and 2.5 times the virial radius. Given the virial radius
of 1.65 Mpc for the Virgo cluster, which we derived in Sect. 5,
and the maximum rebound radius derived in Sect. 4, galaxies passing
through the Virgo cluster core in the past cannot lie further than
![]() Mpc from the cluster center.
Mpc from the cluster center.
Balogh et al. (2000) found that a very significant fraction of particles at a distance between 1 and 2 r200 from the centres of cosmologically simulated clusters have passed through the main body ( r < r200) of a cluster progenitor at some earlier epoch. Note that although the analysis of Balogh et al. was performed in terms of r200, they would have very probably gotten similar results had they scaled their clusters and progenitors with r100 instead. As mentioned in Sect. 1, it is not clear from their analysis if particles can escape beyond 2 r200 or even beyond, say, only 1.5 r200. Also, it is easier to displace out to large distances particles rather than large groups of particles representing a galaxy (or subhalo). In any event, the result of Balogh et al. is consistent with our analysis of Sect. 4.
An examination of Fig. 2 of Solanes et al. (2002) indicates ![]() H I-deficient galaxies lying between 9 and 30 Mpc from the Local Group, and in
particular galaxies at 10 and 28 Mpc from the Local Group, whose distance error
bars do not reach the wide range of distances to the Virgo cluster found in
the literature (14 Mpc by Ciardullo et al. 1998 to 21 Mpc by Ekholm et al. 2000).
Therefore, it appears very difficult to explain such H I-deficient galaxies
over 5 Mpc in front or behind the cluster center as having crossed through the
center of the cluster and bounced out if their distance estimates are accurate.
This would suggest that the H I-deficient galaxies on the outskirts of the
Virgo cluster have not had their interstellar gas ram pressure stripped by the
intracluster diffuse hot gas.
H I-deficient galaxies lying between 9 and 30 Mpc from the Local Group, and in
particular galaxies at 10 and 28 Mpc from the Local Group, whose distance error
bars do not reach the wide range of distances to the Virgo cluster found in
the literature (14 Mpc by Ciardullo et al. 1998 to 21 Mpc by Ekholm et al. 2000).
Therefore, it appears very difficult to explain such H I-deficient galaxies
over 5 Mpc in front or behind the cluster center as having crossed through the
center of the cluster and bounced out if their distance estimates are accurate.
This would suggest that the H I-deficient galaxies on the outskirts of the
Virgo cluster have not had their interstellar gas ram pressure stripped by the
intracluster diffuse hot gas.
An alternative explanation to the presence on the outskirts of clusters of H I-deficient spirals, as well as to the decreased star formation rates and redder colours of galaxies in these regions, relative to field galaxies, is that the three effects of H I removal, decreased star formation and redder colours, all intimately linked, may be caused by a significant enhancement of massive groups of galaxies at the outskirts of clusters, as expected from the statistics of the primordial density field (Kaiser 1984) applied to small groups versus rich clusters (Mamon 1995). If this is the case, we would then expect a correlation between H I-deficiency and X-ray emission from the intragroup gas. However, while tidal effects, which to first order depend on mean density, regardless of orbit eccentricity (Mamon 2000), are similar between less massive groups and more massive clusters, ram pressure stripping effects, which also depend on the squared velocity dispersion of the environment, will be much reduced in groups relative to clusters (e.g. Abadi et al. 1999).
In the companion paper (Sanchis et al. 2004), we consider different explanations to the origin of the H I-deficiency of these outlying galaxies: 1) incorrect distances, so these objects would in fact lie close enough to the cluster core to be within the rebound radius and their gas could have been removed by ram pressure stripping, 2) incorrect estimation of the H I-deficiencies and 3) tidal perturbations (stripping or heating) by nearby companions or within groups.
Acknowledgements
We wish to thank Stéphane Colombi, Yehuda Hoffman, and Ewa
okas for useful discussions, François Bouchet, Bruno Guiderdoni and coworkers for kindly providing us with their N-body simulations, and Jeremy Blaizot for answering our technical questions about the design and access to the simulations. We also thank an anonymous referee for helpful comments. TS acknowledges hospitality of the Institut d'Astrophysique de Paris where most of this work was done, and she and GAM acknowledge Ewa
In this appendix, we
compute the parameters of shells at turnaround, i.e. reaching their
first apocenter, in a
![]() CDM Universe without quintessence (wQ=-1).
CDM Universe without quintessence (wQ=-1).
In a non-quintessential
Universe with a cosmological constant, the equation of motion of a shell
of matter is
The equation of motion can then be easily integrated to yield the energy
equation
The turnaround radius is obtained by solving for
![]() ,
i.e. solving
,
i.e. solving
The time of turnaround is then obtained by integrating equation (A.14)
and writing
u = (1+zi) y, yielding
![\begin{displaymath}H_i^2 = H_0^2~\left [\Omega_0~(1+z_i)^3 + \lambda_0\right] .
\end{displaymath}](/articles/aa/full/2004/05/aa0155/img71.gif)

![\begin{displaymath}{2~E \over H_i^2 r_i^2} = {{\dot {u_i}}^2 \over H_i^2} - \left
[(1+\delta_i)~\Omega_i + \lambda_i \right ] \ .
\end{displaymath}](/articles/aa/full/2004/05/aa0155/img76.gif)
![$\displaystyle \left [1+{\lambda_0\over\Omega_0}~(1+z_i)^{-3} \right ]^{-1}
= 1 - \lambda_i.$](/articles/aa/full/2004/05/aa0155/img84.gif)

![$\displaystyle \phi = \cos^{-1} \sqrt{{729\over 500}~\left
[{\left(1-\Omega_0\right)/\Omega_0 \over
\delta_0^3} \right ]},$](/articles/aa/full/2004/05/aa0155/img98.gif)
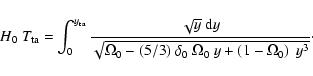
![\begin{displaymath}{H_i~T_{\rm ta} \over \left (1+z_i\right)^{3/2}} =
\int_0^{y_...
...left [\left
(1-\Omega_0\right)/ \Omega_0 \right ]~y^3}}
\cdot
\end{displaymath}](/articles/aa/full/2004/05/aa0155/img100.gif)