 |
Figure 1:
|
| Open with DEXTER | |
In the text
 |
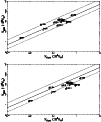
Figure 2: CO(2-1) versus CO(1-0) corrected from the effect of different beam sizes. The straight line corresponds to line emission equality. |
| Open with DEXTER | |
In the text
 |
Figure 3:
|
| Open with DEXTER | |
In the text
 |
Figure 4:
|
| Open with DEXTER | |
In the text
 |
Figure 5:
|
| Open with DEXTER | |
In the text
 |
Figure 6:
|
| Open with DEXTER | |
In the text
 |
Figure 7:
|
| Open with DEXTER | |
In the text
![\begin{figure}
\par\includegraphics[width=16cm,clip]{2615.f9.eps}\end{figure}](/articles/aa/full/2003/49/aa2615/Timg235.gif) |
Figure 8: CO(1-0) and CO(2-1) emission lines observed with the IRAM 30 m telescope. On the Y-axis, main beam temperature (in mK) versus velocity (in km s-1) on the X-axis. |
| Open with DEXTER | |
In the text