
A&A 412, L29-L32 (2003)
DOI: 10.1051/0004-6361:20031676
N. Kanekar 1 - F. H. Briggs 2
1 - Kapteyn Institute, University of Groningen, Postbus 800, 9700 AV Groningen,
The Netherlands
2 - RSAA, The Australian National University, Mount Stromlo Observatory, Cotter Road, ACT 2611, Australia
Received 7 October 2003 / Accepted 31 October 2003
Abstract
We have used the Westerbork Synthesis Radio Telescope to
detect HI 21 cm absorption at
in the gravitational lens system towards
PMN J0134-0931. The 21 cm profile has two broad components, with peak optical depths of
 and
and
 ,
at heliocentric redshifts
,
at heliocentric redshifts
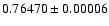 and
and
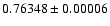 ,
respectively. The redshift of the
stronger component matches that of CaII H and K absorption detected earlier.
The absorption has a total velocity width of
,
respectively. The redshift of the
stronger component matches that of CaII H and K absorption detected earlier.
The absorption has a total velocity width of  500 km s-1 (between nulls) and
an equivalent width of
500 km s-1 (between nulls) and
an equivalent width of
 km s-1. This would imply a total HI column density
of
km s-1. This would imply a total HI column density
of
 cm-2, for a spin temperature of 200 K
and a covering factor of unity. The high estimated HI column density is
consistent with the presence of large amounts of dust at the lens redshift;
the intervening dust could be responsible for the extremely red colour
of the background quasar.
cm-2, for a spin temperature of 200 K
and a covering factor of unity. The high estimated HI column density is
consistent with the presence of large amounts of dust at the lens redshift;
the intervening dust could be responsible for the extremely red colour
of the background quasar.
Key words: galaxies: individual: PMN J0134-0931 - gravitational lensing - radio lines - ISM
The
 radio-loud quasar PMN J0134-0931 is an exceedingly interesting object.
Its radio continuum consists of at least 6 components, with a maximum image
separation of 700 mas (Winn et al. 2002, W02; Winn et al. 2003, W03). Five of these
images (A-E) have the same spectral index and a curved arc of emission is seen between
A and B. These properties caused W02 to argue that the object is a
gravitationally lensed system. Similarly, Gregg et al. (2002) used the multiplicity
of components in a near-IR image as well as the high inferred source luminosity as
evidence for lensing. Interestingly enough, PMN J0134-0931 is only the second lens of galactic
mass to show an image multiplicity greater than four; the other such lens is the
six-component system towards CLASS B1359+154 (Rusin et al. 2001).
radio-loud quasar PMN J0134-0931 is an exceedingly interesting object.
Its radio continuum consists of at least 6 components, with a maximum image
separation of 700 mas (Winn et al. 2002, W02; Winn et al. 2003, W03). Five of these
images (A-E) have the same spectral index and a curved arc of emission is seen between
A and B. These properties caused W02 to argue that the object is a
gravitationally lensed system. Similarly, Gregg et al. (2002) used the multiplicity
of components in a near-IR image as well as the high inferred source luminosity as
evidence for lensing. Interestingly enough, PMN J0134-0931 is only the second lens of galactic
mass to show an image multiplicity greater than four; the other such lens is the
six-component system towards CLASS B1359+154 (Rusin et al. 2001).
CaII H and K lines have been detected towards PMN J0134-0931, at
 (Hall et al. 2002); the lens is thus likely to be at this redshift.
The CaII absorption is very strong, with rest frame equivalent width 5.3Å, similar to that seen in the lens B0218+357 (Browne et al. 1993). Further,
the quasar is highly reddened in optical wavebands, with
(Hall et al. 2002); the lens is thus likely to be at this redshift.
The CaII absorption is very strong, with rest frame equivalent width 5.3Å, similar to that seen in the lens B0218+357 (Browne et al. 1993). Further,
the quasar is highly reddened in optical wavebands, with
 (Gregg et al. 2002); this suggests the presence of large amounts of dust, either in
the host galaxy of the quasar or in the lensing galaxy. While the differential
extinction of the quasar images suggests that at least some of the reddening
is due to dust in the absorber, it has so far not been possible to conclusively
determine the location of the dust. Assuming the dust is at
z = 0.7645 implies
E(B-V) = 1.315, i.e. a visual extinction
(Gregg et al. 2002); this suggests the presence of large amounts of dust, either in
the host galaxy of the quasar or in the lensing galaxy. While the differential
extinction of the quasar images suggests that at least some of the reddening
is due to dust in the absorber, it has so far not been possible to conclusively
determine the location of the dust. Assuming the dust is at
z = 0.7645 implies
E(B-V) = 1.315, i.e. a visual extinction
 (Hall et al. 2002). In
conjunction with the strong CaII lines, this would suggest that the lens is a
gas-rich, late-type galaxy.
(Hall et al. 2002). In
conjunction with the strong CaII lines, this would suggest that the lens is a
gas-rich, late-type galaxy.
More recently, Keeton & Winn (2003) have come up with the first quantitative model
of the lensing system that explains most of its observed properties. The
background source is assumed to have two components and the lensing system
to consist of two galaxies.
The observed 5 components A-E are then the images of one of the background sources and
component F is an image of the second, with the remaining two images of the
latter source too faint for detection. The model is supported by new
high-resolution radio and optical observations (W03), which found
that F has a different spectral index from images A-E. These
observations also showed that the observed large sizes of components C and E
are not intrinsic but instead arise due to scatter broadening at the lower
frequencies. Finally, W03 find marginal evidence for a detection of
the two lens galaxies in Hubble Space Telescope (HST) images of the system; Keeton & Winn (2003) predict these to be spiral galaxies, each with a velocity dispersion of about
120 km s-1, and a projected separation of 0.4''.
We present, in this Letter, Westerbork Synthesis Radio Telescope (WSRT) observations
of HI 21 cm absorption at
towards PMN J0134-0931.
The usual association of dust with high column densities of neutral gas
confirms that the dust is likely to be concentrated in the intervening
lens system. We describe the WSRT observations and data analysis in
Sect. 2; the spectra, results and models are presented and
discussed in Sect. 3.
PMN J0134-0931 was observed with the UHF-High band of the WSRT on March 28 and
31 and July 5 and 7, 2003, with the DZB correlator as the backend.
A single 5 MHz IF band was used on all occasions, sub-divided into
1024 channels and centred at an observing frequency of 805 MHz; this yielded
a frequency resolution of 4.88 kHz, i.e. a velocity resolution of
1.8 km s-1. The standard calibrators 3C48 and 3C147 were used to calibrate
the absolute flux density scale at all observing epochs; their adopted flux
densities are on the scale of Baars et al. (1977). The system bandpass was
calibrated with observations of 3C48, 3C147, 3C454.3 or 3C138. All fourteen
WSRT antennas were available for the observations in all observing runs. The total
on-source time was 17.6 hours.
The data were converted from the telescope format to FITS and then analyzed
in classic AIPS, using standard techniques. Data from the March and July
runs were analyzed separately and self-calibrated independently. Spectra from the
two epochs were corrected to the heliocentric frame outside AIPS and then averaged
together. The flux density of PMN J0134-0931 was measured to be  mJy on all
observing runs.
mJy on all
observing runs.
We note that two strong, narrow RFI spikes were found to be present not far from the expected location of the redshifted 21 cm line; these were seen in both the March and July runs, at the same observing frequencies (i.e. shifted heliocentric frequencies). The high initial spectral resolution of the observations limited the effect of these spikes on neighbouring channels; the data were also Hanning smoothed in frequency, to further reduce spectral ringing.
The final WSRT HI 21 cm spectrum towards PMN J0134-0931 is shown in Fig. 1;
this has been boxcar smoothed by three channels (and re-sampled) and has a
velocity resolution of 10.8 km s-1 and an RMS noise of 4.1 mJy.
The redshift of the CaII lines (Hall et al. 2002) is shown below the spectrum,
with error bars.
Two deep features can be immediately identified in the spectrum of Fig. 1,
with their peak optical depths at heliocentric frequencies of
 and
and
 MHz, i.e. heliocentric redshifts of
and
respectively.
The redshift of the first of these features agrees with that of the CaII lines, within the
errors. This is also the deeper of the two HI components, with a peak optical
depth of
;
the second feature has a peak optical depth of
.
The HI absorption is extremely wide, with a total velocity
spread (between nulls) of 500 km s-1. This is similar to the width of the
CaII lines, which have
MHz, i.e. heliocentric redshifts of
and
respectively.
The redshift of the first of these features agrees with that of the CaII lines, within the
errors. This is also the deeper of the two HI components, with a peak optical
depth of
;
the second feature has a peak optical depth of
.
The HI absorption is extremely wide, with a total velocity
spread (between nulls) of 500 km s-1. This is similar to the width of the
CaII lines, which have
 km s-1 (Hall et al. 2002).
The equivalent width of the 21 cm profile is
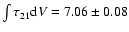 km s-1. This is is higher than that measured in either of
the other gravitational lenses in which HI absorption has so far been detected,
B0218+357 (
km s-1. This is is higher than that measured in either of
the other gravitational lenses in which HI absorption has so far been detected,
B0218+357 (
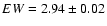 km s-1; Kanekar et al. 2003) and PKS 1830-21
(
km s-1; Kanekar et al. 2003) and PKS 1830-21
(
 km s-1; Chengalur et al. 1999). The large equivalent width
implies a very HI column density
km s-1; Chengalur et al. 1999). The large equivalent width
implies a very HI column density
 cm-2 (e.g. Kanekar & Chengalur 2003), where f is the
covering factor of the absorber and
cm-2 (e.g. Kanekar & Chengalur 2003), where f is the
covering factor of the absorber and  ,
its spin temperature; this is well into the
range observed in damped Lyman-
,
its spin temperature; this is well into the
range observed in damped Lyman- systems (e.g. Wolfe et al. 1986).
We note that a spin temperature of 200 K is typical of spiral galaxies,
both locally (Braun & Walterbos 1992) and at low redshift (Kanekar & Chengalur 2003).
Of course, the above estimate of
systems (e.g. Wolfe et al. 1986).
We note that a spin temperature of 200 K is typical of spiral galaxies,
both locally (Braun & Walterbos 1992) and at low redshift (Kanekar & Chengalur 2003).
Of course, the above estimate of
 gives the sum of HI column densities
towards all the different source components giving rise
to the 21 cm absorption; it is not possible to measure the column
density towards individual source components with the available data.
gives the sum of HI column densities
towards all the different source components giving rise
to the 21 cm absorption; it is not possible to measure the column
density towards individual source components with the available data.
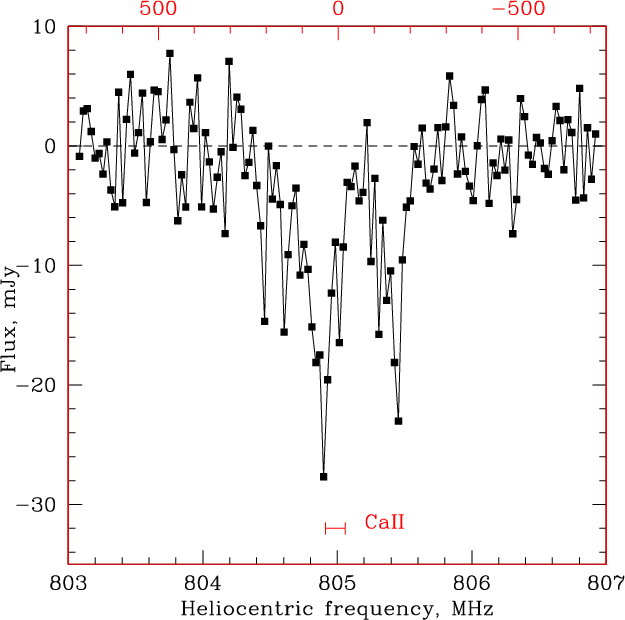 |
Figure 1:
Final WSRT HI 21 cm spectrum towards PMN J0134-0931. The x and y axes are
heliocentric frequency (in MHz) and flux density (in mJy) respectively;
the top axis is heliocentric velocity (in km s-1), relative to
z = 0.7645.
The spectrum has been boxcar smoothed by 3 channels and has a velocity
resolution of 10.8 km s-1 and an RMS noise of 4.1 mJy.
|
| Open with DEXTER | |
The extremely high estimated HI column density implies a high dust content
in the
lens and explains the observed reddening in the optical
images (Gregg et al. 2002; W03). Assuming that the molecular hydrogen column density is
roughly equal to
,
the total hydrogen column density
 cm-2 (again assuming
 K
and a covering factor of unity). This implies
K
and a covering factor of unity). This implies
 ,
using a
Galactic dust to gas ratio; further assuming a Galactic extinction law
(
,
using a
Galactic dust to gas ratio; further assuming a Galactic extinction law
(
 ;
Binney & Merrifield 1998) results in a visual extinction
;
Binney & Merrifield 1998) results in a visual extinction
 .
Of course, it is likely that the 21 cm absorption profile (and hence the
estimated column density) contains contributions from more than one
line of sight, with variable optical depth and kinematics across the
complex lensing image; it is thus not possible to estimate the
visual extinction towards individual source components.
.
Of course, it is likely that the 21 cm absorption profile (and hence the
estimated column density) contains contributions from more than one
line of sight, with variable optical depth and kinematics across the
complex lensing image; it is thus not possible to estimate the
visual extinction towards individual source components.
![\begin{figure}
\par\mbox{\subfigure[]{\epsfig{file=Fj071_fig2a.ps,width=2.35in,h...
...{\epsfig{file=Fj071_fig2c.ps,width=2.35in,height=2.35in,clip= } }}\end{figure}](/articles/aa/full/2003/48/aafj071/img31.gif) |
Figure 2:
Disk galaxy models for the absorption profile. Central panel (b):
The six principal image components (A-F) of the 1.7 GHz VLBA image of
W03 (grey-scale), with two sets of ellipses drawn to indicate the
orientation and inclination of the intervening model disk galaxies.
The galaxy centre is marked by a + and a  for Models I and II,
respectively;
the two filled squares indicate the mass centroids of the two mass
lens model of Keeton & Winn (2003). Left panel (a): 21 cm spectrum derived
from Model I (heavy line) superimposed on the observed 21 cm profile (dashed line).
Right panel (c): 21 cm spectrum derived from Model II (heavy line) superimposed
on the observed 21 cm profile (dashed line). In both cases, the zero of the velocity scale
corresponds to 805 MHz (z=0.76448, heliocentric). See text for discussion.
for Models I and II,
respectively;
the two filled squares indicate the mass centroids of the two mass
lens model of Keeton & Winn (2003). Left panel (a): 21 cm spectrum derived
from Model I (heavy line) superimposed on the observed 21 cm profile (dashed line).
Right panel (c): 21 cm spectrum derived from Model II (heavy line) superimposed
on the observed 21 cm profile (dashed line). In both cases, the zero of the velocity scale
corresponds to 805 MHz (z=0.76448, heliocentric). See text for discussion.
|
| Open with DEXTER | |
The lens towards PMN J0134-0931 creates a complex radio image of six image components (A-F), with
a maximum angular separation of 681 mas (W02). Components A and B are seen
to connect in a section of lensing arc at faint levels in the 1.7 GHz VLBA image
(W03). Components C and E appear to be strongly scatter broadened at frequencies
below 5 GHz and are almost undetected in VLBA images at 1.7 GHz (W02; W03), as
they are over-resolved by even the shortest baselines of the VLBA. Note, however, that
their flux must be present in the integral flux density measured in our spectrum
at 805 MHz; further, they provide additional lines of sight through the
absorber. Next, while component F has a significantly steeper spectrum than the
other five components, its total flux density is only  mJy at 1.7 GHz;
it is thus quite unlikely to have sufficient flux density at 805 MHz to give rise
to either of the two main 21 cm components. Further, while it is possible that the
some of the wide, weak absorption arises against this component, this would require a
fairly high optical depth (
mJy at 1.7 GHz;
it is thus quite unlikely to have sufficient flux density at 805 MHz to give rise
to either of the two main 21 cm components. Further, while it is possible that the
some of the wide, weak absorption arises against this component, this would require a
fairly high optical depth (
 ). The 21 cm absorption is thus most likely to
arise against the brighter components A, B, C and D (and perhaps the arc of radio
emission between A and B), each of which have flux densities
). The 21 cm absorption is thus most likely to
arise against the brighter components A, B, C and D (and perhaps the arc of radio
emission between A and B), each of which have flux densities  100 mJy
at 1.7 GHz. We note that component A also shows evidence for scatter broadening at
frequencies below 5 GHz while D is the most strongly reddened of the source
components; on the other hand, B is the bluest of all components and
shows no evidence for scatter broadening in the VLBA images (W03). This
suggests that there is relatively less dust and gas along the line of sight
to component B; the two main 21 cm features thus appear most likely to arise
from absorption against components A and D.
100 mJy
at 1.7 GHz. We note that component A also shows evidence for scatter broadening at
frequencies below 5 GHz while D is the most strongly reddened of the source
components; on the other hand, B is the bluest of all components and
shows no evidence for scatter broadening in the VLBA images (W03). This
suggests that there is relatively less dust and gas along the line of sight
to component B; the two main 21 cm features thus appear most likely to arise
from absorption against components A and D.
We have explored these possibilities with a simple kinematic model using a differentially rotating disk absorber. The modelling does not produce a unique result, but rather succeeds in demonstrating that a single, massive galaxy could indeed be responsible for the 21 cm absorption profile. If a more complex, multi-galaxy system were to be invoked, there would be ample free parameters to fit the integral spectrum reported here. Further observational progress will require radio interferometry to separate the absorption along different lines of sight.
The philosophy of modelling the 21 cm profile shape is based on the assumption that narrow absorption features occur in the spectrum when a compact, high-surface brightness image of the background radio source "selects'' a small patch from an extended, smooth velocity field of a rotating galaxy. Thus, the two main narrow 21 cm features of Fig. 1 are expected to be associated with specific source components of the background source, once VLBI observations are conducted in the 21 cm line. The modelling uses the source structure obtained from the 1.7 GHz VLBA maps of W03 for the compact radio components, with a scaling in flux to both match the relative flux densities of the components in the higher frequency bands, and still produce the integral flux density measured at 805 MHz by our WSRT observations. The more extended components C and E had to be supplemented with diffuse Gaussian components to account for the flux missing from the VLBA map.
The two models discussed here (and shown in Fig. 2b) are representative
of two broad classes which can
reproduce the observed 21 cm profile. It should be emphasized, however, that neither
class is able to account for all the observations simultaneously, including the
scatter broadening and reddening of different source components. Both models are
axially symmetric, planar
systems with rotation curves that are flat at
 in the outer regions, with a
linear rise from the centre to
in the outer regions, with a
linear rise from the centre to  .
The systemic velocity of the galaxy is offset
from 805 MHz
(z=0.76448) by
.
The systemic velocity of the galaxy is offset
from 805 MHz
(z=0.76448) by
 ,
and the galaxy centroid is specified by the projected
positional offsets
,
and the galaxy centroid is specified by the projected
positional offsets  (west),
  (north) relative to image D. The
HI optical depth profile for each pixel is broadened by a velocity dispersion of
(north) relative to image D. The
HI optical depth profile for each pixel is broadened by a velocity dispersion of
 km s-1 before computing that pixel's contribution to the integral
absorption spectrum.
km s-1 before computing that pixel's contribution to the integral
absorption spectrum.
Models belonging to class I are motivated by the need to inflict heavy reddening on
image D without reddening B, coupled with accounting for the scatter broadening
of A and C. However, this model does not account for the scatter broadening of image
E. The model parameters are: position angle of the receding major axis
 (+p, measured east from north), inclination to sky plane
 ,
,
 km s-1,
 kpc, exponential gas scale height h=0.7 kpc,
 km s-1,
and galaxy position at
km s-1,
and galaxy position at
 mas,
mas,
 mas. In this highly
inclined model, the HI column density measured perpendicular to the galaxy plane is only
mas. In this highly
inclined model, the HI column density measured perpendicular to the galaxy plane is only
 cm-2 in the region that covers components A and C,
but it rises to
cm-2 in the region that covers components A and C,
but it rises to
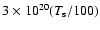 cm-2 for B and D. The high disk
inclination increases the line of sight column densities by an order of magnitude.
The 21 cm spectrum resulting from this model is shown in Fig. 2a.
Here, the two narrow features arise from absorption against A and D;
the extended weak absorption wing out to +300 km s-1 is achieved by tipping
the intervening disk to a high inclination and thickening the HI layer with a
scale height of 700 pc (in the spirit of Briggs et al. 1985 and
Prochaska & Wolfe 1997).
cm-2 for B and D. The high disk
inclination increases the line of sight column densities by an order of magnitude.
The 21 cm spectrum resulting from this model is shown in Fig. 2a.
Here, the two narrow features arise from absorption against A and D;
the extended weak absorption wing out to +300 km s-1 is achieved by tipping
the intervening disk to a high inclination and thickening the HI layer with a
scale height of 700 pc (in the spirit of Briggs et al. 1985 and
Prochaska & Wolfe 1997).
The second, somewhat orthogonal, class of models (of which Model II is an example)
has an infinitesimally thin disk, oriented to cast a shadow on images A, B, C, and E,
thereby accounting for the observed scatter broadening of A, C, and E, but implying that
all would be vulnerable to reddening in contradiction with B being the bluest and
D being the reddest of the images. The model parameters are:
 ,
,
 ,
,
 km s-1,
 kpc, (gas scale height h=0 kpc),
 km s-1, and galaxy position at
 mas,
mas,
 mas.
This model has an exponential radial decline in HI column density, with scale length
1.5 kpc, from a central peak of
mas.
This model has an exponential radial decline in HI column density, with scale length
1.5 kpc, from a central peak of
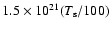 cm-2 measured
perpendicular to the disk plane. The spectrum resulting from the above orientation
is shown in Fig. 2c. Here, the two narrow features arise against
images A and B, while the broad shoulder at positive velocities stems from
absorption against image C and the radio arc connecting A and B.
cm-2 measured
perpendicular to the disk plane. The spectrum resulting from the above orientation
is shown in Fig. 2c. Here, the two narrow features arise against
images A and B, while the broad shoulder at positive velocities stems from
absorption against image C and the radio arc connecting A and B.
The 21 cm absorption line profile at
towards PMN J0134-0931 has two primary
components and a broad weak trough, It has a total velocity width of
500 km s-1 and the largest HI equivalent width so far detected in a
gravitational lens system. The extremely high estimated HI column density
cm-2 suggests that the reddening of the quasar is due to dust in the
lens.
None of the galaxy models that assume a single disk-like absorber have
succeeded in accounting for all the observations, although the models can
roughly reproduce the observed 21 cm absorption profile. Specifically, Model I
in Sect. 3.2 does not account for the observed scatter broadening
of component E while Model II fails to reproduce the fact that D is the reddest
and B, the bluest, of all images. Of course, the large 21 cm velocity width
of 500 km s-1 could also arise if the absorption occurs in two separate
galaxies. This is in agreement with the suggestion of Keeton & Winn (2003)
that the lensing system consists of two spiral systems. Further, it is
consistent with the HST image of W03 showing marginal detections of two galaxies,
the northern one close to images A, C and E and the southern one near
image D. For example, the northern "galaxy'' in the HST image might
cause the main 21 cm feature and most of the broad, weak absorption, arising
against images A, C, E and the radio arc, while the southern "galaxy''
causes the secondary (blue-shifted) feature (and perhaps some of the broad
trough), through absorption against image D. The present 21 cm data do not
warrant a detailed modelling of such a two-galaxy absorption system as
the number of free parameters is far larger than the number of observational
constraints (especially given that the observed 21 cm profile can be
reproduced with a single disk galaxy model). High resolution radio
interferometric observations at 805 MHz will help refine the kinematic
models and shed more light on the nature of the intervening lens system.
Acknowledgements
We thank Rene Vermeulen for much help with the planning and scheduling of these WSRT service observations. We are also grateful to Josh Winn for providing the 1.7 GHz VLBA image and CC file for use in our modelling. The Westerbork Synthesis Radio Telescope is operated by the ASTRON (Netherlands Foundation for Research in Astronomy) with support from the Netherlands Foundation for Scientific Research (NWO).