 |
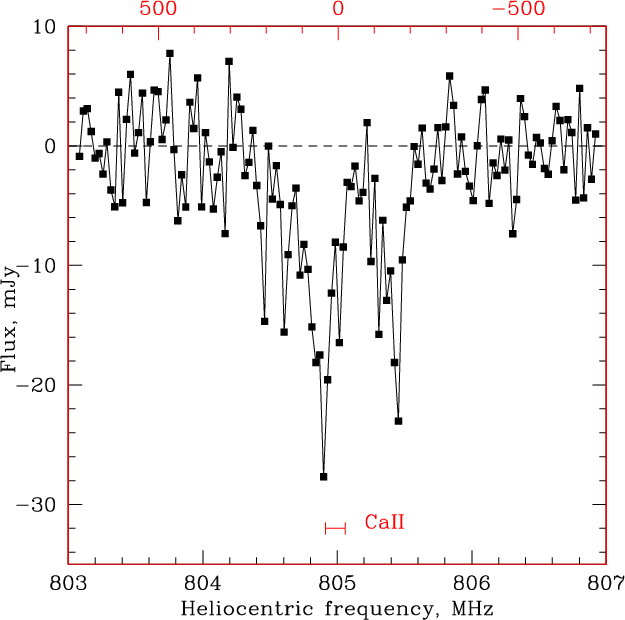
Figure 1:
Final WSRT HI 21 cm spectrum towards PMN J0134-0931. The x and y axes are
heliocentric frequency (in MHz) and flux density (in mJy) respectively;
the top axis is heliocentric velocity (in km s-1), relative to
z = 0.7645.
The spectrum has been boxcar smoothed by 3 channels and has a velocity
resolution of  10.8 km s-1 and an RMS noise of 4.1 mJy. 10.8 km s-1 and an RMS noise of 4.1 mJy.
|
| Open with DEXTER | |
In the text
![\begin{figure}
\par\mbox{\subfigure[]{\epsfig{file=Fj071_fig2a.ps,width=2.35in,h...
...{\epsfig{file=Fj071_fig2c.ps,width=2.35in,height=2.35in,clip= } }}\end{figure}](/articles/aa/full/2003/48/aafj071/img31.gif) |
Figure 2:
Disk galaxy models for the absorption profile. Central panel (b):
The six principal image components (A-F) of the 1.7 GHz VLBA image of
W03 (grey-scale), with two sets of ellipses drawn to indicate the
orientation and inclination of the intervening model disk galaxies.
The galaxy centre is marked by a + and a  for Models I and II,
respectively;
the two filled squares indicate the mass centroids of the two mass
lens model of Keeton & Winn (2003). Left panel (a): 21 cm spectrum derived
from Model I (heavy line) superimposed on the observed 21 cm profile (dashed line).
Right panel (c): 21 cm spectrum derived from Model II (heavy line) superimposed
on the observed 21 cm profile (dashed line). In both cases, the zero of the velocity scale
corresponds to 805 MHz (z=0.76448, heliocentric). See text for discussion.
for Models I and II,
respectively;
the two filled squares indicate the mass centroids of the two mass
lens model of Keeton & Winn (2003). Left panel (a): 21 cm spectrum derived
from Model I (heavy line) superimposed on the observed 21 cm profile (dashed line).
Right panel (c): 21 cm spectrum derived from Model II (heavy line) superimposed
on the observed 21 cm profile (dashed line). In both cases, the zero of the velocity scale
corresponds to 805 MHz (z=0.76448, heliocentric). See text for discussion.
|
| Open with DEXTER | |
In the text