 |
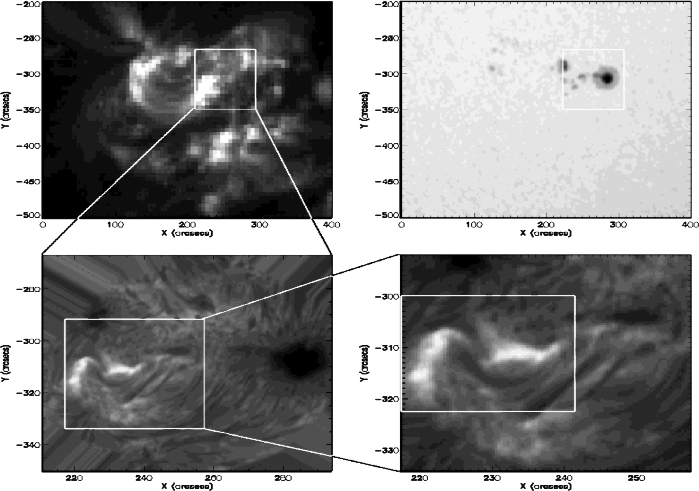
Figure 1:
Identification of analysed regions in NOAA8218.
Upper left panel: EIT 195 Å image taken at 14:51 UT. The SVST
field of view is overlaid
Upper right panel: MDI continuum image taken at 14:50:34 UT. The SVST
field of view is overlaid.
Lower left panel: SVST H |
| Open with DEXTER | |
In the text
| |
Figure 2:
Figure showing the locations of the main features discussed in the text. The flaring region A, and non-flaring region B, are marked on both images. Left panel: G band image at 14:32:30 UT. The two sunspots are denoted X and Y. Thread-like structures between them and close to X are marked. Right panel: H |
| Open with DEXTER | |
In the text
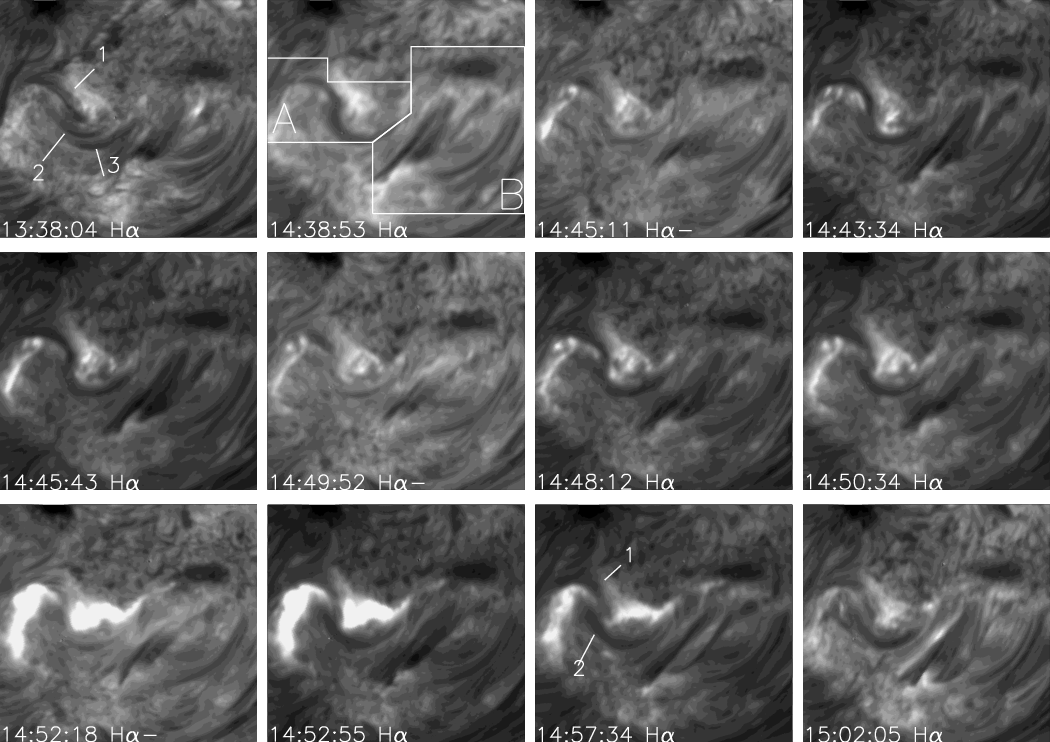 |
Figure 3:
40.5
|
| Open with DEXTER | |
In the text
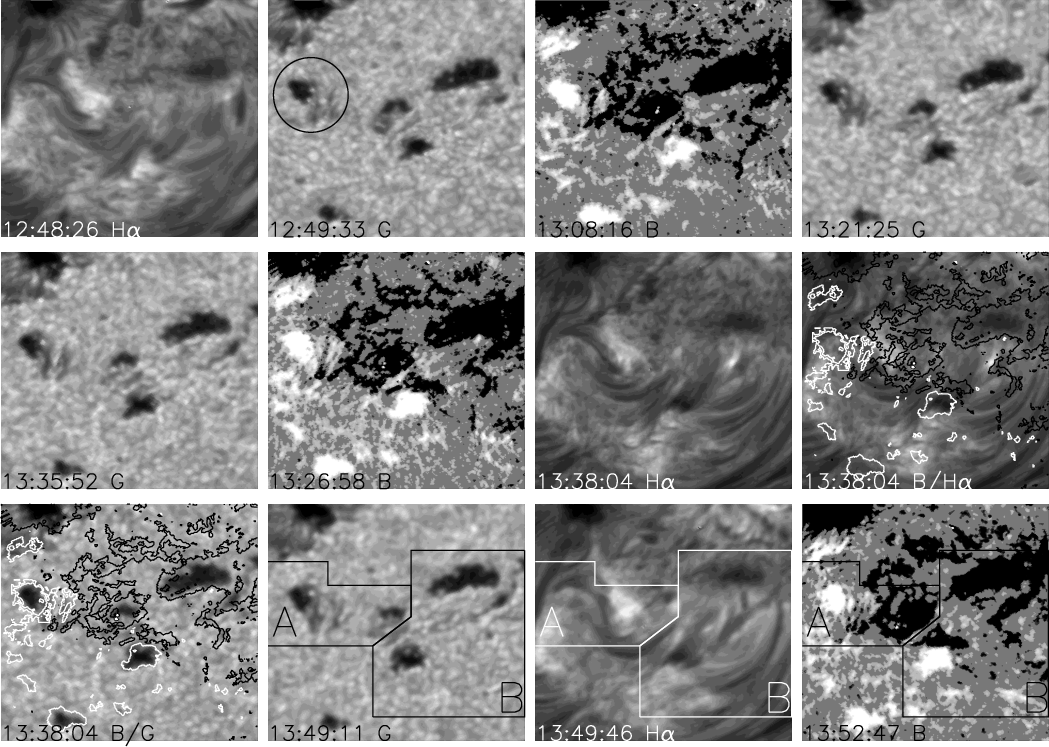 |
Figure 4:
40.5
|
| Open with DEXTER | |
In the text
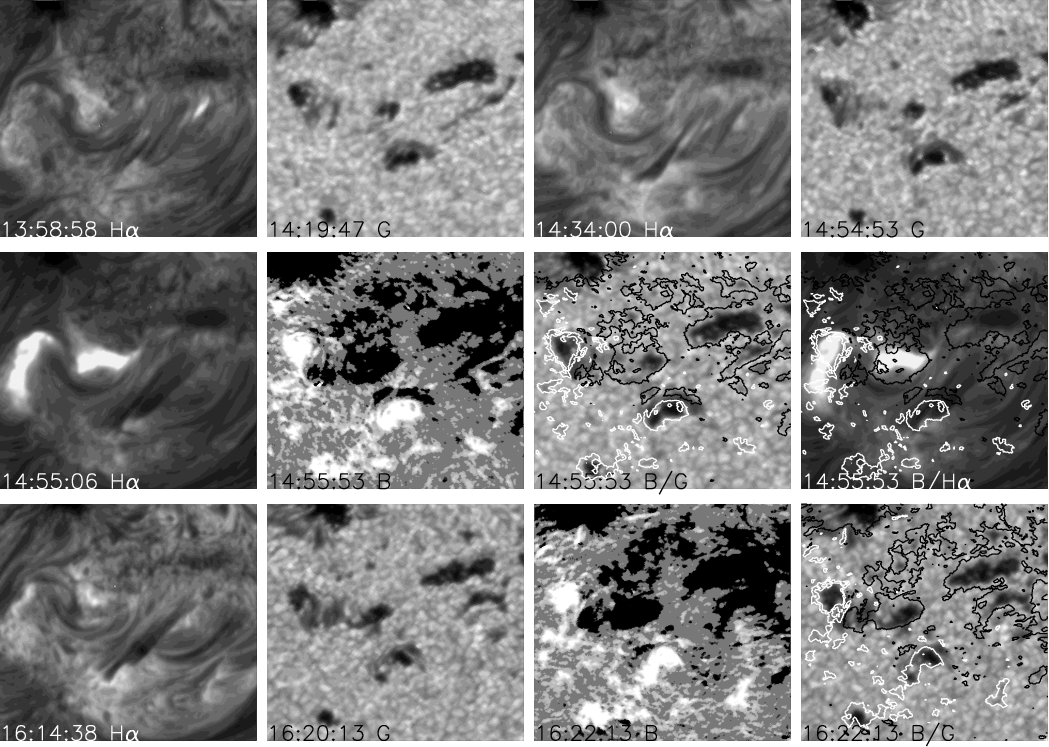 |
Figure 4: continued. |
| Open with DEXTER | |
In the text
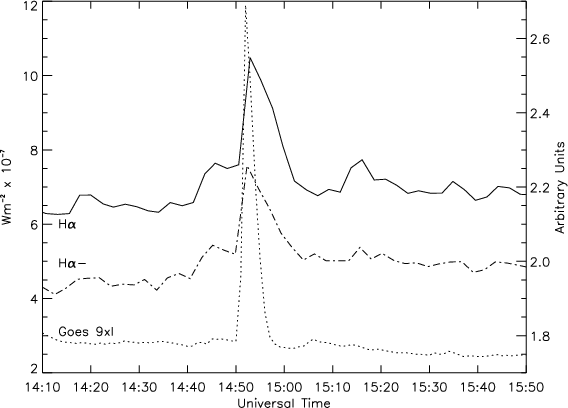 |
Figure 5:
GOES-9 1 min X-ray flux light curves. The left y-axis is in flux units of Wm
|
| Open with DEXTER | |
In the text
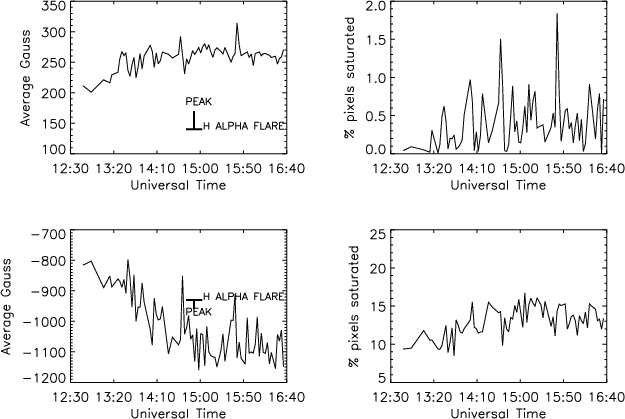 |
Figure 6: Time development of average magnetic flux and the percentage of saturated pixels for the flaring region (A in Fig. 4). Upper left - average Gauss (+ve). Lower left - average Gauss (-ve). Upper right - % of pixels saturated (+ve). Lower right - % of pixels saturated (-ve). |
| Open with DEXTER | |
In the text
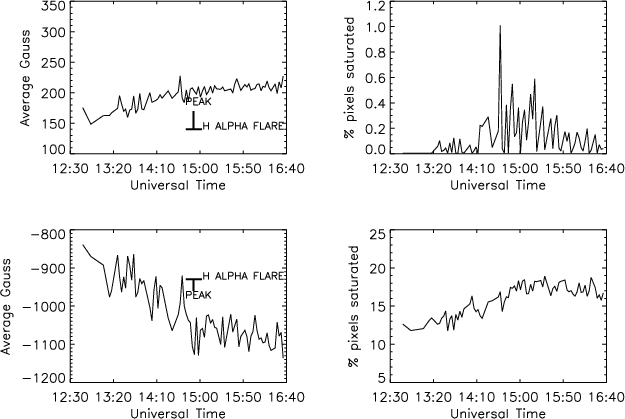 |
Figure 7: Time development of average magnetic flux and the percentage of saturated pixels for the non-flaring region (B in Fig. 4). Upper left - average Gauss (+ve). Lower left - average Gauss (-ve). Upper right - % of pixels saturated (+ve). Lower right - % of pixels saturated (-ve). |
| Open with DEXTER | |
In the text
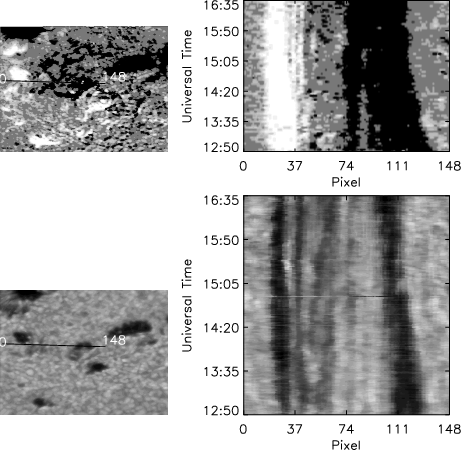 |
Figure 8: Timeslice image showing the movement of RR towards LR (see text). The image on the lower left of the figure is taken from the G-band data at 12:49:33 UT and the magnetogram in the upper left was taken at 12:44:28 UT. Both are 42.2 by 42.2 arcsec in size. The slice-line is overlaid and the starting pixel (0) and ending pixel (148) are also shown. The absicca of the coordinate frame of the right hand plot shows the same pixel position along the slice-line. The ordinate shows the time. |
| Open with DEXTER | |
In the text
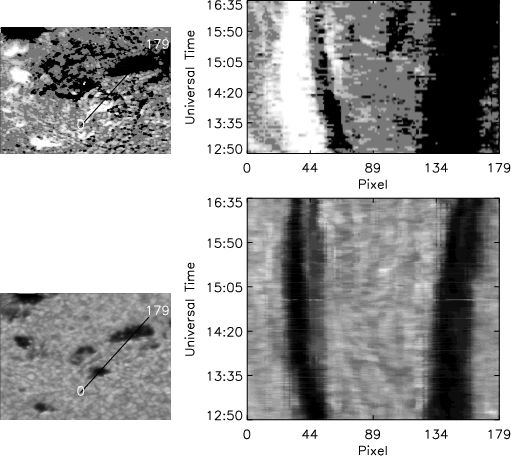 |
Figure 9: Timeslice image showing the separation of the structures in the non-flaring region, B. The G-band image and magnetogram are the same as before. The slice-line is overlaid and the starting pixel (0) and ending pixel (179) are also shown. The absicca of the coordinate frame of the right hand plot shows the same pixel position along the slice-line. The ordinate shows the time. |
| Open with DEXTER | |
In the text
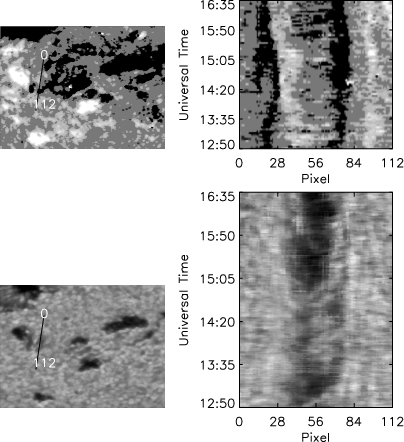 |
Figure 10: Timeslice image showing emerging flux between LR and RR. The G-band image in this figure was taken at 13:35:52 UT and the magnetogram was taken at 13:36:20 UT. The slice-line is overlaid and the starting pixel (0) and ending pixel (112) are also shown. The absicca of the coordinate frame of the right hand plot shows the same pixel position along the slice-line. The ordinate shows the time. |
| Open with DEXTER | |
In the text
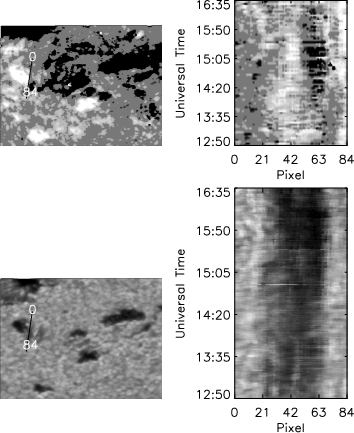 |
Figure 11: Timeslice image showing emerging flux between LR and RR. The G-band image in this figure was taken at 13:35:52 UT and the magnetogram was taken at 13:36:20 UT. The slice-line is overlaid and the starting pixel (0) and ending pixel (84) are also shown. The absicca of the coordinate frame of the right hand plot shows the same pixel position along the slice-line. The ordinate shows the time. |
| Open with DEXTER | |
In the text
| |
Figure 12: Timeslice image showing the movement of the positive and negative polarity spots from SOHO/MDI data. The timeslice covers the SVST observations period and extends much later until around 05:00 UT on May 14th. |
| Open with DEXTER | |
In the text
![\begin{figure}
\par\includegraphics[width=8.8cm,clip]{3354f13.eps}
\end{figure}](/articles/aa/full/2003/45/aa3354/img20.gif) |
Figure 13: Results from the local correlation tracking method. The size of the area is the same as Figs. 3 and 4. The velocity map is plotted and the magnitude of the arrows are proportional to the distance travelled by the corresponding box although the absolute value is arbitrary (see text). The arrowhead gives the direction of motion. The underlying image image is the divergence map. White areas are regions of positive divergence and dark areas are regions of convergence. Contours of the G band dark spots are also overplotted with levels of 0.195% and 0.390%. |
| Open with DEXTER | |
In the text
![\begin{figure}
\par\includegraphics[width=7cm,clip]{3354f14.eps}
\end{figure}](/articles/aa/full/2003/45/aa3354/img21.gif) |
Figure 14: EIT 195 Å image of NOAA 8218 at the time of flare peak intensity (14:50:57 UT). corresponding to the SVST field of view as shown by the box on the EIT image in the upper left hand panel of Fig. 1. An MDI magnetogram has been overlaid to aid in cross identification of features with the SVST dataset. The magnetogram was taken at 14:58:05 UT. Positive polarity regions are denoted by dashed contours and negative polarity regions are denoted by solid contours. |
| Open with DEXTER | |
In the text
![\begin{figure}
\par\includegraphics[width=6cm,clip]{3354f15.eps}
\end{figure}](/articles/aa/full/2003/45/aa3354/img22.gif) |
Figure 15:
SVST H |
| Open with DEXTER | |
In the text
![\begin{figure}
\par\includegraphics[width=8cm,clip]{3354f16.eps}
\end{figure}](/articles/aa/full/2003/45/aa3354/img36.gif) |
Figure 16: Schematic drawing of emerging twisted magnetic flux tube as discussed in the text. |
| Open with DEXTER | |
In the text
![\begin{figure}
\par\includegraphics[width=8.8cm,clip]{3354f17.eps}
\end{figure}](/articles/aa/full/2003/45/aa3354/img38.gif) |
Figure 17: Cartoon of emerging flux/coronal magnetic field reconnection. LR and RR correspond to the footpoints of the twisted structure shown in Fig. 12. Points A and B correspond to the footpoints of the overlying EIT loops. Partial reconnection occurs as shown in the figure The filled circle is located at the reconnection point. After reconnection some of the field lines rooted in A connect to RR and some of the field lines rooted in LR connect to B. The polarities noted from the MDI and SVST magnetograms are shown. The solid lines surrounding LR and RR/B correspond to the contour lines of the EIT brightenings (see Fig. 15). The dashed line represents the location of the SXT brightening. Note that the EIT peak intensity is situated closer to RR than LR (see text for discussion). |
| Open with DEXTER | |
In the text
![\begin{figure}
\par {\hspace*{6mm}\includegraphics[width=7.5cm,clip]{3354f18a.ep...
...
\par\vspace*{5mm}
\includegraphics[width=8.8cm,clip]{3354f18b.eps}
\end{figure}](/articles/aa/full/2003/45/aa3354/img39.gif) |
Figure 18: Evidence for brightenings at the coronal loop footpoints. Upper panel: EIT 195 Å image taken at 14:51 UT. Area 1 is around the flare region and Area 2 is around the other footpoint of the coronal loop. The dotted region marks the control area with the most significant brightening (see text). Lower panel: Time profiles of the intensities in Areas 1 and 2. |
| Open with DEXTER | |
In the text