 |
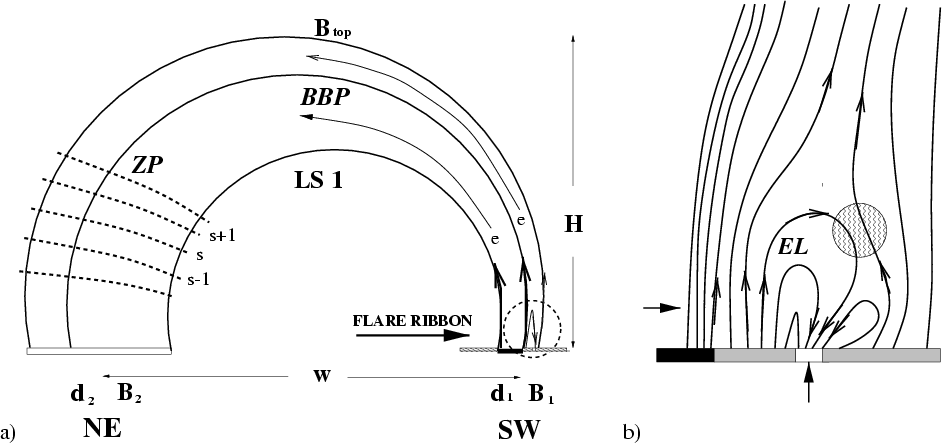
Figure 1: Source model from optical, X-ray and radio measurements (see Paper I). a) The loop LS1 is the main source of BBP and ZP: fast electron streams exciting BBP are injected at the SW footpoint. ZP stripes arise at the DPR levels (stippled) in the NE part of LS1. b) Enlargement of the encircled SW range: the leading spot in conflict with the emerging parasitic polarity loop (EL). The wavy circle is a site of reconnection and electron acceleration. |
| Open with DEXTER | |
In the text
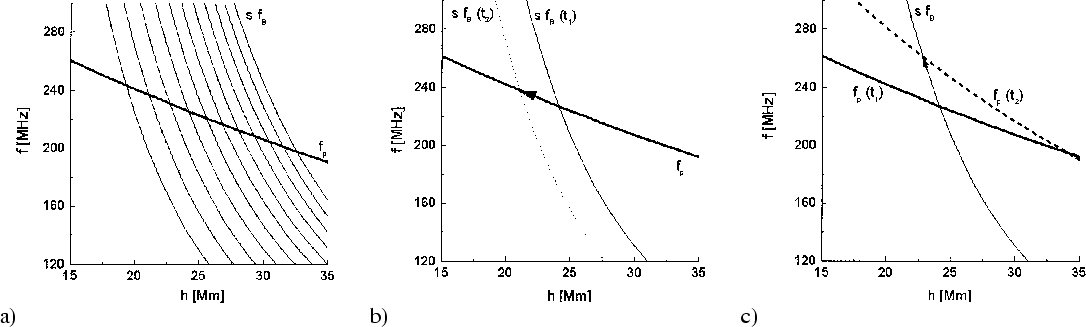 |
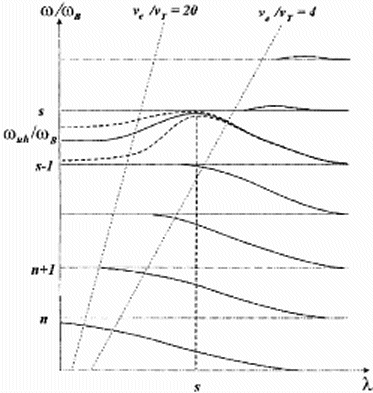
Figure 2:
The DPR source of ZP:
a) gyroharmonics sfB and plasma frequency |
| Open with DEXTER | |
In the text
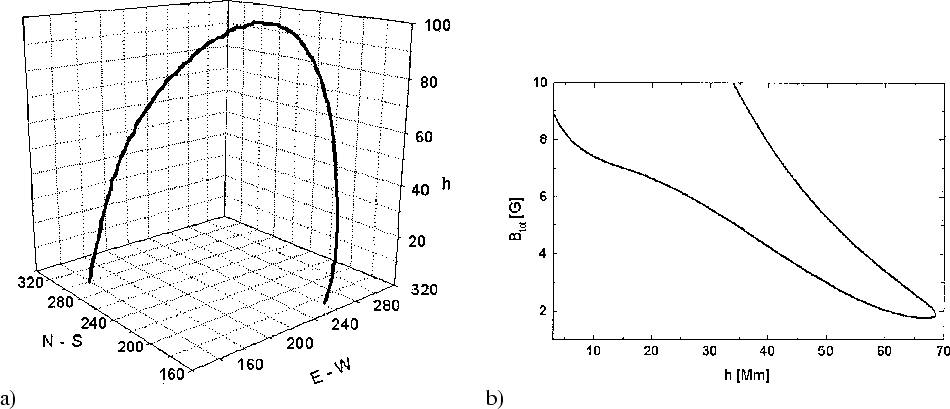 |
Figure 3: Magnetic field line selected from extrapolated LS1 (see Fig. 2 of Paper I): a) perspective view; b) height dependence of field strength. |
| Open with DEXTER | |
In the text
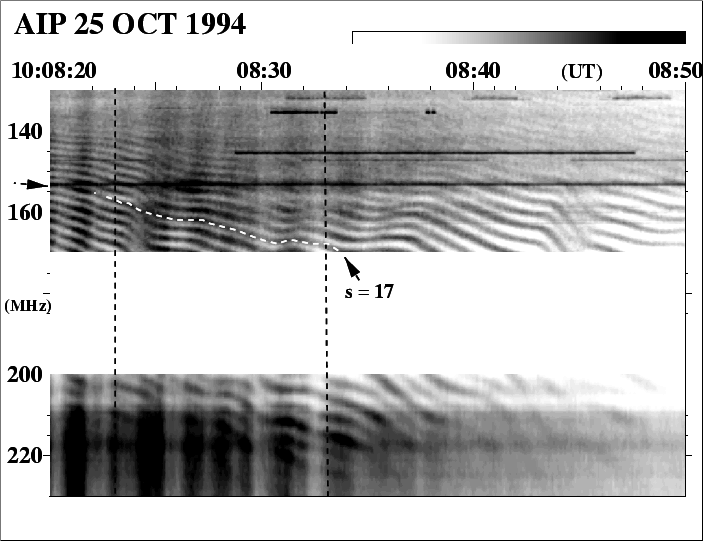 |
Figure 4:
The dynamic spectrum of ZP 10:08:
|
| Open with DEXTER | |
In the text
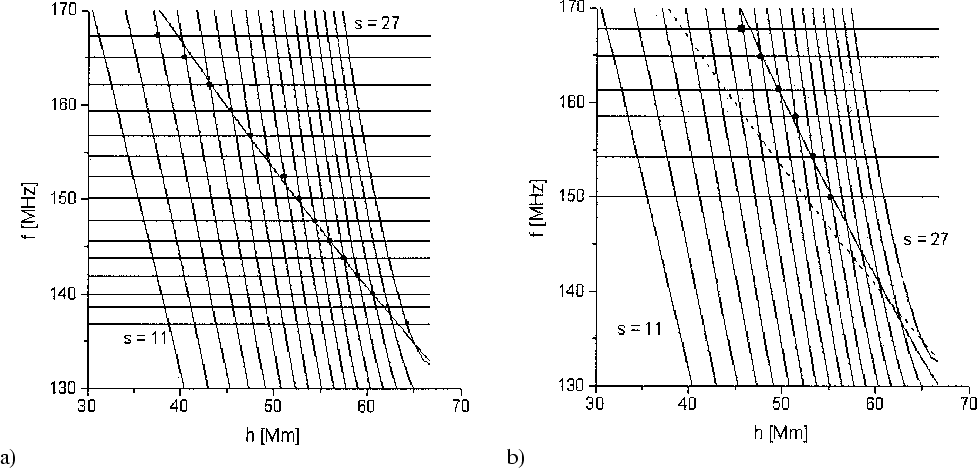 |
Figure 5:
Observations versus theory: horizontal lines are peak
frequencies of zebra stripes. A grid of gyroharmonics
|
| Open with DEXTER | |
In the text
In the text
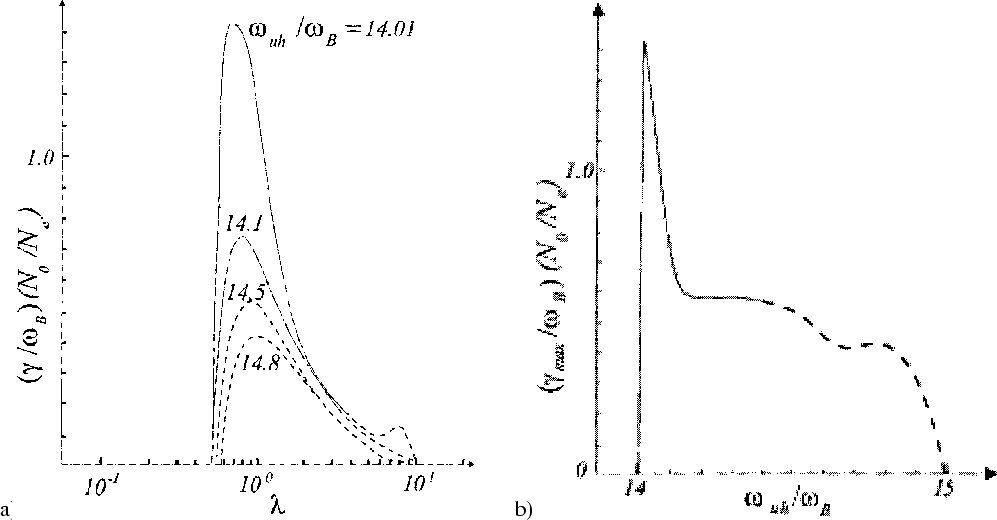 |
Figure B.1:
The growth rate of the waves in the hybrid band
|
In the text