We observed the upper fine structure line of neutral carbon, C I
A&A 409, L41-L45 (2003)
DOI: 10.1051/0004-6361:20031337
A. Weiß 1 - C. Henkel 2 - D. Downes 3 - F. Walter 4
1 - IRAM, Avenida Divina Pastora 7, 18012 Granada, Spain
2 -
MPIfR, Auf dem Hügel 69, 53121 Bonn, Germany
3 -
IRAM, 300 rue de la Piscine, 38406 St-Martin-d'Héres, France
4 -
NRAO, PO Box O Socorro, NM, 87801, USA
Received 22 August 2003 / Accepted 1 September 2003
Abstract
We observed the upper fine structure line of neutral carbon, C I
![]() (
(
![]() GHz), the 12CO(J=3
GHz), the 12CO(J=3![]() 2) line (
2) line (
![]() GHz) and the 1.2 mm continuum
emission from H1413+117 (Cloverleaf quasar, z=2.5) using the IRAM
interferometer. Together with the detection of the lower fine structure
line (Barvainis et al. 1997), the Cloverleaf quasar is now
only the second extragalactic system, besides M 82, where
both carbon lines have convincingly been detected. Our
analysis shows that the carbon lines are optically thin and have an
excitation temperature of
GHz) and the 1.2 mm continuum
emission from H1413+117 (Cloverleaf quasar, z=2.5) using the IRAM
interferometer. Together with the detection of the lower fine structure
line (Barvainis et al. 1997), the Cloverleaf quasar is now
only the second extragalactic system, besides M 82, where
both carbon lines have convincingly been detected. Our
analysis shows that the carbon lines are optically thin and have an
excitation temperature of
![]()
![]() 30 K.
CO is subthermally excited and the observed line luminosity
ratios are consistent with n(H2)
30 K.
CO is subthermally excited and the observed line luminosity
ratios are consistent with n(H2) ![]() 10
10
![]() at
at
![]() = 30-50 K. Using three independent methods
(C I, dust, CO) we derive a total molecular gas mass (corrected for magnification) of
= 30-50 K. Using three independent methods
(C I, dust, CO) we derive a total molecular gas mass (corrected for magnification) of
![]()
![]() 1.2
1.2 ![]() 0.3
0.3 ![]() 10
10
![]() .
Our observations suggest that the molecular disk extends beyond the region seen in
CO(7-6) to a zone of more moderately excited molecular gas that
dominates the global emission in C I and the low J CO lines.
.
Our observations suggest that the molecular disk extends beyond the region seen in
CO(7-6) to a zone of more moderately excited molecular gas that
dominates the global emission in C I and the low J CO lines.
Key words: galaxies: formation - galaxies: starburst - galaxies: high-redshift quasars: emission lines - quasars: individual H1413+117 - cosmology: observations
Detections of large amounts of dust and gas in distant quasars have
opened the possibility to study molecular gas properties
in the early epoch of galaxy formation and to provide fundamental
constraints on galaxy evolution. To date, CO emission has been detected
in more than a dozen quasar host galaxies with z > 2,
the record holder being at z = 6.4 (Walter et al.
2003; Bertoldi et al. 2003).
Molecular gas masses in excess of 1010 ![]() have led to the
hypothesis that the tremendous far-infrared (FIR) luminosities
(>1012
have led to the
hypothesis that the tremendous far-infrared (FIR) luminosities
(>1012 ![]() )
of these objects are not only powered by active
galactic nuclei (AGN) but also by major starbursts which might be
forming cores of elliptical galaxies or bulges of massive spiral galaxies.
)
of these objects are not only powered by active
galactic nuclei (AGN) but also by major starbursts which might be
forming cores of elliptical galaxies or bulges of massive spiral galaxies.
Due to its strong magnification by gravitational lensing H1413+117
is a relatively strong emitter in various molecular lines and
therefore a prime target to study the physical conditions of the
molecular gas at high redshift in great detail. It has been detected
in the CO 3-2 (Barvainis et al. 1994;
Wilner et al. 1995; Alloin et al.
1997; Barvainis et al. 1997, B97
hereafter), 4-3, 5-4 (B97) and 7-6 (Alloin et al. 1997; Yun et al. 1997)
transitions, the lower fine structure line of atomic
carbon, C I
![]() ,
(B97) and in HCN (B97, Solomon et al.
2003).
,
(B97) and in HCN (B97, Solomon et al.
2003).
In this letter we report on the detection of the upper fine structure line
of neutral carbon, C I
![]() ,
which adds an important piece of information:
unlike CO, cool C I can be described by a 3-level system. This allows us to derive
its excitation and to constrain the physical gas conditions by
observations of the C I
,
which adds an important piece of information:
unlike CO, cool C I can be described by a 3-level system. This allows us to derive
its excitation and to constrain the physical gas conditions by
observations of the C I
![]() and C I
and C I
![]() transitions only. We compare our
results from C I with estimates based on thermal dust emission and CO.
We use
transitions only. We compare our
results from C I with estimates based on thermal dust emission and CO.
We use
![]() km s-1 Mpc-1 and
km s-1 Mpc-1 and
![]() .
.
Observations were carried out with the IRAM Plateau de Bure
interferometer during 2 nights in March 2003. The dual frequency
setup was used to observe the 12CO(J=3![]() 2) and C I
2) and C I
![]() transitions towards H1413+117 (RA 14:15:46.23, Dec 11:29:44.0; J2000)
simultaneously. The receivers were
tuned in single sideband mode (SSB) at 97.191 GHz and in dual sideband mode
at 224.478 GHz/227.478 GHz.
We used the standard D configuration (6 antennas) which results in
synthesized beams of
transitions towards H1413+117 (RA 14:15:46.23, Dec 11:29:44.0; J2000)
simultaneously. The receivers were
tuned in single sideband mode (SSB) at 97.191 GHz and in dual sideband mode
at 224.478 GHz/227.478 GHz.
We used the standard D configuration (6 antennas) which results in
synthesized beams of
![]() and
and
![]() for the 3 mm and 1 mm bands respectively.
At these resolutions the source is unresolved.
Typical SSB system temperatures were
for the 3 mm and 1 mm bands respectively.
At these resolutions the source is unresolved.
Typical SSB system temperatures were ![]() 120 K and
120 K and ![]() 300 K at 3 mm
and 1 mm. Flux and passband calibration were obtained on MWC 349. The nearby sources 1413+135 and 1423+146 were used as secondary flux and
phase calibrators. We estimate the flux density scale to be accurate to about 10%.
300 K at 3 mm
and 1 mm. Flux and passband calibration were obtained on MWC 349. The nearby sources 1413+135 and 1423+146 were used as secondary flux and
phase calibrators. We estimate the flux density scale to be accurate to about 10%.
The data were processed to give data cubes with a velocity resolution of 10 km s-1 (3.24 MHz) at 3 mm and 40 km s-1 (29.7 MHz) at 1 mm.
A 3 mm continuum image was generated by averaging the line emission-free channels.
At 1 mm the continuum image was computed from the
image sideband. From the 1 mm signal sideband data we generated a
continuum free C I
![]() spectral line cube by subtracting the 1 mm continuum
image. The final results are presented in Figs. 1 and 2.
spectral line cube by subtracting the 1 mm continuum
image. The final results are presented in Figs. 1 and 2.
![\begin{figure}
\par\includegraphics[width=8.4cm,clip]{Fh221_f1.eps}
\end{figure}](/articles/aa/full/2003/39/aafh221/img22.gif) |
Figure 1:
Spectra of the 12 CO(J=3 |
| Open with DEXTER | |
![\begin{figure}
\par\includegraphics[width=8.4cm,clip]{Fh221_f2.eps}
\end{figure}](/articles/aa/full/2003/39/aafh221/img23.gif) |
Figure 2:
Integrated C I
|
| Open with DEXTER | |
The 12CO(J=3![]() 2) transition (
2) transition (
![]() = 345.796 GHz) is
detected with high signal to noise (Fig. 1).
Line parameters for the 12CO(J=3
= 345.796 GHz) is
detected with high signal to noise (Fig. 1).
Line parameters for the 12CO(J=3![]() 2) transition are similar to those
reported by Wilner et al. (1995) and B97.
The high quality of our 12CO(J=3
2) transition are similar to those
reported by Wilner et al. (1995) and B97.
The high quality of our 12CO(J=3![]() 2) spectrum allows us to
determine the redshift of the molecular gas
(as traced by CO) with high accuracy: z = 2.55784
2) spectrum allows us to
determine the redshift of the molecular gas
(as traced by CO) with high accuracy: z = 2.55784 ![]() 0.00003.
0.00003.
The C I
![]() line (
line (
![]() = 809.342 GHz, Müller et al. 2001) is clearly
detected with a peak flux density of
= 809.342 GHz, Müller et al. 2001) is clearly
detected with a peak flux density of ![]() = 13.2
= 13.2 ![]() 2.9 mJy
(Figs. 1 and 2). Due to
the limited bandwidth of 512 MHz (670 km s-1)
our observations lack the red line-wing. However, this does not affect the determination of
the peak line intensity since the zero power level is well
defined in interferometric observations. Table 1
summarizes the line parameters derived from Gaussian fits.
The C I
2.9 mJy
(Figs. 1 and 2). Due to
the limited bandwidth of 512 MHz (670 km s-1)
our observations lack the red line-wing. However, this does not affect the determination of
the peak line intensity since the zero power level is well
defined in interferometric observations. Table 1
summarizes the line parameters derived from Gaussian fits.
The C I
![]() line (z = 2.5585
line (z = 2.5585 ![]() 0.0001)
is displaced by
0.0001)
is displaced by ![]() +60 km s-1 relative to 12CO(J=3
+60 km s-1 relative to 12CO(J=3![]() 2) -
opposite to the displacement of the C I
2) -
opposite to the displacement of the C I
![]() transitions
found by B97 (
transitions
found by B97 (![]() -42 km s-1).
While the difference between the CO and C I
-42 km s-1).
While the difference between the CO and C I
![]() redshift might be
attributed to low level baseline instabilities in the 30 m data and
the poor signal to noise ratio, the reason for the shift in the C I
redshift might be
attributed to low level baseline instabilities in the 30 m data and
the poor signal to noise ratio, the reason for the shift in the C I
![]() line is
unclear. Gravitational amplification should not alter the center frequency for C I unless
its distribution is different from CO, which we consider unlikely (see
below). The apparent line shift needs to be confirmed by
higher-sensitivity observations. If confirmed, this shift is most
likely due to an opacity effect.
line is
unclear. Gravitational amplification should not alter the center frequency for C I unless
its distribution is different from CO, which we consider unlikely (see
below). The apparent line shift needs to be confirmed by
higher-sensitivity observations. If confirmed, this shift is most
likely due to an opacity effect.
For the dust flux, we derive an upper limit for the 3 mm
(
![]() = 870
= 870 ![]() m) continuum of
m) continuum of
![]() mJy (3
mJy (3 ![]() ). For the 1 mm
(
). For the 1 mm
(
![]()
![]() m) continuum
we find
m) continuum
we find
![]() mJy.
We obtained an additional 250 GHz flux measurement using the MAMBO
117 channel bolometer array at the IRAM 30 m telescope with
mJy.
We obtained an additional 250 GHz flux measurement using the MAMBO
117 channel bolometer array at the IRAM 30 m telescope with
![]() = 16
= 16 ![]() 2 mJy, consistent with a
previous measurement (Barvainis et al. 1995).
The radio-IR spectral energy distribution (SED) of H1413+117 is shown in Fig. 3.
2 mJy, consistent with a
previous measurement (Barvainis et al. 1995).
The radio-IR spectral energy distribution (SED) of H1413+117 is shown in Fig. 3.
Table 1: Observed line parameters.
![\begin{figure}
\par\includegraphics[width=8.4cm,clip]{Fh221_f3.eps}
\end{figure}](/articles/aa/full/2003/39/aafh221/img34.gif) |
Figure 3:
Radio-IR SED of H1413+117. Displayed flux densities were
taken from Barvainis & Lonsdale (1997) (20, 6, 3, 2 cm,
stars), Solomon et al. (2003) (1.2 cm
cross), this work (3 mm, 1.3 mm, 1.2 mm, filled squares),
Barvainis et al. (1995) (1.2 mm, 760 |
| Open with DEXTER | |
Recent studies of the Milky
Way and nearby galaxies showed that C I is closely associated with
the CO emission independent of the environment (see e.g. Bennett
et al. 1994, Ojha et al. 2001 for the MW;
and Gerin & Phillips 2000, Israel & Baas 2002
for nearby galaxies). Since the critical density
for the C I lines and 12CO(J=1![]() 0) are both
0) are both
![]() this finding suggests that the transitions arise from the same volume and share
similar excitation temperatures (e.g. Ikeda et al. 2002).
This allows us to estimate the opacities of the C I transitions via a
LTE analysis assuming optically thick emission in 12CO(J=1
this finding suggests that the transitions arise from the same volume and share
similar excitation temperatures (e.g. Ikeda et al. 2002).
This allows us to estimate the opacities of the C I transitions via a
LTE analysis assuming optically thick emission in 12CO(J=1![]() 0).
Since the 12CO(J=1
0).
Since the 12CO(J=1![]() 0) transition has not been measured in the Cloverleaf we
here adopt
0) transition has not been measured in the Cloverleaf we
here adopt
![]() (see our discussion on the CO lines).
Using the values for the line luminosities (L') as listed in Table 1 and
assuming as a start
(see our discussion on the CO lines).
Using the values for the line luminosities (L') as listed in Table 1 and
assuming as a start
![]() =
=
![]() = 50 K (see below) we find that both
carbon lines are optically thin (
= 50 K (see below) we find that both
carbon lines are optically thin (![]() = 0.14,
= 0.14, ![]() = 0.10).
For a moderate CO opacity (as suggested by B97) optical depth for
the carbon lines are even lower.
Low optical depths for the C I
transitions are in line with findings in nearby galaxies
(e.g. Israel & Baas 2002).
As discussed in Stutzki et al. (1997) the integrated line intensity
ratio
= 0.10).
For a moderate CO opacity (as suggested by B97) optical depth for
the carbon lines are even lower.
Low optical depths for the C I
transitions are in line with findings in nearby galaxies
(e.g. Israel & Baas 2002).
As discussed in Stutzki et al. (1997) the integrated line intensity
ratio
![]() between the C I
between the C I
![]() and C I
and C I
![]() transition can be used in the optically
thin limit to determine directly the C I excitation temperature via
transition can be used in the optically
thin limit to determine directly the C I excitation temperature via
![]() = 38.8
= 38.8
![]() .
This
equation is valid if the levels are thermally populated. With
.
This
equation is valid if the levels are thermally populated. With
![]() = 0.54
= 0.54 ![]() 0.07
(see Table 1) we find
0.07
(see Table 1) we find
![]() = 29
= 29 ![]() 3 K.
For this
3 K.
For this
![]() the C I lines are still optically thin
(
the C I lines are still optically thin
(![]() = 0.15,
= 0.15, ![]() = 0.11).
= 0.11).
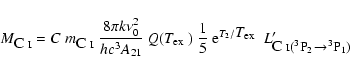
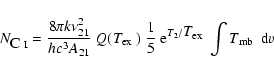
The relation between the
integrated C I
![]() brightness temperature and the beam averaged C I column density in the
optically thin limit for local galaxies (z = 0) is given by
brightness temperature and the beam averaged C I column density in the
optically thin limit for local galaxies (z = 0) is given by
 |
(1) |
![\begin{displaymath}M_{\mbox{C~{\scriptsize I}}} = 4.566\times10^{-3}~Q(\mbox{$T_...
...m (^3P_2\!\to^3{\hskip-0.8mm}P_1)$ }}}} [\mbox{$M_{\odot}$ }].
\end{displaymath}](/articles/aa/full/2003/39/aafh221/img50.gif) |
(3) |
Deriving the mass of molecular hydrogen requires an estimate of the
carbon abundance relative to H2. We here use M 82 as a
template to estimate this number.
Using the results from Stutzki et al. (1997), Walter
et al. (2002) and Weiß et al. (2001) we
obtain [C I]/[H2] ![]() 3
3 ![]() 10-5.
Applying this number to the carbon mass of H1413+117 results in
10-5.
Applying this number to the carbon mass of H1413+117 results in
![]()
![]() 1.4
1.4 ![]() 10
10
![]() .
.
The mm-wave continuum measurements combined with sub-mm, ISO and IRAS data
(for references see caption of Fig. 3)
are well fitted with a 2-component dust model. To account for the
steep increase of the observed flux with frequency in the observed mm regime we
used
![]() = 10
= 10
![]() with
with ![]() = 2 (Downes & Solomon 1998).
For the source solid angle of the lensed dust distribution we
used
= 2 (Downes & Solomon 1998).
For the source solid angle of the lensed dust distribution we
used
![]() =
=
![]() with
an angular size of
with
an angular size of ![]() = 0.17'' and a magnification of
m = 11 for both components (Venturini & Solomon 2003).
Masses and dust temperatures for both components were determined by
fitting those 4 free parameters to the 12 data points above the 97.2 GHz
upper limit in Fig. 3. For the cold dust component
we find
= 0.17'' and a magnification of
m = 11 for both components (Venturini & Solomon 2003).
Masses and dust temperatures for both components were determined by
fitting those 4 free parameters to the 12 data points above the 97.2 GHz
upper limit in Fig. 3. For the cold dust component
we find
![]()
![]() 50 (
50 (![]() 2) K and
2) K and
![]()
![]() 6.7
6.7 ![]() 10
10
![]() .
The warm component is characterized by
.
The warm component is characterized by
![]()
![]() 115 (
115 (![]() 10) K and
10) K and
![]()
![]() 3.9
3.9 ![]() 10
10
![]() .
This implies
.
This implies
![]() (
(
![]() as defined by Helou et al. 1985).
The fit results are displayed in Fig. 3.
Parameters derived for the cold gas component are in agreement with
previous studies (e.g. Hughes et al. 1997; Benford et al. 1999).
Using a gas to dust mass ratio of 150 (e.g. Dunne et al.
2000) the total H2 mass in the cold
component is
as defined by Helou et al. 1985).
The fit results are displayed in Fig. 3.
Parameters derived for the cold gas component are in agreement with
previous studies (e.g. Hughes et al. 1997; Benford et al. 1999).
Using a gas to dust mass ratio of 150 (e.g. Dunne et al.
2000) the total H2 mass in the cold
component is
![]()
![]() 1.0
1.0 ![]() 10
10
![]() in
agreement with the mass determined from C I. Note that a larger angular size
of the cold component leads to lower temperatures for
in
agreement with the mass determined from C I. Note that a larger angular size
of the cold component leads to lower temperatures for
![]() ,
similarly a smaller size for the warm component will yield higher
,
similarly a smaller size for the warm component will yield higher
![]() .
.
Our 12CO(J=3![]() 2) flux density is about 30% higher than the value reported
by B97.
The flux difference has important implications for the interpretation of the
CO L' ratios: now the 3-2, 4-3, 5-4, 7-6 CO line
luminosities (see footnote in Table 1) are decreasing
with increasing J. So the data suggest CO is subthermally excited,
at least for J > 3. The minimum kinetic temperature therefore
can be lower than the lower limit of 60 K given in B97. We have
reanalyzed the CO ratios using our 3-2 flux and taking the background radiation of
2) flux density is about 30% higher than the value reported
by B97.
The flux difference has important implications for the interpretation of the
CO L' ratios: now the 3-2, 4-3, 5-4, 7-6 CO line
luminosities (see footnote in Table 1) are decreasing
with increasing J. So the data suggest CO is subthermally excited,
at least for J > 3. The minimum kinetic temperature therefore
can be lower than the lower limit of 60 K given in B97. We have
reanalyzed the CO ratios using our 3-2 flux and taking the background radiation of
![]() = 9.6 K into account. Due to the high 7-6 line luminosity
relative to 5-4 not all CO lines can be fitted with a
single gas component LVG model. If only the 3-2, 4-3 and 5-4 lines
are taken into account LVG solutions can be found for
= 9.6 K into account. Due to the high 7-6 line luminosity
relative to 5-4 not all CO lines can be fitted with a
single gas component LVG model. If only the 3-2, 4-3 and 5-4 lines
are taken into account LVG solutions can be found for
![]()
![]() 10 K.
Since the kinetic temperature is expected to be close to the
excitation temperature of neutral carbon (Israel & Baas 2002)
we fixed the
10 K.
Since the kinetic temperature is expected to be close to the
excitation temperature of neutral carbon (Israel & Baas 2002)
we fixed the
![]() to 30 K. In a LVG space of [CO]/grad(V) from
to 30 K. In a LVG space of [CO]/grad(V) from
![]() to
to
![]() and log(
and log(
![]() )
1.8 to 5.5, the allowed H2 density ranges
from 3.2
)
1.8 to 5.5, the allowed H2 density ranges
from 3.2 ![]() log(
log(
![]() )
) ![]() 4.0 with the higher limit corresponding to
the lowest abundance per velocity gradient and vice versa.
Independently of the abundance per velocity gradient or
the density we find that for
4.0 with the higher limit corresponding to
the lowest abundance per velocity gradient and vice versa.
Independently of the abundance per velocity gradient or
the density we find that for
![]() = 30 K the 12CO(J=1
= 30 K the 12CO(J=1![]() 0) transition will be
brighter than 12CO(J=3
0) transition will be
brighter than 12CO(J=3![]() 2) with
2) with
![]()
![]() 0.9,
consistent with the lower limit of 0.79 determined by Tsuboi et al. (1999).
Using this line ratio and
0.9,
consistent with the lower limit of 0.79 determined by Tsuboi et al. (1999).
Using this line ratio and
![]() (Downes & Solomon 1998) we get
(Downes & Solomon 1998) we get
![]()
![]() 1.6
1.6 ![]() 10
10
![]() in agreement
with the result for C I and the dust. Using
in agreement
with the result for C I and the dust. Using
![]() =
=
![]() = 50 K
does not alter the results significantly. The predicted 7-6/3-2
ratio ranges between 0.05 - 0.1, much lower than the observed ratio of 0.6.
A large fraction of the 7-6 line may therefore arise
from much warmer regions such as the warm dust component. This is also supported by a minimum CO(7-6)
excitation temperature of
= 50 K
does not alter the results significantly. The predicted 7-6/3-2
ratio ranges between 0.05 - 0.1, much lower than the observed ratio of 0.6.
A large fraction of the 7-6 line may therefore arise
from much warmer regions such as the warm dust component. This is also supported by a minimum CO(7-6)
excitation temperature of ![]() 75 K that can be derived from the observed
7-6 brightness temperature. We do not think that selective
magnification would significantly alter this analysis, because
detailed models of the Cloverleaf lens show that the lens
magnification is insensitive to the size of the mm-line emitting
region (Venturini, private communication).
75 K that can be derived from the observed
7-6 brightness temperature. We do not think that selective
magnification would significantly alter this analysis, because
detailed models of the Cloverleaf lens show that the lens
magnification is insensitive to the size of the mm-line emitting
region (Venturini, private communication).
The mass estimates from C I, dust, and CO give remarkably similar
results given that each method uses independent assumptions
(carbon abundance, gas to dust mass ratio, CO conversion factor).
Correcting for magnification we find
![]()
![]() 1.2
1.2 ![]() 0.3
0.3 ![]() 10
10
![]() .
.
Compared to the physical conditions of the molecular gas determined in
other dusty quasars (
![]()
![]() 50-70 K,
50-70 K,
![]()
![]() 104,
see e.g. Downes et al. 1999;
Carilli et al. 2002) and local ULIRGs
(Downes & Solomon 1998) the values determined above for
H1413+117 argue for a more diffuse and cooler gas component.
Judging from the excitation temperature of C I, the excitation of the
molecular gas is between conditions found in M 82's center (
104,
see e.g. Downes et al. 1999;
Carilli et al. 2002) and local ULIRGs
(Downes & Solomon 1998) the values determined above for
H1413+117 argue for a more diffuse and cooler gas component.
Judging from the excitation temperature of C I, the excitation of the
molecular gas is between conditions found in M 82's center (
![]() K)
and the mean value over the Galactic Center (
K)
and the mean value over the Galactic Center (
![]() K) (Stutzki et al. 1997).
The continuum to line ratio of
K) (Stutzki et al. 1997).
The continuum to line ratio of
![]() is within the range found in local ULIRGs (Solomon et al.
1997) but lower than values estimated for dusty
quasars (e.g. Carilli et al. 2002; Walter et al.
2003). All this implies that large amounts of molecular gas are
less affected by the heating from the AGN and/or nuclear star formation than
the region emitting in CO(7-6). A possible explanation for this finding is
that the molecular disk extends beyond the central region seen in
CO(7-6) to a zone of more moderately excited molecular gas that
dominates the global emission in C I and the low J CO lines.
is within the range found in local ULIRGs (Solomon et al.
1997) but lower than values estimated for dusty
quasars (e.g. Carilli et al. 2002; Walter et al.
2003). All this implies that large amounts of molecular gas are
less affected by the heating from the AGN and/or nuclear star formation than
the region emitting in CO(7-6). A possible explanation for this finding is
that the molecular disk extends beyond the central region seen in
CO(7-6) to a zone of more moderately excited molecular gas that
dominates the global emission in C I and the low J CO lines.
Acknowledgements
We would like to thank R. Neri and R. Zylka for carrying out the observations at the PdBI and the 30 m telescope and S. Venturini for discussions on the lens model. IRAM is supported by INSU/CNRS (France), MPG (Germany) and IGN (Spain).