A&A 408, L21-L24 (2003)
DOI: 10.1051/0004-6361:20031153
The optical afterglow of the not so dark GRB 021211
S. B. Pandey1 - G. C. Anupama2 - R. Sagar1,2 -
D. Bhattacharya3 - A. J. Castro-Tirado4 - D. K.
Sahu2,5 - Padmakar Parihar2,5
- T. P. Prabhu2
1 - State Observatory, Manora peak, Naini Tal 263129, Uttaranchal, India
2 -
Indian Institute of Astrophysics, Bangalore 560 034, India
3 -
Raman Research Institute, Bangalore 560 080, India
4 -
Instituto de Astrofísica de Andalucía, PO Box 03004, 18080 Granada, Spain
5 -
Center for Research & Education in Science & Technology, Hosakote, Bangalore
562 114, India
Received 28 April 2003 / Accepted 29 July 2003
Abstract
We determine Johnson B,V and Cousins R,I photometric CCD magnitudes for
the afterglow of GRB 021211 during the first night after the GRB trigger.
The afterglow was very faint and would have been probably missed if no prompt
observations had been conducted. A fraction of the so-called "dark'' GRBs
may thus be just "optically dim'' and require very deep imaging to be
detected. The early-time optical light curve reported by other observers
shows a prompt emission with properties similar to that of GRB 990123. Following
this, the afterglow emission from  11 min to 35 days after the burst
is characterized by an overall power-law decay with a slope
11 min to 35 days after the burst
is characterized by an overall power-law decay with a slope
 in the R
passband. We derive the value of spectral index in the optical to near-IR
region to be
in the R
passband. We derive the value of spectral index in the optical to near-IR
region to be  during 0.13 to 0.8 day after the burst.
The flux decay constant and the spectral slope indicate that during the
first day after the burst, the optical band lies between the cooling
frequency and the synchrotron maximum frequency of the afterglow.
during 0.13 to 0.8 day after the burst.
The flux decay constant and the spectral slope indicate that during the
first day after the burst, the optical band lies between the cooling
frequency and the synchrotron maximum frequency of the afterglow.
Key words: gamma rays: bursts - techniques: photometric - cosmology: observations
A long duration burst, GRB 021211 ( H2493), triggered at
11
H2493), triggered at
11 18
18 34
34
 03 UT on 11 December 2002 was detected by the High Energy
Transient Explorer (HETE) FREGATE, WXM, and soft X-ray camera (SXC)
instruments (Crew et al. 2003). It was also observed by ULYSSES and KONUS
(Hurley et al. 2002). The burst had a duration of 2.3 s at higher
energies (85-400 keV) but a longer duration of about 8.5 s at lower energies
(5-10 keV) band. It had a fluence of about 1 and 2
03 UT on 11 December 2002 was detected by the High Energy
Transient Explorer (HETE) FREGATE, WXM, and soft X-ray camera (SXC)
instruments (Crew et al. 2003). It was also observed by ULYSSES and KONUS
(Hurley et al. 2002). The burst had a duration of 2.3 s at higher
energies (85-400 keV) but a longer duration of about 8.5 s at lower energies
(5-10 keV) band. It had a fluence of about 1 and 2  erg/cm2 in the energy
bands of 7-30 keV and 30-400 keV respectively. This indicates that GRB 021211
is an "X-ray rich'' burst (Crew et al. 2003). The SXC coordinates of the burst
reported by Crew et al. (2003) are
erg/cm2 in the energy
bands of 7-30 keV and 30-400 keV respectively. This indicates that GRB 021211
is an "X-ray rich'' burst (Crew et al. 2003). The SXC coordinates of the burst
reported by Crew et al. (2003) are
 (J2000). Within the error
circle of SXC, an optical afterglow (OA) of the GRB 021211 was discovered by
Fox & Price (2002) at
(J2000). Within the error
circle of SXC, an optical afterglow (OA) of the GRB 021211 was discovered by
Fox & Price (2002) at
 (J2000).
The source was subsequently also identified in a number of images taken at
90, 108 and 143 s after the burst by robotic optical telescopes.
Thus, GRB 021211 joins the group of GRB 990123 (Akerlof et al. 1999) and
GRB 021004 (Fox et al. 2003b; Pandey et al. 2003) whose early optical emissions
could be observed within few minutes of the trigger of the event.
Spectroscopic observations by Della Valle et al. (2003)
indicate a redshift value of
(J2000).
The source was subsequently also identified in a number of images taken at
90, 108 and 143 s after the burst by robotic optical telescopes.
Thus, GRB 021211 joins the group of GRB 990123 (Akerlof et al. 1999) and
GRB 021004 (Fox et al. 2003b; Pandey et al. 2003) whose early optical emissions
could be observed within few minutes of the trigger of the event.
Spectroscopic observations by Della Valle et al. (2003)
indicate a redshift value of
 for the probable host galaxy
of GRB 021211. Fox et al. (2003a) report optical and near-IR observations of the
GRB afterglow and find that at optical wavelengths, the GRB 021211 afterglow is
significantly fainter than most of the known afterglows at an epoch of
1 day. The observed fluence in the 30-400 keV energy band by Crew et al.
(2003) together with the measured redshift
(Della Valle et al. 2003)
indicates an isotropic equivalent energy release
for the probable host galaxy
of GRB 021211. Fox et al. (2003a) report optical and near-IR observations of the
GRB afterglow and find that at optical wavelengths, the GRB 021211 afterglow is
significantly fainter than most of the known afterglows at an epoch of
1 day. The observed fluence in the 30-400 keV energy band by Crew et al.
(2003) together with the measured redshift
(Della Valle et al. 2003)
indicates an isotropic equivalent energy release
 erg for H0 = 65 km s-1 Mpc-1 in a
 and
and
 cosmological model. With a cosmological K-correction as in Bloom et al.
(2001) the estimated isotropic-equivalent energy becomes
cosmological model. With a cosmological K-correction as in Bloom et al.
(2001) the estimated isotropic-equivalent energy becomes
 erg, an order of magnitude lower than the corresponding
estimate for GRB 990123 (Bloom et al. 2003).
erg, an order of magnitude lower than the corresponding
estimate for GRB 990123 (Bloom et al. 2003).
In this paper we present optical observations obtained during the temporal gap
of the light curves presented by Della Valle et al. (2003a), Fox et al. (2003a)
and Li et al. (2003) using secure photometric calibrations.
The broad band Johnson BV and Cousins RI photometric observations of the OA were
carried out on 11 December 2002 using the 104-cm Sampurnanand telescope of the
State Observatory, Nainital and 2-m Himalayan Chandra Telescope (HCT) of the Indian
Astronomical Observatory (IAO), Hanle. At Nainital, one pixel of the
 pixel2 size CCD chip corresponds to a square of 0
 38 side, and the entire chip covers a field of
 on the sky. The gain and read out noise of the CCD camera are 10 e
 and 5.3 e- respectively. At Hanle, one pixel corresponds to a
square of 0
3 side, and the entire chip covers a field of
and 5.3 e- respectively. At Hanle, one pixel corresponds to a
square of 0
3 side, and the entire chip covers a field of
 on the sky. It has a read out noise of 4.95 e- and gain is
1.23 e
.
From Nainital, the CCD BVRI observations of the OA field along
with Landolt (1992) standard SA 98 region were obtained on 26/27 December 2002
for photometric calibrations during good photometric sky conditions. During the
observing run, several twilight flat field and bias frames were also obtained for
the CCD calibrations.
on the sky. It has a read out noise of 4.95 e- and gain is
1.23 e
.
From Nainital, the CCD BVRI observations of the OA field along
with Landolt (1992) standard SA 98 region were obtained on 26/27 December 2002
for photometric calibrations during good photometric sky conditions. During the
observing run, several twilight flat field and bias frames were also obtained for
the CCD calibrations.
ESO MIDAS, NOAO IRAF and DAOPHOT softwares were used to process the CCD frames
in a standard way. The photometric calibrations derived using the six standards
of the SA 98 region with color
0.61 < (V-I) < 2.14 and brightness
13.1 < V < 16.3 are:


where BVRI are standard magnitudes and
 and
and
 represent the instrumental aperture magnitudes normalized for 1 s of exposure time and corrected for atmospheric extinction
coefficients determined from the Nainital observations of SA 98 bright stars. The
values are 0.27, 0.17, 0.11 and 0.10 mag at the zenith in B,V,R and I filters
respectively on the night of 26/27 December 2002. The errors in the colour
coefficients and zero points are obtained by fitting least square linear
regressions to the data points. Using the above calibrations, BVRI photometric
magnitudes of 10 secondary standard stars are determined in the GRB 021211
field and their average values are listed in Table 1. The (X,Y) CCD
pixels are used to convert coordinates into equatorial coordinates
represent the instrumental aperture magnitudes normalized for 1 s of exposure time and corrected for atmospheric extinction
coefficients determined from the Nainital observations of SA 98 bright stars. The
values are 0.27, 0.17, 0.11 and 0.10 mag at the zenith in B,V,R and I filters
respectively on the night of 26/27 December 2002. The errors in the colour
coefficients and zero points are obtained by fitting least square linear
regressions to the data points. Using the above calibrations, BVRI photometric
magnitudes of 10 secondary standard stars are determined in the GRB 021211
field and their average values are listed in Table 1. The (X,Y) CCD
pixels are used to convert coordinates into equatorial coordinates
 values using the astrometric positions given by Henden (2002).
All the secondary stars have been observed seven times in a filter and have internal
photometric accuracy better than 0.01 mag.
A comparison of present magnitudes of the secondary stars
with those given by Henden (2002) values yields zero-point differences of
values using the astrometric positions given by Henden (2002).
All the secondary stars have been observed seven times in a filter and have internal
photometric accuracy better than 0.01 mag.
A comparison of present magnitudes of the secondary stars
with those given by Henden (2002) values yields zero-point differences of
 and
and
 mag in
V, (B-V),
(V-R) and (V-I) respectively. Zero point difference is thus significant
in V, however these numbers can be accounted
in terms of the errors present in the zero point determination of the two
photometries. There is no colour dependence in the photometric differences.
These demonstrate that
the photometric calibrations used in the present work are
secure.
mag in
V, (B-V),
(V-R) and (V-I) respectively. Zero point difference is thus significant
in V, however these numbers can be accounted
in terms of the errors present in the zero point determination of the two
photometries. There is no colour dependence in the photometric differences.
These demonstrate that
the photometric calibrations used in the present work are
secure.
Table 1:
The identification number (ID),
 for epoch 2000,
standard V, (B-V), (V-R) and (R-I) photometric magnitudes of the secondary
standards in the GRB 021211 region.
for epoch 2000,
standard V, (B-V), (V-R) and (R-I) photometric magnitudes of the secondary
standards in the GRB 021211 region.
Several short exposures up to a maximum of 30 min were generally given
while imaging the OA (see Table 2). In order to improve the signal-to-noise
ratio of the OA, the data have been binned in
 pixel2 and also
several bias corrected and flat-fielded CCD images of OA field
are co-added in the same filter, when found necessary. From these images,
profile-fitting magnitudes are determined using DAOPHOT software due to the
presence of bright star near the OT. The profile
magnitudes have been converted to aperture (about 5 arcsec) magnitudes using
aperture growth curve determined from well isolated secondary standards. They are
differentially calibrated using the secondary standards listed in Table 1 and
the values derived in this way are given in Table 2.
pixel2 and also
several bias corrected and flat-fielded CCD images of OA field
are co-added in the same filter, when found necessary. From these images,
profile-fitting magnitudes are determined using DAOPHOT software due to the
presence of bright star near the OT. The profile
magnitudes have been converted to aperture (about 5 arcsec) magnitudes using
aperture growth curve determined from well isolated secondary standards. They are
differentially calibrated using the secondary standards listed in Table 1 and
the values derived in this way are given in Table 2.
Table 2:
CCD BVRI broad band optical photometric observations of
the GRB 021004 afterglow. At Hanle, 2-m HCT was
used while at Nainital, 104-cm Sampurnanand optical
telescope was used.
In Fig. 1, we plot the temporal evolution of our R band GRB 021211 afterglow
measurements along with those published by Della Valle et al.
(2003a), Fox et al.
(2003a), Fruchter et al. (2002), Levan et al.
(2002), Li et al. (2003), McLeod et al.
(2002), Park et al. (2002) and Wozniak et al.
(2002) after correcting for the
host galaxy contribution as described in the next paragraph.
We also make use of the published photometric measurements which could
be converted on the present photometric scales using secondary stars listed
in Table 1.
Figure 1 also shows the R band light curves of GRB 990123 and GRB 021004.
Early time observations of GRB 990123 (
 7 min) and GRB 021211
(
7 min) and GRB 021211
(
 )
can be well explained in terms of reverse shock
emission, taking into account that GRB 021211 4 mag fainter than GRB 990123
as noticed by Li et al. (2003) too. The GRB 021004
early time (
)
can be well explained in terms of reverse shock
emission, taking into account that GRB 021211 4 mag fainter than GRB 990123
as noticed by Li et al. (2003) too. The GRB 021004
early time (
 min) optical observations show unexpectedly shallower
flux decay than that of GRB 990123 and GRB 021211 so reverse shock explanation
can be ruled out either for homogeneous or for inhomogeneous environments
(Chevalier & Li 2000; Fox et al. 2003b).
min) optical observations show unexpectedly shallower
flux decay than that of GRB 990123 and GRB 021211 so reverse shock explanation
can be ruled out either for homogeneous or for inhomogeneous environments
(Chevalier & Li 2000; Fox et al. 2003b).
The flux decay of the GRB 021211 OA, at times >11 min after the burst can be well
characterized by a single power law decay plus a constant flux
 ,
component
for the underlying host galaxy and can be written as
,
component
for the underlying host galaxy and can be written as
 |
(1) |
![\begin{figure}
\par\includegraphics[height=8.6cm,width=8.2cm,clip]{pandey_fig1.ps}
\end{figure}](/articles/aa/full/2003/36/aafd281/Timg53.gif) |
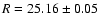
Figure 1:
Light curve of the GRB 021211 OA in R photometric passband.
Filled circles denote the present data, whereas empty squares are data taken from
the references given in the main text. The solid line represents a single power-law
fit for the flux decay after subtracting 25.16 mag, the fitted host galaxy contribution.
GRB 990123 (Akerlof et al. 1999 & Castro-Tirado et al. 1999)
and GRB 021004 (Pandey et al. 2003) R band data are also plotted in the figure to
show the relative faintness of GRB 021211 as these GRBs have the early time
optical observations. Time t is measured from the GRB trigger.
|
| Open with DEXTER |
![\begin{figure}
\par\includegraphics[height=8.2cm,width=8.5cm,clip]{pandey_fig2.ps}
\end{figure}](/articles/aa/full/2003/36/aafd281/Timg54.gif) |
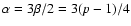
Figure 2:
Optical-near IR spectrum of the GRB 021211 OA corrected
for
E(B-V) = 0.028 mag at 0.13, 0.35 and 0.86 days after the burst. |
| Open with DEXTER |
where F(t) is total measured flux of the OT at time t after the burst
and  is the temporal flux decay index. We fitted the above function
using the least square regression method leaving
as a free parameter,
including the late time VLT R band observations (Della Valle et al. 2003a) but excluding
the HST points (Fruchter et al. 2002). This yields
is the temporal flux decay index. We fitted the above function
using the least square regression method leaving
as a free parameter,
including the late time VLT R band observations (Della Valle et al. 2003a) but excluding
the HST points (Fruchter et al. 2002). This yields
 ,
,
 per
per
 with host galaxy
 mag, which is
consistent with the value given by Della Valle et al. (2003a).
The observations presented here follow the fitted light curve
well and fill the existing temporal gap in the published data (see Fig. 1).
The least square linear regression to the host galaxy contribution subtracted
data including HST points yields
mag, which is
consistent with the value given by Della Valle et al. (2003a).
The observations presented here follow the fitted light curve
well and fill the existing temporal gap in the published data (see Fig. 1).
The least square linear regression to the host galaxy contribution subtracted
data including HST points yields
 with
per
with
per
 .
The larger values of
are mainly due to two deviant
points (see Fig. 1) towards later epoch. As argued by Della Valle et al. (2003a),
these deviations most probably arise due to the additional contribution from a
supernova component, noticeable in their spectroscopic data.
.
The larger values of
are mainly due to two deviant
points (see Fig. 1) towards later epoch. As argued by Della Valle et al. (2003a),
these deviations most probably arise due to the additional contribution from a
supernova component, noticeable in their spectroscopic data.
The value of flux decay
agrees fairly well with that determined by
Fox et al. (2003a) and Li et al. (2003). The very fast flux decay, within a day
after the burst, of the GRB 021211 OA can be compared with those of
GRB 000630 (Fynbo et al. 2001), GRB 020124 (Berger et al. 2002) and GRB 020322
(Burud et al. 2002) afterglowsi, which had similar temporal flux decay slopes
and
were detected at 23 mag in the R passband, one day after the burst.
Figure 2 shows the GRB 021211 afterglow optical to near-IR spectrum at three epochs:
 ,
0.35 and 0.86 day using the present BVR optical data and
the published
,
0.35 and 0.86 day using the present BVR optical data and
the published
 observations by Fox et al. (2003a)
and Bersier et al. (2003).
The epochs are selected according to the widest possible wavelength coverage.
Where necessary, measurements are interpolated at a given wavelength. We used the
reddening map provided by Schlegel et al. (1998) for estimating
Galactic interstellar extinction towards the burst and found a small value of
E(B - V) = 0.028 mag. We used the standard Galactic extinction reddening curve
given by Mathis (1990) in converting apparent magnitudes
into fluxes and used the effective wavelengths and normalizations by Fukugita et al.
(1995) and Bessell & Brett (1988), for BVR and Epchtein et al. (1994) for J and
observations by Fox et al. (2003a)
and Bersier et al. (2003).
The epochs are selected according to the widest possible wavelength coverage.
Where necessary, measurements are interpolated at a given wavelength. We used the
reddening map provided by Schlegel et al. (1998) for estimating
Galactic interstellar extinction towards the burst and found a small value of
E(B - V) = 0.028 mag. We used the standard Galactic extinction reddening curve
given by Mathis (1990) in converting apparent magnitudes
into fluxes and used the effective wavelengths and normalizations by Fukugita et al.
(1995) and Bessell & Brett (1988), for BVR and Epchtein et al. (1994) for J and  .
We corrected the data for Galactic extinction only as
the intrinsic extinction contribution from the host galaxy is unknown.
We describe the spectrum
by a single power law:
.
We corrected the data for Galactic extinction only as
the intrinsic extinction contribution from the host galaxy is unknown.
We describe the spectrum
by a single power law:
 ,
where
,
where  is the flux at
frequency
is the flux at
frequency  and
and  is the spectral index. The values of
at 0.13, 0.35 and 0.86 days after the burst are
is the spectral index. The values of
at 0.13, 0.35 and 0.86 days after the burst are
 ,
,
 and
and
 respectively. The corresponding values of (B - R) are 1
 ,
,
 and
mag respectively. Whereas the
and
mag respectively. Whereas the
 values are
  and
and
 at
and 0.35 day respectively. These values indicate
that the spectral slope of GRB 021211 OA has not changed within
a day after the burst and has a mean value of .
at
and 0.35 day respectively. These values indicate
that the spectral slope of GRB 021211 OA has not changed within
a day after the burst and has a mean value of .
BVRI optical observations of the GRB 021211 OA around 0.28 day after the
burst are presented. The optical light curve of GRB 021211 OA (Fig. 1) at times
>11 min after the burst can be well explained in terms of a single power
law with the underlying host galaxy of
mag. GRB 011211 optical
afterglow is intrinsically faint when compared with those of GRB 990123
and GRB 021004. It was detected only due to prompt, early follow up. Otherwise
it would have been classified as a "dark GRB'' as it was fainter than
R = 23 mag,
1 day after the burst and, in general, the usual follow-up observations
do not go that deep. It thus appears that GRB 021211 is the first example of an
"optically dim'' burst for which early time (less than a few minutes after the
burst) observations are available. It is thus likely that many optically "dark GRBs''
could just be "optically dim'' afterglows with the reason behind
their non-detection being not only due to the high redshift and extinction due
to host galaxy but also due to the OA being much fainter than those observed to
date (Crew et al. 2003). So, GRB 021211 is an example to indicate that a
fraction of the otherwise so-called "dark GRBs" are "not so dark''. Deeper and
faster follow-up observations are required to detect them.
Our fitted R band values of temporal flux decay
and derived optical-near
IR spectral slope
can be well understood in terms of simple spherical
adiabatic case for the homogeneous medium (Sari et al. 1998)
in which for
 ,
,
 .
The observed spectral slope
.
The observed spectral slope
 thus yields
 ,
consistent with the observed value of
,
consistent with the observed value of
 1 and the electron energy
distribution index
1 and the electron energy
distribution index
 .
These values indicate that the cooling frequency
.
These values indicate that the cooling frequency
 lies above the optical band.
Acknowledgements
This research has made use of data
obtained through the High Energy Astrophysics Science Archive Research Center
Online Service, provided by the NASA/Goddard Space Flight Center. S. B. Pandey
is thankful to R. K. S. Yadav and J. C. Pandey for help during
observations. We are also thankful to anonymous referee for the useful comments.
- Akerlof, C., Balsano, R., Barthelemy, S., et al. 1999, Nature, 398, 400
In the text
NASA ADS
- Berger, E., Kulkerni, S. R., Bloom, J. S., et al. 2002, ApJ, 581, 981
In the text
NASA ADS
- Bersier, D., Bloom, J., Challis, P., & Garnavich, P. 2002, GCNC, 1751
- Bessell, M. S., & Brett, J. M. 1988, PASP, 100, 1134
In the text
NASA ADS
- Bloom, J. S., Frail, D. A., & Sari, R. 2001, AJ, 121, 2879
In the text
NASA ADS
- Bloom, J. S., Frail, D. A., & Kulkarni, S. R. 2003, ApJ, submitted [astro-ph/0302210]
In the text
- Burud, I., Fruchter, A., Rhoads, J., & Levan, A. 2002, GCNC, 1536
In the text
- Castro-Tirado, A. J., Zapatero-Osorio, M. R., Caon, N., et al. 1999, Science, 283, 2069
NASA ADS
- Chevalier, R. A., & Li, Z.-Y. 2000, ApJ, 536, 195
In the text
NASA ADS
- Crew, G., Lamb, D. Q., Ricker, G. R., et al. 2003, ApJ, submitted [astro-ph/0303470]
In the text
- Della Valle, M., Benetti, S., Malesani, D., et al. 2003, GCNC,
1809
In the text
- Della Valle, M., Malesani, D.,
Benetti, S., et al. 2003a, A&A, 406, L33
NASA ADS
- Epchtein, N., de Batz, B., Copet, E., et al. 1994, Ap&SS, 217, 3
In the text
NASA ADS
- Fox, D. W., & Price, P. A. 2002, GCNC, 1731
In the text
- Fox, D. W., Price, P. A., Soderberg, A. M., et al. 2003a, ApJ, 586, L5
In the text
NASA ADS
- Fox, D. W., Yost, S., Kulkarni, S. R., et al. 2003b, Nature, 422, 284
NASA ADS
- Fruchter, A., Levan, A., Vreeswijk, P., Holland, S. T., & Kouveliotou, C. 2002, GCNC, 1781
In the text
- Fukugita, M., Shimasaku, K., & Ichikawa, T. 1995, PASP, 107, 945
In the text
NASA ADS
- Fynbo, J. U., Jensen, B. L., Gorosabel, J., et al. 2001, A&A, 369, 373
In the text
NASA ADS
- Henden, A. 2002, GCNC, 1753
In the text
- Hurley, K., Mazets, E., Golenetskii, S., & Cline, T. 2002, GCNC, 1755
In the text
- Landolt, A. R. 1992, AJ, 104, 340
In the text
NASA ADS
- Levan, A., Fruchter, A., Welch, D., et al. 2002, GCNC, 1758
In the text
- Li, W., Filippenko, A. V., Chornock, R., & Jha, S. 2003, ApJ, 586, L9
In the text
NASA ADS
- Mathis, J. S. 1990, ARA&A, 28, 37
In the text
NASA ADS
- McLeod, B., Caldwell, N., Grav, T., et al. 2002, GCNC, 1750
In the text
- Pandey, S. B., Sahu, D. K., Resmi, L., et al. 2003, Bull. Astro. Soc. India, 31, 19
In the text
- Park, H. S., Williams, G., & Barthelmy, S. 2002, GCNC, 1736
In the text
- Sari, R., Piran, T., & Narayan, R. 1998, ApJ, 497, L41
In the text
- Schlegel, D. J., Finkbeiner, D. P., & Davis, M. 1998, ApJ, 500, 525
In the text
NASA ADS
- Wozniak, P., Vestrand, W. T., Starr, D., et al. 2002, GCNC, 1757
In the text
Copyright ESO 2003
![\begin{figure}
\par\includegraphics[height=8.6cm,width=8.2cm,clip]{pandey_fig1.ps}
\end{figure}](/articles/aa/full/2003/36/aafd281/img53.gif)
![\begin{figure}
\par\includegraphics[height=8.2cm,width=8.5cm,clip]{pandey_fig2.ps}
\end{figure}](/articles/aa/full/2003/36/aafd281/img54.gif)