 |
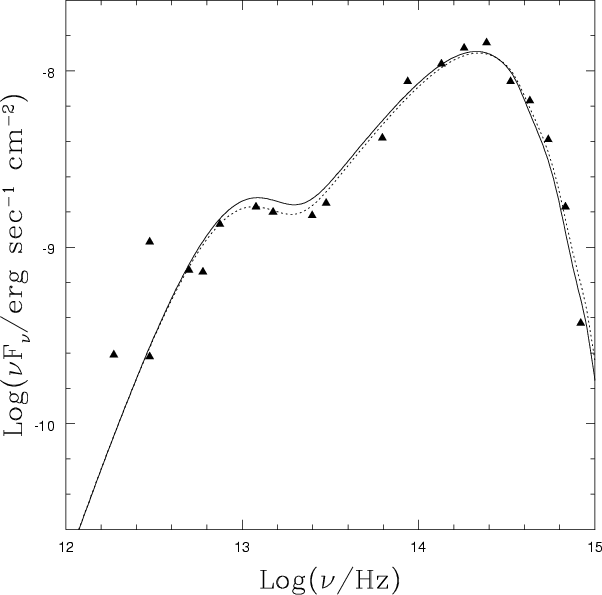
Figure 1: Spectral Energy Distribution of FU Ori. The triangles show the data (from Kenyon & Hartmann 1991), while the curves show the best fit model obtained in this work (solid line) and by LB (dotted line). |
| Open with DEXTER | |
In the text
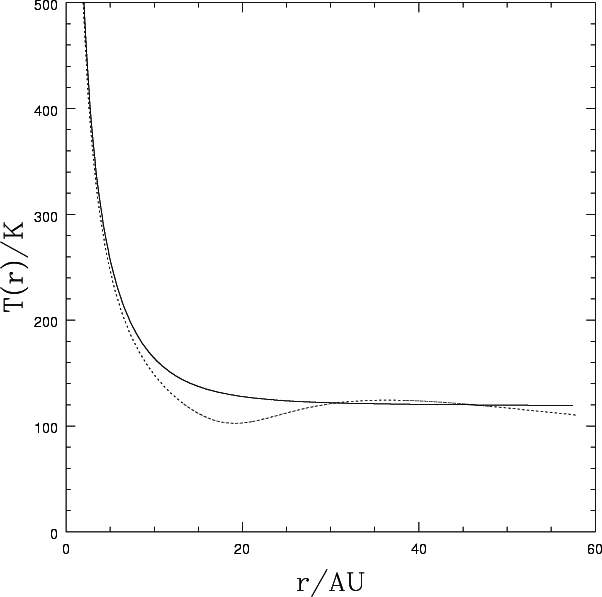 |
Figure 2: Surface temperature profile of FU Ori obtained in this work from a parametric model of the SED (solid line), compared to that obtained by LB (dotted line). |
| Open with DEXTER | |
In the text
![\begin{figure}
\includegraphics[width=11cm]{3691fig3.eps}\end{figure}](/articles/aa/full/2003/36/aa3691/img85.gif) |
Figure 3:
Optical (6170 Å) and near-IR (2.2
|
| Open with DEXTER | |
In the text
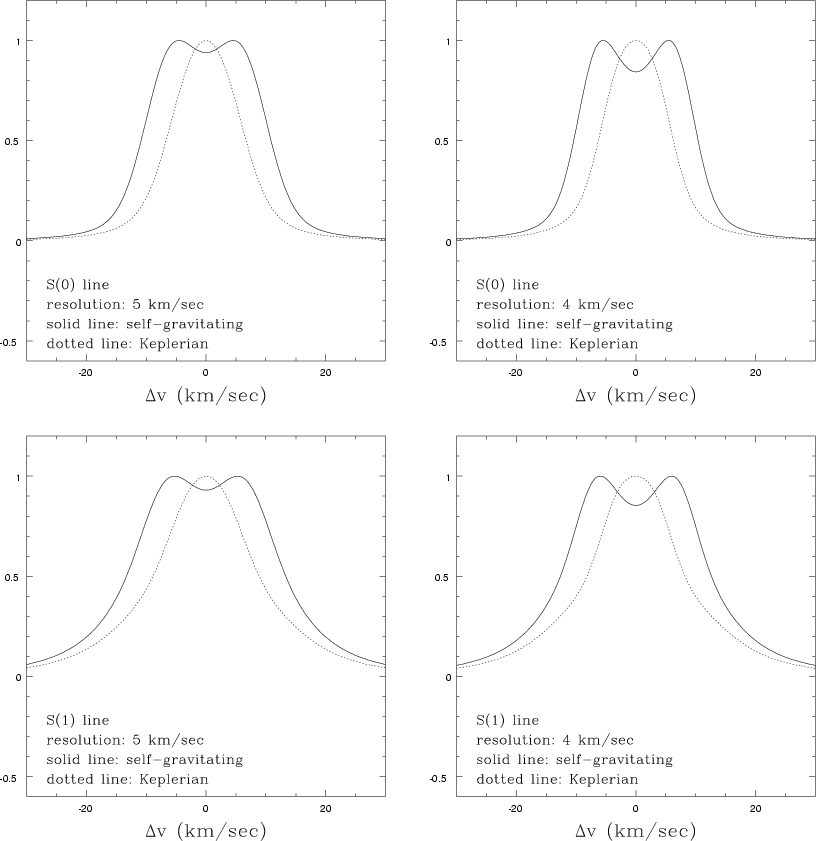 |
Figure 4:
Molecular hydrogen absorption line profiles for disk models
with self-gravitating (with
|
| Open with DEXTER | |
In the text
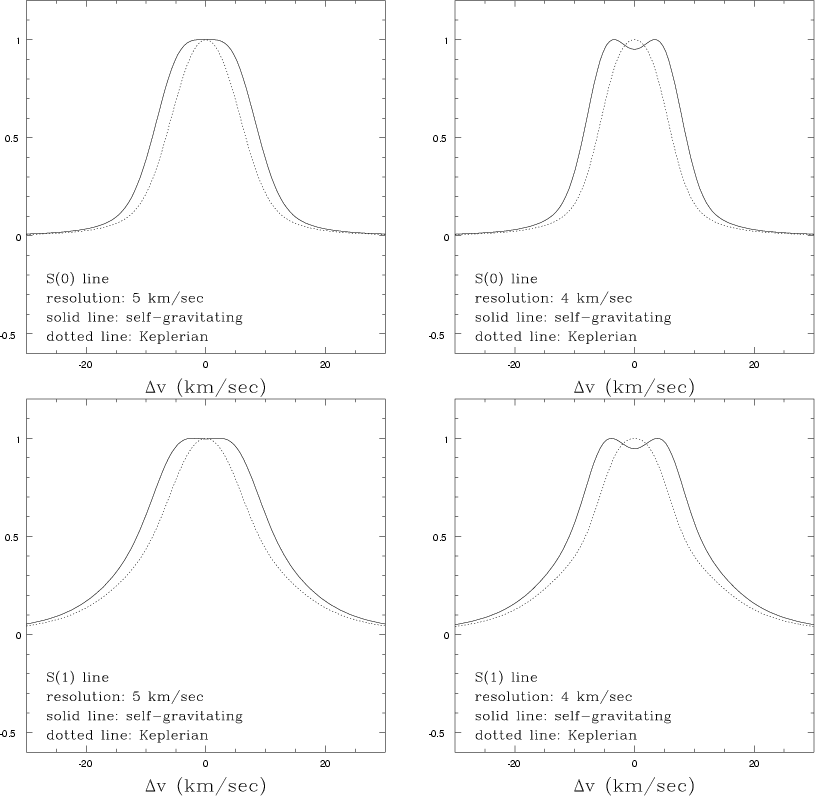 |
Figure 5:
Same as Fig. 4, but with
|
| Open with DEXTER | |
In the text
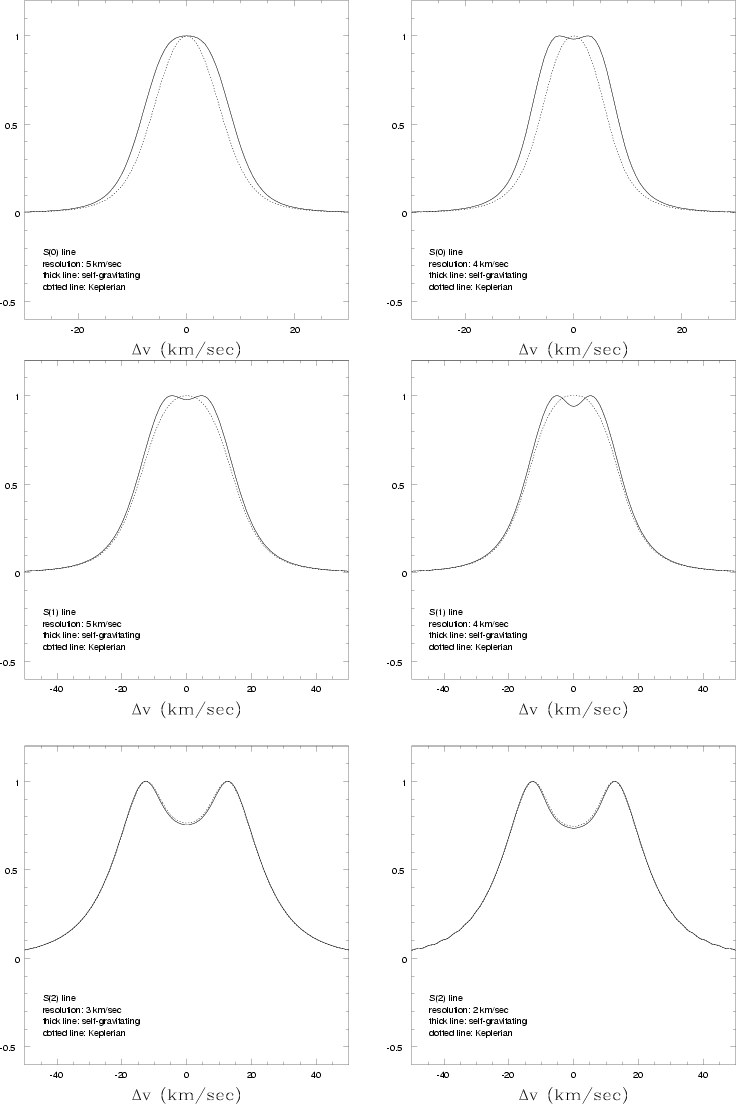 |
Figure 6:
Molecular hydrogen emission line profiles in the
self-gravitating (solid line) case and in the strictly Keplerian
(dotted line) case, for the conservative model with
|
| Open with DEXTER | |
In the text
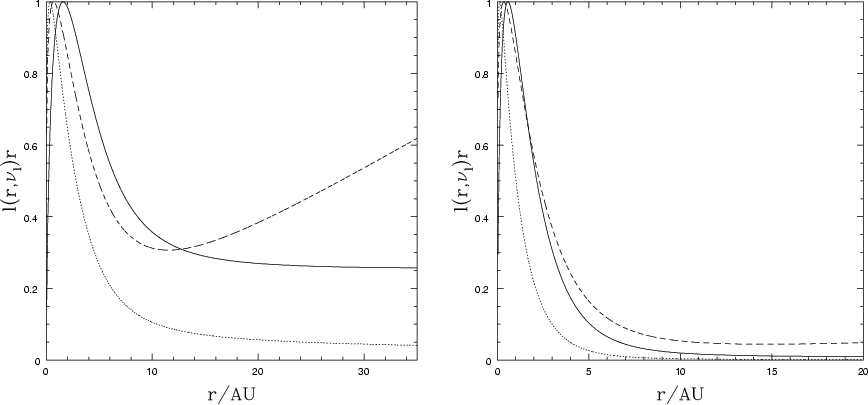 |
Figure 7:
Local emissivity as a function of radius for the S(0) (left)
and S(1) (right) line profiles. Thick solid line: optically
thin, |
| Open with DEXTER | |
In the text
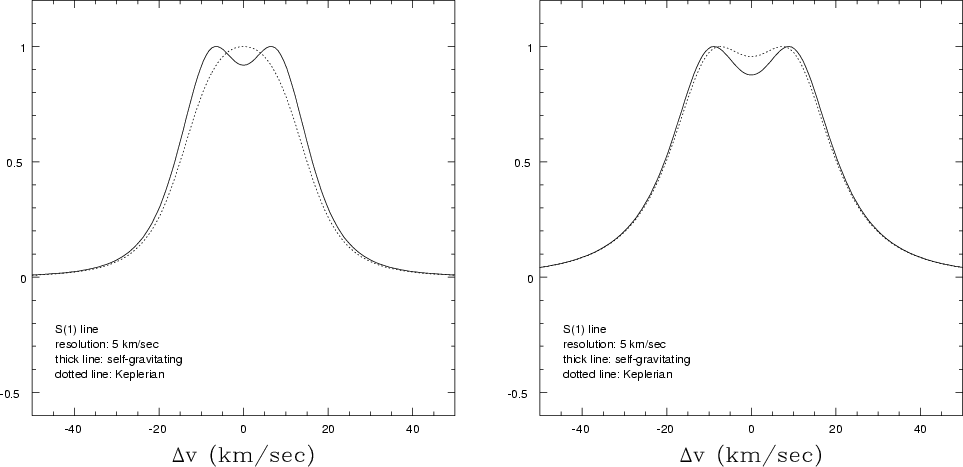 |
Figure 8:
S(1) line profile in the optically thin case, with |
| Open with DEXTER | |
In the text
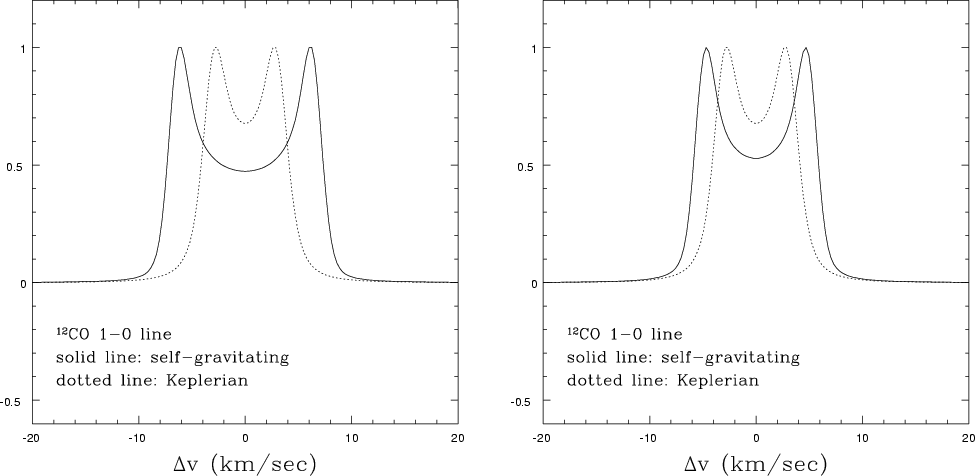 |
Figure 9:
12CO 1-0 line profile at 110 GHz. Solid line: for
a model applicable to FU Ori with a non-Keplerian rotation curve
associated with a self-gravitating accretion disk; dotted line:
for a strictly Keplerian model of FU Ori. The results are shown for
|
| Open with DEXTER | |
In the text