 |
Figure 1:
Two consecutive interferograms of R CrB. The fringes are spectrally
dispersed in the horizontal direction and are recorded simultaneously
in the J, H, and
|
| Open with DEXTER | |
In the text
![\begin{figure}
\par\resizebox{8.8cm}{!}{\rotatebox{0}{\includegraphics[bb=26 417...
...{\rotatebox{0}{\includegraphics[bb=26 28 544 350,clip]{3790F2.ps}}}
\end{figure}](/articles/aa/full/2003/35/aa3790/Timg27.gif) |
Figure 2:
Comparison of the observed SED and visibilities with
SEDs and visibilities
predicted by two-component models consisting of the central star and
an optically thin dust shell, as described in Sect. 4.1.
a) The filled circles represent the photometric data obtained
five days after the IOTA observations. The filled triangles represent
IRAS data.
The three curves represent models with different opacities for
amorphous carbon.
RM: Rouleau & Martin (1991),
CO: Colangeli et al. (1995),
BU: Bussoletti et al. (1987).
|
| Open with DEXTER | |
In the text
 |
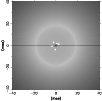
Figure 3:
An example of the intensity distribution of a model with
a group of dust clouds, which are randomly distributed at distances of
between 2 |
| Open with DEXTER | |
In the text
![\begin{figure}
\par\resizebox{8.8cm}{!}{\rotatebox{0}{\includegraphics[bb=27 417...
...{\rotatebox{0}{\includegraphics[bb=26 27 543 347,clip]{3790F4.ps}}}
\end{figure}](/articles/aa/full/2003/35/aa3790/Timg42.gif) |
Figure 4: Comparison of the observed SED and visibilities with SEDs and visibilities predicted by models consisting of the central star, an optically thin dust shell, and a group of five newly formed dust clouds, as shown in Fig. 3. The dashed-dotted line in a) represents the contribution of the group of newly formed dust clouds in the RM model. See also the legend to Fig. 2. |
| Open with DEXTER | |
In the text