 |
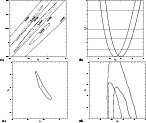
Figure 2:
a) The  confidence contours for the parameters n,
  and
and
 for the open model. The dashed lines are lines of constant
  .
b) .
b)  (likelihood)
for
the parameter (likelihood)
for
the parameter
 .
The solid line is obtained from the model of this paper while the dotted line is that calculated by Henry (2000). The dashed lines represent various confidence levels (65%, 90%, 95%, 99%).
c) The .
The solid line is obtained from the model of this paper while the dotted line is that calculated by Henry (2000). The dashed lines represent various confidence levels (65%, 90%, 95%, 99%).
c) The  confidence contours for the parameters
  ,
and ,
and
 for the open model (see also Henry 2000, Fig. 9).
d) Constraints on
 and
and
 obtained using the same 25 clusters used in Henry (2000), for the local sample, while the high redshift sample is constituted from all the EMSS clusters with z>0.3 and RX J0152.7-1357
(see Henry 2002). The solid lines are the 1 and 2
  contours obtained using the mass function and the M-T relation of this paper, while the dashed line is the 1
  contour obtained using the PS mass function and the M-T relation of Pierpaoli et al. (2001). contour obtained using the PS mass function and the M-T relation of Pierpaoli et al. (2001). |


