 |
(1) |
W. Skórzynski1 - A. Strobel1 - G. A. Galazutdinov1,2,3
1 - Torun Centre for Astronomy (TCfA), Nicholas Copernicus University,
Gagarina 11, 87-100 Torun, Poland
2 -
Special Astrophysical Observatory, Nizhnij Arkhyz 369167, Russia
3 -
Isaac Newton Institute of Chile, SAO Branch, Russia
Received 21 March 2003 / Accepted 19 June 2003
Abstract
Some of the close O and B dwarfs appear to be fainter than indicated by
their Hipparcos distances,
intrinsic absolute magnitudes
attributed to their spectral types, and estimated selective
interstellar extinction.
This discrepancy is explained in the paper by the
grey (neutral) interstellar extinction in the visual range of spectrum.
The measure of such an effect is
related to discrete features of the interstellar matter.
Key words: ISM: dust - extinction
Interstellar dust significantly influences estimates of stellar global characteristics. It changes not only brightness, but also colors of stars. The dependency of the interstellar extinction (comprising both, the absorption and the scatter of light), illustrated by so called Extinction Curve, and discovered by Trumpler (1930a,b), is probably caused by small interstellar dust particles ("Mie" particles).
The absorbing interstellar medium is most likely made of particles of various sizes. The interstellar dust model of Li & Greenberg (1997), based on observed extinction curves, counts 3-4 population of grains responsible for the shape of extinction curve at the UV range, but for the extinction at the visual range it proposes only one population - so called large particles of the size about 10-8 m. These large particles cause selective extinction at the visual range, but appear to be "grey" at the UV range. For very large particles light obstruction may take place, which will affect all wavelengths alike and cause "neutral" interstellar extinction at both, the visual and UV spectral ranges. We may refer to "grey" or neutral extinction as non-selective extinction.
Since the Trumpler's discovery, it was usually assumed that the total interstellar extinction is proportional to the selective extinction, and that if there is any nonselective component of this extinction, its amount is strictly proportional to the selective as well (Aller & Trumpler 1939). This has led to the commonly accepted direct proportionality of the total interstellar extinction to the measure of its selective effect, the color excess: Av=R*E(B-V), with R being, at least for a given direction in the sky, constant.
Although small particles, responsible for the selective extinction probably predominate in the interstellar space, some regions may offer conditions which allow creation or survival of very large particles as well. The possible presence of such particles was announced and discussed in literature during the last few decades. These were already considered by Trumpler. His early paper (Trumpler 1930b) containes the following statement: "our Milky Way system seems to contain a considerable amount of finely divided matter, noticeable by its absorption of light. This matter appears to be made up mainly of: 1. Free atoms..., 2. Free electrons..., 3. Fine cosmic dust particles of various sizes ... producing the observed selective absorption..., and 4. Perhaps ... also larger meteoric bodies, obstructing light of all wavelengths equally, which may be responsible for a small part of the general absorption (residual effect)". For the residual effect he found an average value of 0.19 mag/kpc, in comparison to the selective one equal 0.31 mag/kpc. Strom et al. (1971), and Strom et al. (1972) have suggested that A and F type members of the open cluster NGC 2264, which appear to lie below zero age main sequence (ZAMS) in the [V,(B-V)]-plane, are probably surrounded by circumstellar, optically thick disk dust shells having nonselective absorption characteristics at visible wavelengths. Indication of a very high ratio of total to selective absorption for these stars appear to demand the presence of significant number of very large particles in mentioned shells. Jones (1972) similarly explained apparent weakening of some members of the Pleiades observed as apparently fainter than their co-members of supposedly the same physical characteristics. Andriesse et al. (1978) in their study on the possible condensation process of solid material around Eta Car, have concluded that such condensate may consist in part of disordered silicate grains with a size about 1 micrometer, which give an almost grey circumstellar extinction of as much as 3-4 mag in the visual and ultraviolet. Dunkin & Crawford (1998), from localisation of HD 35187B on the HR diagram (obtained with the aid of the reliable Hipparcos distance), have found evidence that this star is dimmed by about 0.4 mag of grey circumstellar extinction. Quite recently Jura et al. (2001) have explained the observed submillimeter fluxes from binaries: 17 Lep, 3 Pup and BM Gem as probably emitted by grains particles as large as 0.1 mm in radius. They have suggested that circumbinary disc particles may grow by coagulation even to sizes as large as 1 mm. Landgraf et al. (2000) have shown that the grains detected by space probes Ulysses and Galileo extend in their size distibution to 2.0 micrometer, well beyond the maximum sizes commonly adopted for typical interstellar grains, equal 0.25 micrometer, and may be part of the interstellar dust population of the local interstellar cloud. Witt et al. (2001) have examined the grain size distribution that gives rise to the X-ray halo around Nova Cygni 1992 and have suggested to extend the interstellar grain size distribution in the direction to this source to, and possibly even beyond 2.0 micrometer. Such large dust particles are grey at optical and UV wavelengths, and therefore their existence could not be constrained by the extinction curve analysis. Aguirre (1999), and Simonsen & Hannestad (1999) have demonstrated theoretically that the dimming of distant type Ia supernovae may be caused by large amounts of grey dust in the intergalactic medium. Dust grains can be grey either because they are non-spherical or very large. Moreover, Aguirre (1999) has shown that graphite grains, even as small as 0.1-0.25 micrometer, would be also too grey to have been detected by its reddening. Finally, as shown Zubko et al. (1996, 1998) such large grains seem to be necessary component of the grain model that match the observed extinction curves at the visual and UV.
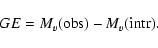
It is thus possible, that the total interstellar extinction (Av) may indeed consists of two components: selective and non-selective (grey - GE).
If Av includes a nonselective component, the contribution of this
component may be measured simply by difference between the observed absolute
magnitude of a star Mv(obs) (derived from its apparent brighteness (V),
distance (d), and Av estimated as R*E(B-V)),
and intrinsic absolute magnitude, Mv(intr),
atributed to spectral type and luminosity class (Sp/L) of this star by
calibration relations:
|
(1) |
![\begin{figure}
\par\includegraphics[width=8.1cm,clip]{H4400F1.eps}
\end{figure}](/articles/aa/full/2003/34/aah4400/img5.gif) |
Figure 1: Comparison of the observed absolute magnitudes with intrinsic ones for all (556) O-B3 stars of different luminosity classes, with distances up to 400 pc. The cross represents an average eror bar. |
| Open with DEXTER | |
Quite formally, a difference (1) may result from a spread of physical
properties of stars of the same spectral and luminosity class.
Lamers et al. (1997) have determined these differences for a few stars and
related them to stellar rotation (
 ).
Small sample of stars of different spectral types and
luminosity classes used in their analysis create however some doubts about
the relation found. Moreover, Jaschek & Gomez (1998), and Wegner (2000),
on the base of much larger samples of early type stars, have
not confirmed such a dependency on rotation.
Apart of any other stellar physical properties possibly
responsible for mentioned difference
(like e.g. stellar metallicity), the
simplest way to explain such difference seems to relate it
to interstellar extinction. Presented in Fig. 1
observed absolute magnitudes have been calculated with the average galactic
R value equal 3.1 (Wegner 1993).
This gives for the all considered 556 stars the average GE equal 1.3 mag R may vary from place to place in the sky, but
rarely, and only occasionally,
in some dense molecular clouds, it reach values 4 to 6 (Mathis 1990).
If we adopt, for all the stars presented in Fig. 1, R equal 6,
the resulting
average GE will still be significant - about 0.84 mag.
It is thus very difficult to explain presented GE effect
exclusively with unusual R values, and
seems reasonable to interpret the GE as possibly related to the
additional, neutral component of the interstellar extinction.
In the present paper, the GE effect, exhibited by
nearby early type stars with reliably determined distances and
spectral types is considered in context of its probable relation
to the neutral (grey) component of the interstellar dust extinction.
).
Small sample of stars of different spectral types and
luminosity classes used in their analysis create however some doubts about
the relation found. Moreover, Jaschek & Gomez (1998), and Wegner (2000),
on the base of much larger samples of early type stars, have
not confirmed such a dependency on rotation.
Apart of any other stellar physical properties possibly
responsible for mentioned difference
(like e.g. stellar metallicity), the
simplest way to explain such difference seems to relate it
to interstellar extinction. Presented in Fig. 1
observed absolute magnitudes have been calculated with the average galactic
R value equal 3.1 (Wegner 1993).
This gives for the all considered 556 stars the average GE equal 1.3 mag R may vary from place to place in the sky, but
rarely, and only occasionally,
in some dense molecular clouds, it reach values 4 to 6 (Mathis 1990).
If we adopt, for all the stars presented in Fig. 1, R equal 6,
the resulting
average GE will still be significant - about 0.84 mag.
It is thus very difficult to explain presented GE effect
exclusively with unusual R values, and
seems reasonable to interpret the GE as possibly related to the
additional, neutral component of the interstellar extinction.
In the present paper, the GE effect, exhibited by
nearby early type stars with reliably determined distances and
spectral types is considered in context of its probable relation
to the neutral (grey) component of the interstellar dust extinction.
In search for a possible non-selective interstellar extinction effects we should concentrate mainly on early type dwarfs. The influence of neutral (grey) extinction will simply "displace" these stars below the zero-age-main-sequence (ZAMS) in the [V,(B-V)]-plane (Eq. (1)). For giants or supergiants any misclassification of their luminosity classes pushing them on the C-M diagram toward the main sequence, may blur such effects of neutral extinction.
The reliable GE values may be determined only for stars with
precisely determined distances.
The Hipparcos - Tycho missions
have provided us with a large amount of homogeneous, high quality
trigonometric parallaxes and photometric data for many stars.
The Hipparcos Catalog (ESA 1997)
contains positions, proper motions and trigonometric parallaxes
with precisions much better than all previously available
for bright O, B stars.
These, together with the Tycho photometric data allow to
calculate the reliable GE values from:
 |
(2) |
To avoid uncertain parallaxes measurements, we have chosen from the Hipparcos
Catalog all O-B3 dwarfs with the Hipparcos distances up to 400 pc.
The resulting sample consists of 220 stars.
To check, if the proposed GE is indeed nonselective, GE values, as calculated from (2) for all chosen dwarfs,
are drawn against E(B-V) in the upper panel of Fig. 2.
No relation between both parameters is seen in this picture. Moreover,
even slightly reddened stars show significant GE effect.
![\begin{figure}
\par\includegraphics[width=8.1cm,clip]{H4400F2.eps}
\end{figure}](/articles/aa/full/2003/34/aah4400/img8.gif) |
Figure 2: The derived GE effect vs. E(B-V) and Hipparcos distances. |
| Open with DEXTER | |
The lower panel of Fig. 2 shows that
there is no dependency of GE on distance as well.
However, as it is shown in Fig. 3, the measure of the
selective interstellar extinction,
E(B-V), for the same stars, seems also not to depend on distance.
This may indicates for more complex distribution and physical
properties of the interstellar dust in the local galactic space.
![\begin{figure}
\par\includegraphics[width=8.1cm,clip]{H4400F3.eps}
\end{figure}](/articles/aa/full/2003/34/aah4400/img9.gif) |
Figure 3: E(B-V) vs. Hipparcos distances. |
| Open with DEXTER | |
In Fig. 4 the obtained GE values are
drawn against parallaxes errors as cited in the Hipparcos Catalog.
As it is seen the GE values seem not depend on parallax errors.
Moreover, the picture shows that most of considered stars have parallaxes determined with
precision better than 40 percent.
![\begin{figure}
\par\includegraphics[width=8.4cm,clip]{H4400F4.eps}
\end{figure}](/articles/aa/full/2003/34/aah4400/img10.gif) |
Figure 4: The dependency of the GE on errors in the Hipparcos trigonometric parallaxes. |
| Open with DEXTER | |
To examine the GE effect more in detail,
we have extracted from the above considered sample
only stars with trigonometric parallaxes measured with the precision better
than 15 percent. In Fig. 5 GE values for such 56 O and B dwarfs
are drawn vs. E(B-V) (upper panel), and against the
Hipparcos distances (lower panel). Again, as in Fig. 2, the GE effect
for these more precisely measured stars seems
not depend on E(B-V), but seems reach its maximum at distance fro 110 to
150 pc.
![\begin{figure}
\par\includegraphics[width=8.2cm,clip]{H4400F5.eps}
\end{figure}](/articles/aa/full/2003/34/aah4400/img11.gif) |
Figure 5: The GE vs. E(B-V) and Hipparcos distances for stars with the parallaxes errors less than 15 percent. |
| Open with DEXTER | |
This suggest, that the considered GE effect may indeed represents non-selective interstellar extinction. Moreover, lack of any distinct dependency of both, GE and E(B-V) on distances may suggests, that the matter responsible for both mentioned components of interstellar extinction is in the solar neighbourhood distributed very unhomogeneously.
The derived results presented in last figures motivate to search for possible relations of the GEeffect to observational characteristics of the interstellar matter. Unfortunately, general scarcity of data on interstellar matter properties toward particular stars force to include into consideration stars of different spectral and luminosity classes, and also stars with worse determined parallaxes. Use of unhomogeneous data may introduce significant scatter in relations studied. This should be taken into account in the interpretation of obtained results.
As a good estimation of the total amount of interstellar matter in particular direction we may use observed abundance of interstellar noble gases, like e.g. argon or krypton. Being chemically neutral, their total abundances along the line of sight are fully revealed by intensities of spectral lines of these elements. Unfortunately, determinations of the abundance of interstellar argon from spectra of O and B stars are very rare, and does not allow any statistical considerations. A slightly better situation is with the data for interstellar Kr I, for which abundances for 15 early type stars were determined by Cartledge et al. (2001) and Cardelli & Meyer (1997). These Kr I abundances are drawn in Fig. 6, in relation to the total interstellar extinction (selective, estimated as 3.1 E(B-V)) + non-selective (GE values)).
Despite possible large errors, due e.g. to a mix of
different spectral types,
luminosity classes, or parallax errors of stars presented in the figure,
the resulting relation, with correlation coefficient r= 0.89,
seem to suggest a direct relation of the GE to intestellar
matter. All the data used in Fig. 6 are
contained in the Table 1.
![\begin{figure}
\par\includegraphics[width=8.4cm,clip]{H4400F6.eps}
\end{figure}](/articles/aa/full/2003/34/aah4400/img13.gif) |
Figure 6:
The relation between column densities of interstellar krypton, and total extinction including
 and GE values. The average error
of krypton column densities is about 15 percent.
and GE values. The average error
of krypton column densities is about 15 percent. |
| Open with DEXTER | |
Among spectral features evidently related to the intestellar matter there
are the so called Diffuse Interstellar Bands (DIBs). Since their
discovery by Heger (1922), DIBs were intensively studied, but remain
still unidentified. Merrill & Wilson (1938) proved their strengths to be
related to colour excess. These authors were also the first to speculate that
DIBs might be "produced by small solid particles". The latest surveys of DIBs
have revealed more than 250 such features (Galazutdinov et al. 2000), most
however, are very weak. Such weak features can be detectable only in spectra
of very high signal to noise ratio (S/N). High quality spectra, necessary to
make measurements of such weak structures possible, were obtained with the
Sandiford echelle spectrograph fed with the 2.1 m telescope at McDonald
Observatory (Texas USA), and coudé echelle spectrometer fed by the two
meter telescope at Terscol Observatory (Northern Caucasus, Russia). The S/N ratios for spectra of individual stars are typically about 500. The
observations have been made by one of us (G.G) at the Terskol Observatory,
and by J. Krelowski at the McDonald Observatory.
![\begin{figure}
\par\includegraphics[width=8.3cm,clip]{H4400F7.eps}
\end{figure}](/articles/aa/full/2003/34/aah4400/img14.gif) |
Figure 7: Spectrum at the vicinity of the two considered DIBs (6367 and 6425 Å), indicated with the arrows. The ordinate scale is the intensity relative to the continuum. To to increase signal-to-noise ratio of these weak DIB's, the both presented fragments are average of 15 and 20 individual spectra, respectively, of three stars (HD 23180, HD 24912 and HD 24398). There are also visible other DIBs (much stronger) centred at 6375.95, 6379.29 Å (upper panel) and 6439.5, 5445.2 Å (lower panel). |
| Open with DEXTER | |
![\begin{figure}
\par\includegraphics[width=8.4cm,clip]{H4400F8.eps}
\end{figure}](/articles/aa/full/2003/34/aah4400/img15.gif) |
Figure 8: Comparison of the intensity of the two considered DIBs for three stars with different GE values: HD 149757, GE=0.10 mag, HD 210839, GE=1.45 mag, HD 183143, GE=2.84 mag. |
| Open with DEXTER | |
Inspection of the DIBs revealed some of them being well correlated with the above mentioned GE effect. Average profiles of two such features, centred at about 6367 and 6425 A, are presented in Fig. 7. Profiles of these DIBs for three individual stars of different GE values are shown in Fig. 8. Growth of these DIBs strength with that of GE value is clearly seen in the last figure. From available set of spectra of good quality, we have selected 34 early type stars for which GE values can be determined. Equivalent widths (W) of two mentioned DIBs (6367 and 6425 Å) are plotted in Figs. 9 and 10 versus the selective (R E(B-V)), and grey extinction (GE). These figures show two interesting facts. First, intensity for both DIBs is well correlated with GE effect (correlation coefficients, r, are 0.94 for 6367, and 0.93 for 6425). Second, GE is better correlated to the DIB's strength, than to the selective extinction - R E(B-V) (r=0.68 for 6367, and r=0.67 for 6425). It should be stressed, that measures compared in these figures are completely independent. The intensity of spectral features (W) have been determined directly from stellar spectra, while GE, as well as R E(B-V), were derived exclusively from observed global stellar characteristics. Relations shown in Figs. 9 and 10 strongly support the relation of the measured GE effect to the interstellar matter rather than to the intrinsic global stellar characteristics. In Fig. 11 similar relations are presented for the same 34 OB stars for one of the strongest of known DIBs, centred about 5780 Å, and in Fig. 12 for another weak DIB, centred at 6194 Å. Both these features seem to be better related to the selective (R E(B-V)), than to the grey (GE) extinction, quite opposite to DIBs at 6367 and 6425 Å. This seems not only to release presented relations from suspicion to be instrumental, or simply artefacts, but suggest that both considered measures (E(B-V) and GE) relate to different interstellar grains populations: the E(B-V) to small size particles, while the GE to very large ones.
Table 1: The gray extinction for stars with known krypton column densities.
The stellar data concernig presented relations of GE to intensities DIB's
at 6367 and 6425 Å are listed in the Table 2.
![\begin{figure}
\par\includegraphics[width=8.2cm,clip]{H4400F9.eps}
\end{figure}](/articles/aa/full/2003/34/aah4400/img35.gif) |
Figure 9:
Equivalent widths of 6367 vs. GE (filled circles- straight
line) and vs.
 (open circles).
 |
| Open with DEXTER | |
![\begin{figure}
\par\includegraphics[width=8.2cm,clip]{H4400F10.eps}
\end{figure}](/articles/aa/full/2003/34/aah4400/img36.gif) |
Figure 10:
Equivalent widths of 6425 vs. GE (filled circles-
straight line) and vs.
(open circles). |
| Open with DEXTER | |
![\begin{figure}
\par\includegraphics[width=8.2cm,clip]{H4400F11.eps}
\end{figure}](/articles/aa/full/2003/34/aah4400/img37.gif) |
Figure 11:
Equivalent widths of 5780 vs. GE (filled circles) and
vs.
(open circles- straight line). The data for
equivalent widths for 21 stars were taken from Krelowski et al. (1999),
for the remaining 13 were determined in the present paper. |
| Open with DEXTER | |
![\begin{figure}
\par\includegraphics[width=8cm,clip]{H4400F12.eps}
\end{figure}](/articles/aa/full/2003/34/aah4400/img38.gif) |
Figure 12:
Central depths (in percentage of the continuum)
of DIB centred at 6194 Å vs. GE (filled circles) and vs.
(open circles- straight line). |
| Open with DEXTER | |
![\begin{figure}
\par\includegraphics[width=8cm,clip]{H4400F13.eps}
\end{figure}](/articles/aa/full/2003/34/aah4400/img40.gif) |
Figure 13:
Upper panel: relation of GE (filled circles- straight line) and
 (open circles)
to degree of interstellar polarization.
Lower panel: relation of the equivalent width of 6367 (open circles-thick line) and 6425
(filled circles-thin line) to interstellar polarization. Typical
errors of used polarization data are 10 to 20 percent.
(open circles)
to degree of interstellar polarization.
Lower panel: relation of the equivalent width of 6367 (open circles-thick line) and 6425
(filled circles-thin line) to interstellar polarization. Typical
errors of used polarization data are 10 to 20 percent. |
| Open with DEXTER | |
Interstellar polarization is mainly caused by the interstellar dust grains. The relation of the colour excess, E(B-V) to the degree of polarization is a well known, and confirm of origin of the selective interstellar extinction from scatter of stellar light on small size dust particles. It is interesting to check, how the measured GE effect depends on polarization. The upper panel of Fig. 13 presents relation of considered measures of supposed two components of the interstellar extinction, selective (R E(B-V)), and non-selective (GE), to the polarization degree. The GE effect seems to reveal quite good correlation with the polarization (r=0.77), not worse than that of selective extinction (r=0.59). Similarly good correlation with interstellar polarization is exhibited also by the intensities of both above mentioned DIB's: at 6367 and 6425 Å as is shown in the lower panel of Fig. 13 (r=0.80 and r=0.85, respectively).
Table 2: The grey extinction for stars with measured equivalent width of two DIBs 6367 and 6425.
All the data on polarization have been taken from Mathewson et al. (1978). Presented correlations of GE and DIB's intensities with degree of interstellar polarization seem to suggest their direct relation to interstellar dust grains.
The performed analysis of the available astrometric, spectroscopic and photometric data for early type stars in the solar neighborhood indicate, that observed weakening brighteness of many of these in comparison to expected from their Hipparcos distances and intrinsic absolute magnitudes, called by us the GE effect, may be explained by the existence along observed directions, of large interstellar grains causing neutral (grey) extinction, similar to those considered in the literature.
The interstellar extinction interpretation of the GE effect seems to be supported by distinct correlation between the adopted GE measure (Eqs. (1) and (2)), and the total amount of the interstellar matter indicated by the column density of the noble gas (Kr I) or intensities of some diffuse interstellar bands (e.g. those centred at 6367 Å and 6425 Å).
Surprisingly good correlation between GE and W of the two mentioned DIBs
over large range of GE, as presented in Figs. 9 and 10,
and distinct relation of the GE to the degree of
interstellar polarization shown in Fig. 13,
seem to strongly suggest, that both, the adopted GE measure,
and the two considered DIBs (6367 and 6425 Å)
are related to "super large"
interstellar dust particles responsible for the grey (non-selective)
interstellar extinction.
To illustrate, how significant is this grey (neutral) extinction in the
solar neighbourhood, in Fig. 14 are presented histograms of the
percentage distribution of the GE values for the both chosen
samples of close O-B3 dwarfs (Sect. 2).
The upper panel presents the GE distribution for all dwarfs
up to 400 pc, the lower one for stars with parallaxes errors less than 15 percent.
The "zero" on the abscissa indicates the zero difference between
absolute magnitudes taken from the Schmidt-Kaler calibration, and those
derived from the Hipparcos parallaxes corrected to the selective
extinction effects.
![\begin{figure}
\par\includegraphics[width=8.1cm,clip]{H4400F14.eps}
\end{figure}](/articles/aa/full/2003/34/aah4400/img69.gif) |
Figure 14: The percentage distribution of the GE effect for 220 O-B3 dwarfs up to 400 pc (upper panel) and subsample of the same stars with parallax errors less then 15 percent (lower panel). |
| Open with DEXTER | |
The distinct asymmetry in both presented distributions suggests a significant value (up to a few magnitudes!) of possible neutral extinction at the distances up to only 400 pc. Such a strong, local neutral extinction can significantly change not only estimation of global physical characteristics of close stars, but also a view of the spatial distribution of objects at the local galactic region.