A&A 408, 119-125 (2003)
DOI: 10.1051/0004-6361:20030950
D. Porquet1 - J. N. Reeves2,3
1 - Max-Plank-Institut für extraterrestrische Physik, Postfach 1312,
85741 Garching, Germany
2 - Laboratory for High Energy Astrophysics, Code 662.0,
NASA Goddard Space Flight Center, Greenbelt, MD 20771, USA
3 - Universities Space Research Association
Received 12 March 2003 / Accepted 16 June 2003
Abstract
We present an XMM-Newton observation of the radio-quiet quasar
Q0056-363 (z=0.162). This is the first time that this quasar
is observed in the hard X-ray range (above 2 keV).
We find that Q0056-363 is a powerful X-ray quasar,
with a 0.3-12 keV unabsorbed luminosity
of about
![]() erg s-1
with the largest part (
erg s-1
with the largest part (![]() 67
67![]() )
emitted below 2 keV. The spectrum reveals a large featureless
soft X-ray excess below 2 keV and a strong broad Fe K
)
emitted below 2 keV. The spectrum reveals a large featureless
soft X-ray excess below 2 keV and a strong broad Fe K![]() line at
6.4 keV (in the quasar frame).
The Fe K
line at
6.4 keV (in the quasar frame).
The Fe K![]() line is due to low to moderate ionization states of iron
(i.e., <Fe XVII),
with an equivalent width of about 250 eV and a velocity
width of about 25 000 km s-1.
Q0056-363 is presently the most luminous AGN known
to exhibit such a broad and intense Fe K
line is due to low to moderate ionization states of iron
(i.e., <Fe XVII),
with an equivalent width of about 250 eV and a velocity
width of about 25 000 km s-1.
Q0056-363 is presently the most luminous AGN known
to exhibit such a broad and intense Fe K![]() line profile
from near neutral iron.
The line can be fitted with a relativistic profile from an accretion disc
around either a Schwarzschild (non-rotating)
or a Kerr (rotating) black hole.
A combination of two thermal Comptonization components and
a disc reflection model is favored to explain
both the continuum over the energy range 0.3-12 keV
and the Fe K
line profile
from near neutral iron.
The line can be fitted with a relativistic profile from an accretion disc
around either a Schwarzschild (non-rotating)
or a Kerr (rotating) black hole.
A combination of two thermal Comptonization components and
a disc reflection model is favored to explain
both the continuum over the energy range 0.3-12 keV
and the Fe K![]() line.
A patchy corona covering a large part of the inner disc surface
is needed in order to be compatible with the accretion rate
inferred from the spectral energy distribution of Q0056-363,
unless the mass of the black hole is much higher than
about
line.
A patchy corona covering a large part of the inner disc surface
is needed in order to be compatible with the accretion rate
inferred from the spectral energy distribution of Q0056-363,
unless the mass of the black hole is much higher than
about
![]() .
.
Key words: galaxies: active - X-rays: galaxies - accretion discs - quasars: individual: Q0056-363
In Active Galactic Nuclei (AGN), from Seyfert galaxies to quasars,
several X-ray features can help us to understand the central region
of these powerful objects. The first one is the so-called soft excess
seen below 2-3 keV
(Arnaud et al. 1985; Turner & Pounds 1989).
This spectral characteristic is thought to be the high energy part of the
"big blue bump'' (BBB) extending down to 1 ![]() m,
which contains a large fraction
of the bolometric luminosity. Recently Pounds & Reeves (2002),
using XMM-Newton observations,
showed that a soft X-ray excess is seen in all
their sample (6 Seyfert galaxies)
with an amplitude and a breadth increasing with luminosity.
Current interpretations of the soft excess range from intrinsic thermal
emission from the accretion disc, to reprocessing of harder radiation absorbed
in the thin disk (Pounds & Reeves 2002).
Another important component is emission and/or absorption,
mainly in the soft X-ray range, due to the Warm Absorber
medium supposed to be located between the Broad Line Region
and the Narrow Line Region
(e.g., Reynolds & Fabian 1995; Porquet et al. 1999).
However these absorption and/or emission features seem to be only
seen in low-luminosity AGN, such as Seyfert galaxies.
The Fe K
m,
which contains a large fraction
of the bolometric luminosity. Recently Pounds & Reeves (2002),
using XMM-Newton observations,
showed that a soft X-ray excess is seen in all
their sample (6 Seyfert galaxies)
with an amplitude and a breadth increasing with luminosity.
Current interpretations of the soft excess range from intrinsic thermal
emission from the accretion disc, to reprocessing of harder radiation absorbed
in the thin disk (Pounds & Reeves 2002).
Another important component is emission and/or absorption,
mainly in the soft X-ray range, due to the Warm Absorber
medium supposed to be located between the Broad Line Region
and the Narrow Line Region
(e.g., Reynolds & Fabian 1995; Porquet et al. 1999).
However these absorption and/or emission features seem to be only
seen in low-luminosity AGN, such as Seyfert galaxies.
The Fe K![]() line complex observed in the 6-7 keV range is
also an important spectral tool.
Indeed the study of this fluorescent line complex
allows us to probe dense matter from the inner disc to the molecular torus
as found recently in several AGN
(e.g. Mrk 205, Reeves et al. 2001;
Mrk 509, Pounds et al. 2001).
line complex observed in the 6-7 keV range is
also an important spectral tool.
Indeed the study of this fluorescent line complex
allows us to probe dense matter from the inner disc to the molecular torus
as found recently in several AGN
(e.g. Mrk 205, Reeves et al. 2001;
Mrk 509, Pounds et al. 2001).
In this paper we present an XMM-Newton observation of
Q0056-363, a radio-quiet quasar
(z = 0.162, Hewitt & Burbidge 1989;
![]() ,
,
![]() ,
2MASS, Cutri et al. 2003)
detected for the first time
in the ESO B Southern Sky Survey (Monk et al. 1986).
It has strong, broad permitted optical emission lines
(e.g., FWHM(H
,
2MASS, Cutri et al. 2003)
detected for the first time
in the ESO B Southern Sky Survey (Monk et al. 1986).
It has strong, broad permitted optical emission lines
(e.g., FWHM(H
![]() km s-1, Grupe et al. 1999),
which led to it being described as a Broad-Line Seyfert 1 AGN.
Until now, this quasar was only observed in the X-ray domain by ROSAT,
i.e. below 2.4 keV (RASS: Thomas et al. 1998,
HRI: Grupe et al. 2001).
We present here the first observation of this
object in the hard X-ray range up to 12 keV.
km s-1, Grupe et al. 1999),
which led to it being described as a Broad-Line Seyfert 1 AGN.
Until now, this quasar was only observed in the X-ray domain by ROSAT,
i.e. below 2.4 keV (RASS: Thomas et al. 1998,
HRI: Grupe et al. 2001).
We present here the first observation of this
object in the hard X-ray range up to 12 keV.
Table 1: Summary of the data used to build the spectral energy distribution of Q0056-363. C03: Cutri et al. (2003). M03: Monet et al. (2003). UVW2 is the OM filter used during the present XMM-Newton observation. G99: Grupe et al. (1999). INES: Merged Log of IUE Observations (NASA-ESA, 1999).
Note that all fit parameters are given in the quasar's rest frame,
with values of
![]() km s-1 Mpc-1,
and
km s-1 Mpc-1,
and
![]() assumed throughout.
The errors quoted correspond to 90%
confidence ranges for one interesting parameter
(
assumed throughout.
The errors quoted correspond to 90%
confidence ranges for one interesting parameter
(
![]() ).
Abundances are those of Anders & Grevesse (1989).
In the following, we use the updated cross-sections for X-ray absorption by
the interstellar medium from Wilms et al. (2000).
).
Abundances are those of Anders & Grevesse (1989).
In the following, we use the updated cross-sections for X-ray absorption by
the interstellar medium from Wilms et al. (2000).
We present an archived XMM-Newton observation of Q0056-363
on July 5, 2000 (ID 0102040701; orbit 145; exposure time ![]() 20 ks).
The EPIC MOS cameras (Turner et al. 2001)
operated in the Small Window mode,
while the EPIC PN camera (Strueder et al. 2001)
was operated in the standard Full Frame mode.
For operational reasons, the MOS observations are
divided into two separate exposures of
20 ks).
The EPIC MOS cameras (Turner et al. 2001)
operated in the Small Window mode,
while the EPIC PN camera (Strueder et al. 2001)
was operated in the standard Full Frame mode.
For operational reasons, the MOS observations are
divided into two separate exposures of ![]() 5 ks,
one with the thin filter and the other one with the thick filter.
Since the MOS data give considerably lower net counts compared
to the PN data (thin filter), we proceed to use only the PN for the present
analysis.
The data are re-processed and cleaned (net time exposure
5 ks,
one with the thin filter and the other one with the thick filter.
Since the MOS data give considerably lower net counts compared
to the PN data (thin filter), we proceed to use only the PN for the present
analysis.
The data are re-processed and cleaned (net time exposure ![]() 14.8 ks) using the
XMM-Newton SAS VERSION 5.3.3 (Science Analysis Software) package.
Since pile-up effect is negligible according to the EPATPLOT SAS task,
X-ray events corresponding to patterns 0-4 events (single and double pixels)
are selected for the PN.
A low-energy cutoff is set to 300 eV.
The source spectrum and the light curve are extracted
using a circular region of diameter 40
14.8 ks) using the
XMM-Newton SAS VERSION 5.3.3 (Science Analysis Software) package.
Since pile-up effect is negligible according to the EPATPLOT SAS task,
X-ray events corresponding to patterns 0-4 events (single and double pixels)
are selected for the PN.
A low-energy cutoff is set to 300 eV.
The source spectrum and the light curve are extracted
using a circular region of diameter 40
![]() (to avoid the edge
of the chip) centered on the source position.
Q0056-363 is by far the brightest X-ray source in this
30
(to avoid the edge
of the chip) centered on the source position.
Q0056-363 is by far the brightest X-ray source in this
30![]() EPIC field-of-view.
Background spectra are taken from an annular radius center on Q0056-363,
between 4
EPIC field-of-view.
Background spectra are taken from an annular radius center on Q0056-363,
between 4![]() and 8
and 8![]() (excluding X-ray point sources,
and the columns passing through the source to avoid out-of-time events).
The XSPEC V11.2 software package is used for spectral
analysis of the background-subtracted spectrum
using the response matrices and ancillary files derived from the SAS tasks
RMFGEN and ARFGEN.
The PN spectrum is binned to give a minimum of 20 counts per bin.
(excluding X-ray point sources,
and the columns passing through the source to avoid out-of-time events).
The XSPEC V11.2 software package is used for spectral
analysis of the background-subtracted spectrum
using the response matrices and ancillary files derived from the SAS tasks
RMFGEN and ARFGEN.
The PN spectrum is binned to give a minimum of 20 counts per bin.
Data from the Reflection Grating Spectrograph (RGS; den Herder et al. 2001) are also re-processed using the SAS RGSPROC script, giving effective exposure time of 19.5 ks and 18.9 ks. The signal to noise ratio is not sufficient for reliable RGS data analysis.
The OM took a sequence of 4 exposures (1000 s each)
through the UVW2 filter. We calculate for all exposures the UV fluxes;
these are,
![]() ,
,
![]() ,
,
![]() ,
and
,
and
![]() respectively, expressed in units of 10-14 erg cm-2 s-1 A-1.
All values are compatible within the error bars indicating
no appreciable UV variability.
respectively, expressed in units of 10-14 erg cm-2 s-1 A-1.
All values are compatible within the error bars indicating
no appreciable UV variability.
We use the ![]() ,
H and J magnitudes from the 2MASS point source
catalog released in March 2003
(Cutri et al. 2003, http://www.ipac.caltech.edu/2mass/),
and the I magnitude from the USNO-B Catalog (Monet et al. 2003).
To convert these magnitude in flux we use the Johnson UBVRI
photometric system (Campins et al. 1985).
We use the optical spectra from Grupe et al. (1999, ESO/MPI 2.2 m telescope)
in the Red and Blue range. The UV spectrum is from an IUE
observation (NASA-ESA, 1999, ftp://archive.stsci.edu/pub/iue/data/).
The X-ray part is the unabsorbed XMM-Newton PN spectrum (this work).
Up to now Q0056-363 is not yet observed above 12 keV.
Table 1 reports the observation dates and references.
We take into account the Galactic extinction
using
E(B-V)=0.014 mag (Schlegel et al. 1998),
using the extinction formulae from Seaton (1979) for the UV,
from O'Donnell (1994) for the optical and from Ryter (1996)
for the IR.
The spectral energy distribution for Q0056-363 is reported in
Fig. 1.
,
H and J magnitudes from the 2MASS point source
catalog released in March 2003
(Cutri et al. 2003, http://www.ipac.caltech.edu/2mass/),
and the I magnitude from the USNO-B Catalog (Monet et al. 2003).
To convert these magnitude in flux we use the Johnson UBVRI
photometric system (Campins et al. 1985).
We use the optical spectra from Grupe et al. (1999, ESO/MPI 2.2 m telescope)
in the Red and Blue range. The UV spectrum is from an IUE
observation (NASA-ESA, 1999, ftp://archive.stsci.edu/pub/iue/data/).
The X-ray part is the unabsorbed XMM-Newton PN spectrum (this work).
Up to now Q0056-363 is not yet observed above 12 keV.
Table 1 reports the observation dates and references.
We take into account the Galactic extinction
using
E(B-V)=0.014 mag (Schlegel et al. 1998),
using the extinction formulae from Seaton (1979) for the UV,
from O'Donnell (1994) for the optical and from Ryter (1996)
for the IR.
The spectral energy distribution for Q0056-363 is reported in
Fig. 1.
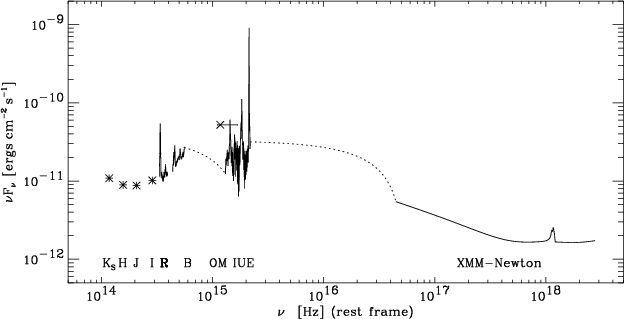 |
Figure 1: Spectral energy distribution of Q0056-363. The references of magnitudes, fluxes, and spectra are reported in Table 1. |
| Open with DEXTER | |
Summing the integrated fluxes, from ![]() and B bands,
inside the IUE and the XMM-Newton
domains, we estimate a luminosity of
and B bands,
inside the IUE and the XMM-Newton
domains, we estimate a luminosity of
![]() erg s-1.
We find that the luminosities in the IUE and XMM-Newton domains
are about
erg s-1.
We find that the luminosities in the IUE and XMM-Newton domains
are about
![]() erg s-1 and
erg s-1 and
![]() erg s-1,
respectively.
If we take into account the linearly interpolated fluxes between
the B and the IUE domains,
and between the IUE and XMM-Newton spectra (see Fig. 1),
we find a bolometric luminosity of about
erg s-1,
respectively.
If we take into account the linearly interpolated fluxes between
the B and the IUE domains,
and between the IUE and XMM-Newton spectra (see Fig. 1),
we find a bolometric luminosity of about
![]() erg s-1.
We notice that the largest part of the Eddington luminosity (i.e.
erg s-1.
We notice that the largest part of the Eddington luminosity (i.e. ![]() 80%)
is emitted between the IUE and XMM-Newton domain, where there is
no data due to absorption by neutral hydrogen located in our Galaxy,
between about 100 Å (120 eV) and 912 Å (13.6 eV).
80%)
is emitted between the IUE and XMM-Newton domain, where there is
no data due to absorption by neutral hydrogen located in our Galaxy,
between about 100 Å (120 eV) and 912 Å (13.6 eV).
According to the relation between the black hole (BH) mass
and the width and strength of the H![]() line
measured in Grupe et al. (1999),
we infer a BH mass in Q0056-363
of about
line
measured in Grupe et al. (1999),
we infer a BH mass in Q0056-363
of about
![]() or of about
or of about
![]() using the
formulae from McLure & Dunlop (2002)
and McLure & Jarvis (2002) respectively.
The Eddington luminosity (
using the
formulae from McLure & Dunlop (2002)
and McLure & Jarvis (2002) respectively.
The Eddington luminosity (
![]() )
is then
)
is then
![]() erg s-1
(
erg s-1
(
![]() erg s-1) for
erg s-1) for
![]() (
(
![]() ).
Then the accretion rate values, as a fraction of the Eddington rate
(i.e.
).
Then the accretion rate values, as a fraction of the Eddington rate
(i.e.
![]() )
are 0.77 and 0.57 for
)
are 0.77 and 0.57 for
![]() and
and
![]() ,
respectively.
,
respectively.
We find an average count rate in the 0.3-12 keV energy range
for the PN data of
![]() cts s-1.
The light curve does not show any evidence of variability, a fit to
a constant count rate is acceptable
(yielding a
cts s-1.
The light curve does not show any evidence of variability, a fit to
a constant count rate is acceptable
(yielding a ![]() of 148 for 163 degrees of freedom).
As there is no significant variability detected during this observation,
we sum the data over the whole observation.
First, a single absorbed power-law model is fitted to
the overall 0.3-12 keV PN spectrum, but we find a poor fit
(
of 148 for 163 degrees of freedom).
As there is no significant variability detected during this observation,
we sum the data over the whole observation.
First, a single absorbed power-law model is fitted to
the overall 0.3-12 keV PN spectrum, but we find a poor fit
(
![]() for 527 d.o.f.
with
for 527 d.o.f.
with
![]() ).
We find no additional absorption, located at the quasar redshift,
compared to the Galactic column density
(i.e.,
).
We find no additional absorption, located at the quasar redshift,
compared to the Galactic column density
(i.e.,
![]() cm-2).
Therefore in all subsequent fits, the column density is fixed to the
Galactic value.
cm-2).
Therefore in all subsequent fits, the column density is fixed to the
Galactic value.
To characterize the hard X-ray continuum, we fit an absorbed
power-law model over the 2.5-5 keV energy range where the spectrum should
be relatively unaffected by the presence
of a broad soft excess, a Warm Absorber-Emitter
medium, a Fe K![]() emission line,
and of a contribution above 8 keV from
a high energy Compton reflection hump.
In this energy range, the data are well fitted by a single power-law model
with
emission line,
and of a contribution above 8 keV from
a high energy Compton reflection hump.
In this energy range, the data are well fitted by a single power-law model
with
![]() (
(
![]() ).
Figure 2 displays the spectrum
extrapolated over the 0.3-12 keV broad band energy.
A strong positive residual is clearly seen below 2 keV
due to the presence of a soft X-ray excess.
In addition, a strong deviation near 5.5 keV (6.4 keV in the quasar rest-frame) is seen,
suggesting the presence of a Fe K
).
Figure 2 displays the spectrum
extrapolated over the 0.3-12 keV broad band energy.
A strong positive residual is clearly seen below 2 keV
due to the presence of a soft X-ray excess.
In addition, a strong deviation near 5.5 keV (6.4 keV in the quasar rest-frame) is seen,
suggesting the presence of a Fe K![]() line complex.
line complex.
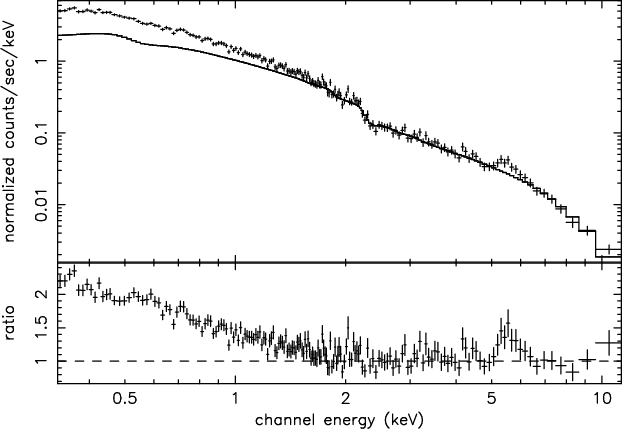 |
Figure 2:
The PN spectrum of Q0056-363 (in the observer frame).
A power-law has been fitted to the 2.5-5 keV data
and extrapolated to lower and higher energies.
A broad, strong soft X-ray excess is
clearly seen extending to |
| Open with DEXTER | |
Next, we fit the 0.3-2 keV energy range with a
single absorbed power-law, and find a reasonable
fit with a photon index of
![]() (
(
![]() ).
This value is compatible with
).
This value is compatible with
![]() (Grupe et al. 1999)
and with the slope between
2 500 Å and 2 keV of
(Grupe et al. 1999)
and with the slope between
2 500 Å and 2 keV of
![]() inferred from December 1990 observation
(ROSAT All-Sky Survey, Grupe et al. 2001).
The 0.3-5 keV energy range is well fitted by the combination
of a blackbody and a power-law component.
We find
inferred from December 1990 observation
(ROSAT All-Sky Survey, Grupe et al. 2001).
The 0.3-5 keV energy range is well fitted by the combination
of a blackbody and a power-law component.
We find
![]() eV
and
eV
and
![]() (
(
![]() ).
Since the soft-excess feature is both large and broad,
we add two other blackbody
components and a better fit is obtained:
).
Since the soft-excess feature is both large and broad,
we add two other blackbody
components and a better fit is obtained:
![]() eV,
eV,
![]() eV,
eV,
![]() eV,
and
eV,
and
![]() (
(
![]() ).
The three blackbody components represent a large percentage
(compared to the power-law component) of the total
flux in the 0.3-2 keV energy range, of
).
The three blackbody components represent a large percentage
(compared to the power-law component) of the total
flux in the 0.3-2 keV energy range, of
![]() .
The high-energy power-law slope in the multi-component model is consistent
with the
.
The high-energy power-law slope in the multi-component model is consistent
with the
![]() index commonly seen in radio-quiet
quasars (e.g. Reeves & Turner 2000).
In order to obtain a more physical representation of the soft excess, we
also test multi-temperature disc models, which may be expected if the
soft X-ray excess originates via thermal emission from the inner accretion
disc in Q0056-363. The DISKBB (non-relativistic) and DISKPN
(relativistic) models within XSPEC are used, together with a power-law to
model the hard X-ray emission above 2 keV.
Equally good fits are obtained for both models.
For the first model we find
index commonly seen in radio-quiet
quasars (e.g. Reeves & Turner 2000).
In order to obtain a more physical representation of the soft excess, we
also test multi-temperature disc models, which may be expected if the
soft X-ray excess originates via thermal emission from the inner accretion
disc in Q0056-363. The DISKBB (non-relativistic) and DISKPN
(relativistic) models within XSPEC are used, together with a power-law to
model the hard X-ray emission above 2 keV.
Equally good fits are obtained for both models.
For the first model we find
![]() eV
and
eV
and
![]() (
(
![]() ),
and similar parameters are found for the second model
with
),
and similar parameters are found for the second model
with
![]() eV
and
eV
and
![]() (
(
![]() ).
The inner disc temperatures obtained through either of these models
appear to be unusually high, for what one would expect from a
standard steady state
).
The inner disc temperatures obtained through either of these models
appear to be unusually high, for what one would expect from a
standard steady state ![]() thin accretion disc.
Assuming a BH mass of about 4.5-
thin accretion disc.
Assuming a BH mass of about 4.5-
![]() ,
we expect a maximum temperature of only about 15 eV
at 3
,
we expect a maximum temperature of only about 15 eV
at 3 ![]() (e.g., Peterson 1997).
(e.g., Peterson 1997).
We find no evidence for significant intrinsic cold or warm
absorption. Adding two absorption edges of O VII (0.7 keV)
or O VIII (0.87 keV),
we infer edge optical depth limits of ![]() .
The lack of significant spectral absorption
features implies that we are seeing the bare quasar continuum emission.
.
The lack of significant spectral absorption
features implies that we are seeing the bare quasar continuum emission.
As shown in Fig. 2,
a very strong deviation is seen near 5.5 keV in the observer frame,
i.e. about 6.4 keV in the quasar frame.
In the overall 2.5-12 keV energy band,
adding a Gaussian line to a single power-law model
drops the ![]() value by 17 with the addition of 3 degrees of freedom
(Table 2), significant at >99.95% according to the F-test.
Adding an ionised emission line and an absorption edge do not
improve the fit (
value by 17 with the addition of 3 degrees of freedom
(Table 2), significant at >99.95% according to the F-test.
Adding an ionised emission line and an absorption edge do not
improve the fit (
![]() for 4 additional parameters).
for 4 additional parameters).
Table 2:
Best-fitting spectral parameters in the 2.5-12 keV energy range
for an absorbed (
![]() cm-2)
power-law (PL) component plus a line profile:
GA: Gaussian profile; and DISKLINE and LAOR: profile line
emitted by a relativistic accretion disk for a non-rotating BH and
a maximally rotating BH, respectively (Fabian et al. 1989; Laor 1991).
The line fluxes are expressed in erg cm-2 s1.
We assume an emissivity law q equal to -2.
(a):
cm-2)
power-law (PL) component plus a line profile:
GA: Gaussian profile; and DISKLINE and LAOR: profile line
emitted by a relativistic accretion disk for a non-rotating BH and
a maximally rotating BH, respectively (Fabian et al. 1989; Laor 1991).
The line fluxes are expressed in erg cm-2 s1.
We assume an emissivity law q equal to -2.
(a):
![]() and
and
![]() ,
inclination = 30
,
inclination = 30![]() .
(b):
.
(b):
![]() and
and
![]() ,
inclination = 30
,
inclination = 30![]() .
(c): The energy of the line has been fixed to 6.4 keV (see text).
.
(c): The energy of the line has been fixed to 6.4 keV (see text).
We find that the line is well resolved
with a full width at half maximum (FWHM) velocity width
of about 25 400 km s-1,
and a large equivalent width of about 275 eV (Table 2).
The line width indicates that the X-ray emission is
originating from a region close to the BH in Q0056-363.
For a Keplerian disc, inclined at 30 degrees
to the line of sight, this velocity implies that the iron line emission is
occurring at a typical distance of 30 gravitational radii
(
![]() )
from the putative massive BH.
The FWHM of the line is only about four times
smaller than the one found in the Seyfert 1 MCG-6-30-15,
which shows the most extreme broad Fe K
)
from the putative massive BH.
The FWHM of the line is only about four times
smaller than the one found in the Seyfert 1 MCG-6-30-15,
which shows the most extreme broad Fe K![]() line observed up to now
(e.g., 100 000 km s-1, Tanaka et al. 1995;
Wilms et al. 2001; Fabian et al. 2002; Lee et al. 2002).
Since the line profile appears broad, and is likely to originate within
line observed up to now
(e.g., 100 000 km s-1, Tanaka et al. 1995;
Wilms et al. 2001; Fabian et al. 2002; Lee et al. 2002).
Since the line profile appears broad, and is likely to originate within
![]() of the BH, we proceed to fit the line with a
profile expected from a relativistic accretion disk around a non-rotating
(Schwarzschild) BH, using the DISKLINE model in XSPEC
from Fabian et al. (1989). We find that such a profile,
with a typical inclination of 30
of the BH, we proceed to fit the line with a
profile expected from a relativistic accretion disk around a non-rotating
(Schwarzschild) BH, using the DISKLINE model in XSPEC
from Fabian et al. (1989). We find that such a profile,
with a typical inclination of 30![]() for a type 1 AGN,
emitted at a rest-frame energy of 6.4 keV,
provides an excellent representation of the line observed in Q0056-363
(see Table 2).
An equally good fit is obtained for a maximally rotating BH (Kerr)
disc emission line model ( LAOR; Laor 1991).
A higher signal to noise ratio spectrum is required to discriminate
between the Schwarzschild and the Kerr BH, and to determine the BH spin, if any.
for a type 1 AGN,
emitted at a rest-frame energy of 6.4 keV,
provides an excellent representation of the line observed in Q0056-363
(see Table 2).
An equally good fit is obtained for a maximally rotating BH (Kerr)
disc emission line model ( LAOR; Laor 1991).
A higher signal to noise ratio spectrum is required to discriminate
between the Schwarzschild and the Kerr BH, and to determine the BH spin, if any.
The line profile and intensity are unusual for such a high X-ray luminosity AGN
(i.e.
![]() erg s-1),
where any broad line component is generally
expected to be weak and highly ionised.
As reported by Nandra et al. (1997),
in a composite ASCA spectrum of high luminosity AGN, a very weak or negligible
red wing is found in quasars whilst a blue (or ionised) side may be seen.
Therefore the Fe K
erg s-1),
where any broad line component is generally
expected to be weak and highly ionised.
As reported by Nandra et al. (1997),
in a composite ASCA spectrum of high luminosity AGN, a very weak or negligible
red wing is found in quasars whilst a blue (or ionised) side may be seen.
Therefore the Fe K![]() line profile in Q 0056-363
appears different from the average profile
for such high luminosity objects, as the
profile is consistent with a line emitted
by a cold material in a relativistic accretion disk.
The equivalent width of the line is also much
stronger than that usually found in high luminosity quasars,
where the overall strength of the line is thought to diminish with luminosity
(e.g. Reeves & Turner 2000).
The detection of broad iron lines appears to be rather rare for
luminous quasars.
We note that a weak, but broad iron line has been reported in
the radio-loud quasar 3C 273
(Yaqoob & Serlemitsos 2000), from ASCA and RXTE
observations.
However any broad Fe K
line profile in Q 0056-363
appears different from the average profile
for such high luminosity objects, as the
profile is consistent with a line emitted
by a cold material in a relativistic accretion disk.
The equivalent width of the line is also much
stronger than that usually found in high luminosity quasars,
where the overall strength of the line is thought to diminish with luminosity
(e.g. Reeves & Turner 2000).
The detection of broad iron lines appears to be rather rare for
luminous quasars.
We note that a weak, but broad iron line has been reported in
the radio-loud quasar 3C 273
(Yaqoob & Serlemitsos 2000), from ASCA and RXTE
observations.
However any broad Fe K![]() line profile present in a long (100 ksec) high
signal to noise XMM-Newton observation of 3C 273 is very
weak, at least down to the level of the systematic calibration
uncertainties present in the PN detector, i.e. <5% of the
continuum level at 6 keV (Reeves 2002).
A broad iron line has recently been reported in the
gravitationally micro-lensed quasar QSO 2237+0305
(Dai et al. 2003), from a Chandra ACIS observation. However
it is likely that the (uncertain) intrinsic X-ray luminosity
of this object is below 1045 erg cm-2 s-1.
Broad ionised lines, possibly
originating from a highly photoionised disc, have been
observed in the high luminosity AGN, Mrk 205 and Mrk 509
(Reeves et al. 2001; Pounds et al. 2001),
although both of these objects are a factor of 5-10 lower in X-ray
luminosity than Q 0056-363.
Q0056-363 is presently the highest luminosity
radio-quiet quasar that exhibits such an intense and broad
Fe K
line profile present in a long (100 ksec) high
signal to noise XMM-Newton observation of 3C 273 is very
weak, at least down to the level of the systematic calibration
uncertainties present in the PN detector, i.e. <5% of the
continuum level at 6 keV (Reeves 2002).
A broad iron line has recently been reported in the
gravitationally micro-lensed quasar QSO 2237+0305
(Dai et al. 2003), from a Chandra ACIS observation. However
it is likely that the (uncertain) intrinsic X-ray luminosity
of this object is below 1045 erg cm-2 s-1.
Broad ionised lines, possibly
originating from a highly photoionised disc, have been
observed in the high luminosity AGN, Mrk 205 and Mrk 509
(Reeves et al. 2001; Pounds et al. 2001),
although both of these objects are a factor of 5-10 lower in X-ray
luminosity than Q 0056-363.
Q0056-363 is presently the highest luminosity
radio-quiet quasar that exhibits such an intense and broad
Fe K![]() line profile from low ionization iron.
line profile from low ionization iron.
Given the evidence for a broad iron line, where the emission is likely to
originate from the inner accretion disc, we attempt to fit the
X-ray spectrum of Q0056-363 with a disc reflection model. We use the
ionised disc reflection model ( XION) of Nayakshin et al. (2000),
in the most simple configuration where the X-rays are emitted in a "lamppost''
geometry at a height of
![]() above the accretion disc.
A ratio of X-ray to disc flux of 0.2 is assumed,
appropriate for the lamppost geometry,
as well as a high energy cut-off of 100 keV.
This model provides an excellent fit above 2 keV
(
above the accretion disc.
A ratio of X-ray to disc flux of 0.2 is assumed,
appropriate for the lamppost geometry,
as well as a high energy cut-off of 100 keV.
This model provides an excellent fit above 2 keV
(
![]() ), matching the line profile
of Q0056-363 very well.
The best-fit of this lamppost ionised reflection model is extrapolated
down to 0.3 keV and shown in Fig. 3.
Whilst the model provides an
excellent fit at high energies, the model fails to account
for the strong soft X-ray excess observed below 2 keV, as there is not sufficient continuum
curvature in the reflection model to account for the excess flux. Thus we
can rule out disc reflection as the cause of the soft excess in Q0056-363.
The derived parameters for the fit are:
), matching the line profile
of Q0056-363 very well.
The best-fit of this lamppost ionised reflection model is extrapolated
down to 0.3 keV and shown in Fig. 3.
Whilst the model provides an
excellent fit at high energies, the model fails to account
for the strong soft X-ray excess observed below 2 keV, as there is not sufficient continuum
curvature in the reflection model to account for the excess flux. Thus we
can rule out disc reflection as the cause of the soft excess in Q0056-363.
The derived parameters for the fit are:
![]() 25
25
![]() for the inner disc radius (the outer radius is fixed at
1000
for the inner disc radius (the outer radius is fixed at
1000
![]() ), and
), and ![]() 15
15![]() for the disc inclination.
We notice that the Fe abundance relative to Solar must be fixed to 5
in order to account for the high flux of the line.
Interestingly a formal upper-limit is derived for the accretion rate of about 0.05
times the Eddington accretion rate.
This low value of the accretion rate is being driven by the low value of the line energy (i.e.
6.4 keV) and the high equivalent width of the line. If one experiments
with this model by increasing the accretion rate through the disc, then the
line generally becomes more ionised (increasing to 6.7 keV),
resulting in a worse fit.
This is due to the formation of a highly ionised
layer (dominated by He-like Fe)
on the disc surface (e.g. Nayakshin & Kallman 2001) at
higher accretion rates.
for the disc inclination.
We notice that the Fe abundance relative to Solar must be fixed to 5
in order to account for the high flux of the line.
Interestingly a formal upper-limit is derived for the accretion rate of about 0.05
times the Eddington accretion rate.
This low value of the accretion rate is being driven by the low value of the line energy (i.e.
6.4 keV) and the high equivalent width of the line. If one experiments
with this model by increasing the accretion rate through the disc, then the
line generally becomes more ionised (increasing to 6.7 keV),
resulting in a worse fit.
This is due to the formation of a highly ionised
layer (dominated by He-like Fe)
on the disc surface (e.g. Nayakshin & Kallman 2001) at
higher accretion rates.
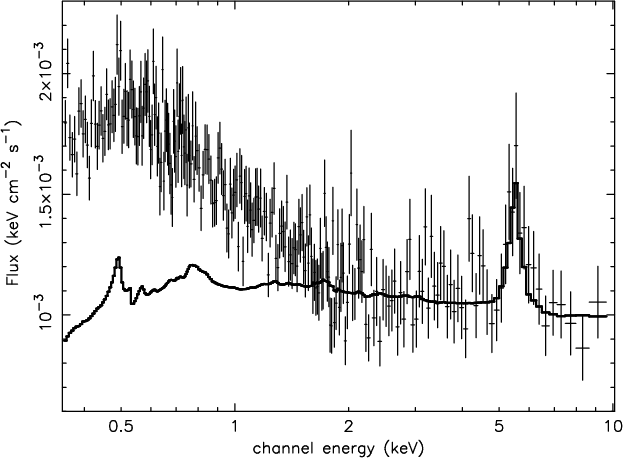 |
Figure 3:
Ionised disc reflection model fit to the PN spectrum of
Q0056-363. This model (solid line) provides an excellent representation
of the 2-12 keV spectrum and of the Fe K |
| Open with DEXTER | |
The upper limit on the accretion rate (i.e.
![]() %)
for the lamppost and the magnetic flare models is much lower than the
value (
%)
for the lamppost and the magnetic flare models is much lower than the
value (![]() 0.6-0.8) inferred according to the spectral energy distribution
of Q0056-363 (see Sect. 3).
This upper limit would be compatible with a much higher BH mass
of about
0.6-0.8) inferred according to the spectral energy distribution
of Q0056-363 (see Sect. 3).
This upper limit would be compatible with a much higher BH mass
of about
![]() .
Another possible alternative is a geometry whereby the X-ray source(s) is
no longer point-like, but exists in a corona which covers most of
the inner disc surface. In this scenario, the additional weight of the
corona will increase the gas pressure and density at the surface layers
of the disc, suppressing formation of a highly ionised layer,
the result being that the gas remains cool and a line at 6.4
keV is observed (Nayakshin & Kallman 2001). The energy
of the line in this case is largely independent of the accretion rate,
presenting a plausible explanation of the iron line profile
observed in Q0056-363.
For a corona covering most of the disk, one would
expect a large X-ray flux to UV flux ratio,
but as is found in Sect. 3,
the luminosity in the IUE domain is about two times higher
than in the XMM-Newton band. However a patchy corona,
covering a large part (but not all) of the disc surface,
could give a consistent explanation of the data.
.
Another possible alternative is a geometry whereby the X-ray source(s) is
no longer point-like, but exists in a corona which covers most of
the inner disc surface. In this scenario, the additional weight of the
corona will increase the gas pressure and density at the surface layers
of the disc, suppressing formation of a highly ionised layer,
the result being that the gas remains cool and a line at 6.4
keV is observed (Nayakshin & Kallman 2001). The energy
of the line in this case is largely independent of the accretion rate,
presenting a plausible explanation of the iron line profile
observed in Q0056-363.
For a corona covering most of the disk, one would
expect a large X-ray flux to UV flux ratio,
but as is found in Sect. 3,
the luminosity in the IUE domain is about two times higher
than in the XMM-Newton band. However a patchy corona,
covering a large part (but not all) of the disc surface,
could give a consistent explanation of the data.
A variability study of the line flux, and whether it is
correlated or not
with the continuum variability, is of great interest and would
provide a future test (in a longer observation) to discriminate
between the above models.
As discussed by Reynolds et al. (1999),
the temporal response of the line contains important information
on the accretion disk structure, the X-ray source geometry and
on the BH spin.
In the scenario of a dramatic flare in the disc corona,
the intensity of the Fe K![]() line is expected
to be constant even though the continuum flux varies
significantly for outflowing magnetic flares with
different bulk velocities (Lu & Yu 2001),
while in the disc-corona geometry it is expected that
the line responds rapidly to any change of the continuum.
line is expected
to be constant even though the continuum flux varies
significantly for outflowing magnetic flares with
different bulk velocities (Lu & Yu 2001),
while in the disc-corona geometry it is expected that
the line responds rapidly to any change of the continuum.
Table 3: Best-fitting spectral parameters in the 0.3-12 keV energy range. COMPTT: Comptonization of soft photons in a hot plasma (Titarchuk 1994), and DISKLINE: profile line emitted by a relativistic accretion disk around a non-rotating BH (Fabian et al. 1989).
Comptonization has often been suggested as a source of both the
soft X-ray and
hard X-ray spectra of AGN. For example the accretion disc may
be responsible for the EUV/soft X-ray emission, with some of these
soft photons being inversed-Compton scattered into the hard X-ray
energy range, as they pass through the hot corona above the disc.
We further investigate such models over the 0.3-12 keV range,
by using the COMPTT model in XSPEC (Titarchuk 1994).
We first test a model with one absorbed COMPTT component, using
single electron temperature, plus a DISKLINE profile;
we obtain an unsatisfactory fit with
![]() ,
as this model failed to account for all of the soft excess present
in the X-ray spectrum.
Instead we test a double Comptonization model, in this model
we assume that there are two
layers of Comptonising electrons, whereby the output from the first cooler
one is in turn Comptonized by the hotter component
(i.e.
,
as this model failed to account for all of the soft excess present
in the X-ray spectrum.
Instead we test a double Comptonization model, in this model
we assume that there are two
layers of Comptonising electrons, whereby the output from the first cooler
one is in turn Comptonized by the hotter component
(i.e.
![]() ).
We fix the input soft photons temperature (
).
We fix the input soft photons temperature (
![]() )
of the first COMPTT component to 15 eV
(see Sect. 4.1 for explanation).
Since our spectral bandpass (up to 12 keV) does not enable us to
constrain the cut-off energy for the hard power-law, the temperature of
the hotter Comptonization component (
)
of the first COMPTT component to 15 eV
(see Sect. 4.1 for explanation).
Since our spectral bandpass (up to 12 keV) does not enable us to
constrain the cut-off energy for the hard power-law, the temperature of
the hotter Comptonization component (
![]() )
has been fixed
at 100 keV.
The inferred parameters are reported in Table 3, a very good fit is
obtained, the model manages to reproduce all of the spectral curvature
seen in the XMM-Newton spectrum of Q0056-363.
The largest part of the flux, i.e. about 67%, is emitted in the 0.3-2 keV energy band.
As an illustration, Fig. 4
shows the corresponding 0.3-12 keV unfolded
PN spectrum (in
)
has been fixed
at 100 keV.
The inferred parameters are reported in Table 3, a very good fit is
obtained, the model manages to reproduce all of the spectral curvature
seen in the XMM-Newton spectrum of Q0056-363.
The largest part of the flux, i.e. about 67%, is emitted in the 0.3-2 keV energy band.
As an illustration, Fig. 4
shows the corresponding 0.3-12 keV unfolded
PN spectrum (in
![]() units).
In this model, a hot (or even non-thermal)
electron plasma is responsible for the power-law like emission
above 2 keV, whilst a lower
temperature component is responsible for the soft excess below 2 keV.
One possibility is that the cooler Comptonizing component
arises from a hot disc skin or atmosphere whilst the hotter one
originates from the corona (e.g. produced through magnetic reconnection).
Alternatively there may be only one Comptonizing layer with a
non-thermal distribution of electrons (i.e. responsible for the hard X-ray
power-law), the low energy portion of which
becomes Maxwellian (i.e. thermalised) and produces the soft excess
(e.g. see Vaughan et al. 2002 for a discussion
on the soft X-ray excess in the narrow-line Seyfert 1 Ton S180).
units).
In this model, a hot (or even non-thermal)
electron plasma is responsible for the power-law like emission
above 2 keV, whilst a lower
temperature component is responsible for the soft excess below 2 keV.
One possibility is that the cooler Comptonizing component
arises from a hot disc skin or atmosphere whilst the hotter one
originates from the corona (e.g. produced through magnetic reconnection).
Alternatively there may be only one Comptonizing layer with a
non-thermal distribution of electrons (i.e. responsible for the hard X-ray
power-law), the low energy portion of which
becomes Maxwellian (i.e. thermalised) and produces the soft excess
(e.g. see Vaughan et al. 2002 for a discussion
on the soft X-ray excess in the narrow-line Seyfert 1 Ton S180).
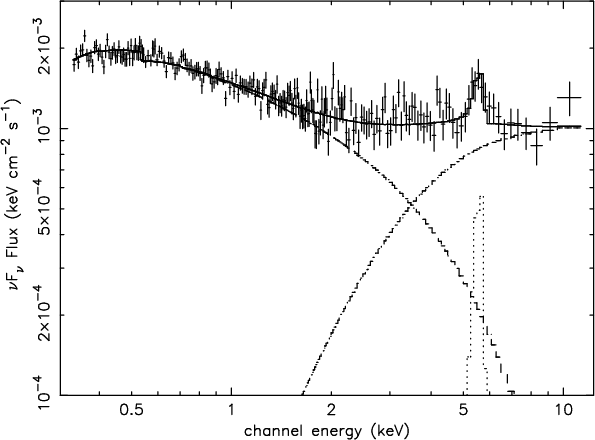 |
Figure 4:
The unfolded
|
| Open with DEXTER | |
While the broad-band X-ray continuum of Q 0056-363
can be explained by a double Comptonization model,
this model does not directly account for
the emission line at 6.4 keV or the reflected continuum from the disc.
Therefore we attempted to combine the thermal Comptonization model with
the X-ray disc reflection model XION
from Nayakshin et al. (2000),
which can account for the line at 6.4 keV.
The model XION can only be directly linked to a power-law
continuum model, therefore we fit the data with
a combination of the COMPTT model
(at soft X-ray energies) and a power-law
continuum model which mimics the hard Comptonization component,
with an X-ray disc reflection model ( XION).
As the previous fits, we fix the disc photon temperature to 15 eV,
and we assume for simplicity a lamppost geometry.
We fix the relative abundance of the iron to 5.
We find a very good representation of both the line at 6.4 keV
and the underlying continuum from 0.3 to 12 keV (
![]() ),
with
kT=0.34+0.10-0.07 keV and
),
with
kT=0.34+0.10-0.07 keV and
![]() (for the cool Comptonized layer),
(for the cool Comptonized layer),
![]() (hot Comptonized layer),
(hot Comptonized layer),
![]() %,
a disc inclination of less than 31
%,
a disc inclination of less than 31![]() ,
and an inner accretion disc radius of
,
and an inner accretion disc radius of
![]() .
We find an unabsorbed 0.3-10 keV flux
of
.
We find an unabsorbed 0.3-10 keV flux
of
![]() erg cm-2 s-1
and a corresponding 0.3-10 keV luminosity
of
erg cm-2 s-1
and a corresponding 0.3-10 keV luminosity
of
![]() erg s-1,
with about 67% is emitted below 2 keV.
The unfolded 0.3-12 keV unfolded
PN spectrum (in
erg s-1,
with about 67% is emitted below 2 keV.
The unfolded 0.3-12 keV unfolded
PN spectrum (in
![]() units) is plotted in Fig. 5.
units) is plotted in Fig. 5.
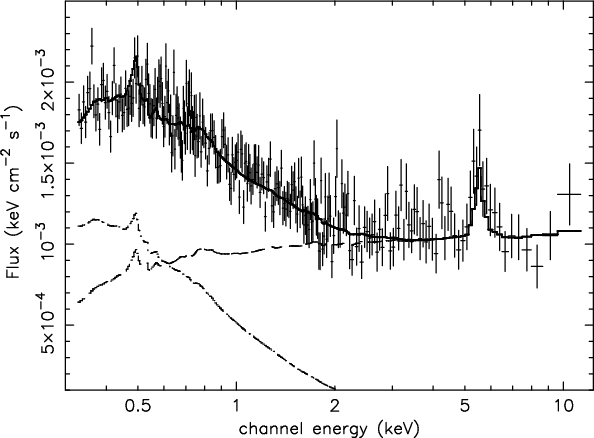 |
Figure 5:
The unfolded
|
| Open with DEXTER | |
Future high signal to noise observations by
XMM-Newton of Q0056-363 will help to discriminate between a
non rotating BH or a rotating BH and to determine the BH spin if any.
In addition to this, observations of other bright, high luminosity quasars,
will help to determine whether the Fe K![]() line in Q0056-363 is truly
unusual or not. Studying the properties of the Fe K
line in Q0056-363 is truly
unusual or not. Studying the properties of the Fe K![]() line in
a variety of AGN, spanning a wide range of physical parameters
(black hole mass and spin, accretion rate, radio-loudness)
can provide a potentially powerful diagnostic
of the accretion process and of the
geometry of the X-ray emission.
line in
a variety of AGN, spanning a wide range of physical parameters
(black hole mass and spin, accretion rate, radio-loudness)
can provide a potentially powerful diagnostic
of the accretion process and of the
geometry of the X-ray emission.
Acknowledgements
Based on observations obtained with the XMM-Newton, and ESA science mission with instruments and contributions directly funded by ESA member states and the USA (NASA). We thank the anonymous referee for very fruitful comments and suggestions. D.P. acknowledges N. Grosso for his help for the management of the multi-wavelength archived observations of Q0056-363. D.P. acknowledges grant support from MPE fellowship.