A&A 408, 287-295 (2003)
DOI: 10.1051/0004-6361:20030980
C. M. Dutra1,2 - A. V. Ahumada3 - J. J. Clariá3 - E. Bica4 - B. Barbuy1
1 - Universidade de São Paulo, Instituto de Astronomia, Geofísica e Ciências Atmosféricas,
Rua do Matão 1226, Cid. Universitária, São Paulo, 05508-900 SP, Brazil
2 -
Universidade Estadual do Rio Grande do Sul, Rua Bompland 512, São Borja
97670-000, RS, Brazil
3 -
Observatorio Astronómico de Córdoba, Laprida 854, 5000 Córdoba, Argentina
4 -
Universidade Federal do Rio Grande do Sul, Instituto de Fisica, CP 15051, Porto Alegre 91501-970, RS, Brazil
Received 10 January 2003 / Accepted 19 June 2003
Abstract
In this work we study the spectral properties (3600-6800 Å)
of the nuclear region of early-type galaxies at low (
![]() ),
intermediate (including surroundings of the Magellanic Clouds) and high
(South Polar Cap) Galactic latitudes. We
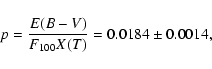
determine the E(B-V) reddening values of the galaxies by matching their continuum
distribution with respect to
those of reddening-free spectral galaxy templates with similar stellar
populations.
We also compare the spectroscopic reddening value of each galaxy
with that derived from
100
),
intermediate (including surroundings of the Magellanic Clouds) and high
(South Polar Cap) Galactic latitudes. We
determine the E(B-V) reddening values of the galaxies by matching their continuum
distribution with respect to
those of reddening-free spectral galaxy templates with similar stellar
populations.
We also compare the spectroscopic reddening value of each galaxy
with that derived from
100 ![]() m dust emission (
m dust emission (
![]() )
in its line of sight, and we
find that there is agreement up to
E(B-V)=0.25. Beyond this limit
)
in its line of sight, and we
find that there is agreement up to
E(B-V)=0.25. Beyond this limit
![]() values are higher.
Taking into account the data up to
values are higher.
Taking into account the data up to
![]() ,
we derive a
calibration factor of 0.016 between the spectroscopic E(B-V) values
and Schlegel et al.'s (1998) opacities. By combining this
result with an AK extinction map built within ten degrees of the Galactic centre
using Bulge giants as probes (Dutra et al. 2003), we extended the calibration of dust
emission reddening maps to low Galactic
latitudes down to
,
we derive a
calibration factor of 0.016 between the spectroscopic E(B-V) values
and Schlegel et al.'s (1998) opacities. By combining this
result with an AK extinction map built within ten degrees of the Galactic centre
using Bulge giants as probes (Dutra et al. 2003), we extended the calibration of dust
emission reddening maps to low Galactic
latitudes down to
![]() and
E(B-V)= 1.6 (
and
E(B-V)= 1.6 (
![]() ).
According to this new calibration, a multiplicative factor of
).
According to this new calibration, a multiplicative factor of ![]() 0.75 must be applied to the COBE/IRAS dust emission reddening maps.
0.75 must be applied to the COBE/IRAS dust emission reddening maps.
Key words: ISM: dust, extinction - Galaxy: general - galaxies: ISM
Galactic interstellar reddening is one of the observational limitations often challenging
astronomers. Accurate maps of Galactic reddening are of
crucial importance for a number of applications, such as measuring distances and mapping the
peculiar velocity field in the nearby universe. Because of the patchy dust distribution
in our Galaxy, it is very difficult to establish
a general Galactic extinction law.
However, various projects were undertaken in this direction. Sandage (1973)
and
de Vaucouleurs et al. (1976) modeled the interstellar extinction distribution as a
function of the Galactic
coordinates (![]() , b). These general extinction laws were mainly
used in extragalactic studies
and have been adopted in the Shapley-Ames (Sandage &
Tamman 1981) and Second Reference (de Vaucouleurs et al. 1976) galaxy catalogues, respectively.
, b). These general extinction laws were mainly
used in extragalactic studies
and have been adopted in the Shapley-Ames (Sandage &
Tamman 1981) and Second Reference (de Vaucouleurs et al. 1976) galaxy catalogues, respectively.
Burstein & Heiles (1978, 1982) found relationships between galaxy counts, HI column densities
and E(B-V) reddening values. Additionally, they worked out reddening maps covering a
great part of the sky, excepting the latitudes lower than
![]() .
Since the dust
grains lie in the interstellar medium associated with the HI gas (Reach et al. 1998),
Burstein & Heiles' model reproduced
the irregularities of the dust distribution more
precisely. This is one of the reasons why Burstein & Heiles maps have been widely used
in the literature. More recently, Schlegel et al. (1998, hereafter SFD98)
provided a new estimator of Galactic reddening by means of a full-sky 100
.
Since the dust
grains lie in the interstellar medium associated with the HI gas (Reach et al. 1998),
Burstein & Heiles' model reproduced
the irregularities of the dust distribution more
precisely. This is one of the reasons why Burstein & Heiles maps have been widely used
in the literature. More recently, Schlegel et al. (1998, hereafter SFD98)
provided a new estimator of Galactic reddening by means of a full-sky 100 ![]() m IRAS/ISSA map,
which was converted to dust column density by using a dust colour temperature map (17 K to 21 K)
derived from 100 and 240
m IRAS/ISSA map,
which was converted to dust column density by using a dust colour temperature map (17 K to 21 K)
derived from 100 and 240 ![]() m COBE/DIRBE dust emission maps. We will refer to these reddening maps from the IRAS/ISSA and COBE/DIRBE experiments
by COBE/IRAS dust emission reddening maps, following Chen et al. (1999). The calibration of
the relationship between the dust column density or opacity
m COBE/DIRBE dust emission maps. We will refer to these reddening maps from the IRAS/ISSA and COBE/DIRBE experiments
by COBE/IRAS dust emission reddening maps, following Chen et al. (1999). The calibration of
the relationship between the dust column density or opacity
![]() and SFD98's dust emission reddening
and SFD98's dust emission reddening
![]() was made using a sample of early-type galaxies with an uncertainty of abou 16% in their reddening values, up to
E(B-V)=0.15. The COBE/IRAS dust emission reddening maps cover the whole sky
with a
resolution of 6.1
was made using a sample of early-type galaxies with an uncertainty of abou 16% in their reddening values, up to
E(B-V)=0.15. The COBE/IRAS dust emission reddening maps cover the whole sky
with a
resolution of 6.1![]() .
They show a
good agreement with Burstein & Heiles' maps at intermediate and high Galactic
latitudes. However, SFD98 did not test their maps towards low Galactic latitudes and in the
directions of the Magellanic Clouds.
Given their characteristics, SFD98's maps supersede those of
Burstein & Heiles and different authors have tested the
.
They show a
good agreement with Burstein & Heiles' maps at intermediate and high Galactic
latitudes. However, SFD98 did not test their maps towards low Galactic latitudes and in the
directions of the Magellanic Clouds.
Given their characteristics, SFD98's maps supersede those of
Burstein & Heiles and different authors have tested the
![]() values with
independent reddening estimates derived from the stellar content of Galactic objects.
Hudson (1999) compared the reddening predictions of these maps with the
E(B-V) values estimated for 50 distant globular clusters with
values with
independent reddening estimates derived from the stellar content of Galactic objects.
Hudson (1999) compared the reddening predictions of these maps with the
E(B-V) values estimated for 50 distant globular clusters with
![]() and
distances perpendicular to the Galactic plane |Z|>3 kpc, as well as with those of 86 RR Lyrae stars from the sample of Burstein & Heiles (1978). The reddening comparisons were
carried out up to
and
distances perpendicular to the Galactic plane |Z|>3 kpc, as well as with those of 86 RR Lyrae stars from the sample of Burstein & Heiles (1978). The reddening comparisons were
carried out up to
![]() and resulted in reddening differences of
and resulted in reddening differences of
![]() and -0.016 for the two samples, respectively.
and -0.016 for the two samples, respectively.
On the other hand,
Dutra & Bica (2000) compared E(B-V) reddening values from the stellar content
of 103 old open clusters and 147 Galactic globular clusters with those derived from
![]() maps. They obtained comparable reddening values between the two procedures for star clusters at
maps. They obtained comparable reddening values between the two procedures for star clusters at
![]() ,
in agreement with the fact that
most of these clusters are located beyond the disk dust layer. However, Dutra & Bica (2000)
found significant differences for clusters at low Galactic latitudes located or projected in the disk
dust layer. For low Galactic latitude star clusters, the differences are due to the
background dust contribution, since the heated dust in the plane and towards the Galactic
centre contributes only to the
,
in agreement with the fact that
most of these clusters are located beyond the disk dust layer. However, Dutra & Bica (2000)
found significant differences for clusters at low Galactic latitudes located or projected in the disk
dust layer. For low Galactic latitude star clusters, the differences are due to the
background dust contribution, since the heated dust in the plane and towards the Galactic
centre contributes only to the
![]() values. Considering 131 globular clusters
with
values. Considering 131 globular clusters
with
![]() and |Z|> 100 pc (assumed dust scale height), Chen et al. (1999)
concluded that SFD98's reddening maps overestimated the visual absorption by a mean
factor of 1.16. Arce & Goodman (1999) analyzed
the interstellar reddening in the Taurus
dark cloud complex (
and |Z|> 100 pc (assumed dust scale height), Chen et al. (1999)
concluded that SFD98's reddening maps overestimated the visual absorption by a mean
factor of 1.16. Arce & Goodman (1999) analyzed
the interstellar reddening in the Taurus
dark cloud complex (
![]() )
by comparing
)
by comparing
![]() reddening values with those derived from four other methods and concluded that SFD98's
reddening values overestimated the extinction by a factor of 1.3-1.5 in regions of smooth
extinction with
AV> 0.5. Dutra et al. (2002) built AK extinction maps
using 2MASS data for
two low extinction regions (windows) in the inner Bulge. The
comparison of extinction values within a radius of one degree of window W359.4-3.1 (at
reddening values with those derived from four other methods and concluded that SFD98's
reddening values overestimated the extinction by a factor of 1.3-1.5 in regions of smooth
extinction with
AV> 0.5. Dutra et al. (2002) built AK extinction maps
using 2MASS data for
two low extinction regions (windows) in the inner Bulge. The
comparison of extinction values within a radius of one degree of window W359.4-3.1 (at
![]() ,
and mean
E(B-V)= 0.8) indicated that
the dust emission extinction values are
overestimated by a factor of 1.45 with respect to those derived from 2MASS photometry. Also using 2MASS data,
Dutra et al. (2003) built an AK extinction map within ten degrees of
the Galactic centre,
finding that for
,
and mean
E(B-V)= 0.8) indicated that
the dust emission extinction values are
overestimated by a factor of 1.45 with respect to those derived from 2MASS photometry. Also using 2MASS data,
Dutra et al. (2003) built an AK extinction map within ten degrees of
the Galactic centre,
finding that for
![]() ,
the discrepancy between reddening values
derived from the dust emission and 2MASS photometry can be explained by a calibration factor of 1.31.
,
the discrepancy between reddening values
derived from the dust emission and 2MASS photometry can be explained by a calibration factor of 1.31.
Dutra et al. (2001, hereafter Paper I) obtained spectra from the nuclear region of galaxies behind and around the Magellanic Clouds in order to estimate the reddening in their lines of sight. They derived the reddening in each line-of-sight by matching the continuum distribution of the galaxy's spectrum with that of a reddening-free template with similar stellar population. For galaxies in the surroundings of the Magellanic Clouds, they concluded that the spectroscopic and dust emission reddening values agree well. They also detected the effect of the internal reddening of the Magellanic Clouds for galaxies behind them.
From the studies mentioned above, we can infer that the dust emission reddening
maps - with their present reddening-dust emission calibration - need an additional
calibration factor to reproduce reddening values higher than
E(B-V)= 0.3.
In the current work, we use
the spectroscopic method described in Paper I to derive independent foreground reddening estimates for
early-type galaxies in lines of sight at low Galactic latitudes (
![]() ), in order to compare
these reddening values with those derived from dust emission. By
using the present sample
of galaxies, which provides reddening estimates for a wide sky coverage and by
combining them to results cited above, we aim to extend the calibration
of the dust emission
reddening maps to regions with
), in order to compare
these reddening values with those derived from dust emission. By
using the present sample
of galaxies, which provides reddening estimates for a wide sky coverage and by
combining them to results cited above, we aim to extend the calibration
of the dust emission
reddening maps to regions with
![]() and more heavily reddened.
and more heavily reddened.
In Sect. 2 we present the sample of the observed early-type galaxies at low Galactic
latitudes.
In Sect. 3 we describe the observations and reductions, whereas in Sect. 4
we compare the present galaxy spectra with those of red stellar
population templates obtained
in Paper I to derive the reddening values. We also discuss
some discrepancies appearing between the spectroscopic reddening values and those
derived from the 100 ![]() m dust emission
reddening maps. In Sect. 5 we provide a new reddening calibration for the COBE/IRAS dust emission reddening maps
using the galaxy sample and extend it using literature data. In
Sect. 6 we test the new calibration using the intrinsic (B-V)0 colour
m dust emission
reddening maps. In Sect. 5 we provide a new reddening calibration for the COBE/IRAS dust emission reddening maps
using the galaxy sample and extend it using literature data. In
Sect. 6 we test the new calibration using the intrinsic (B-V)0 colour
![]() index relation for 311 galaxies.
Concluding remarks are given in Sect. 7.
index relation for 311 galaxies.
Concluding remarks are given in Sect. 7.
![\begin{figure}
\par\resizebox{7cm}{!}{\includegraphics[clip]{h4234f1.eps}}
\end{figure}](/articles/aa/full/2003/34/aah4234/img30.gif) |
Figure 1: Angular distribution of the observed sample of low Galactic latitude galaxies. |
| Open with DEXTER | |
We used the LEDA database (http://leda.univ-lyon1.fr) as a starting point to
select early-type galaxies with Galactic latitude
![]() and total blue
magnitude
and total blue
magnitude
![]() .
Figure 1 shows the angular distribution of the observed galaxies.
The present
sample and its properties are given in Table 1, which includes the following columns:
(1) designation, (2) and (3) J2000 equatorial coordinates, (4) and (5) Galactic coordinates, (6) total blue magnitude
.
Figure 1 shows the angular distribution of the observed galaxies.
The present
sample and its properties are given in Table 1, which includes the following columns:
(1) designation, (2) and (3) J2000 equatorial coordinates, (4) and (5) Galactic coordinates, (6) total blue magnitude ![]() ,
(7) exposure time, (8) radial velocity
measurement, (9) LEDA and/or NED radial velocity, and (10) LEDA/NED morphological type.
,
(7) exposure time, (8) radial velocity
measurement, (9) LEDA and/or NED radial velocity, and (10) LEDA/NED morphological type.
Table 1: The sample of observed galaxies.
Table 2: Instrument and spectra general characteristics.
The spectra were collected with the 1.52-m telescope at the European Southern Observatory (ESO, La Silla, Chile) on 11-14 January 2002 and 6-7 December 2002, and the 2.15-m telescope at the Complejo Astronómico El Leoncito (CASLEO, San Juan, Argentina) on 10-12 May 2002. In both telescopes we employed a CCD camera attached to a Boller & Chivens spectrograph. At least two exposures of each object were taken in order to correct for cosmic rays. The exposure times are given in Table 1, while Table 2 summarizes the instrumental and general characteristics of the spectra obtained in the two Observatories. The standard stars EG21, LTT2415, and LTT3864 (Baldwin & Stone 1984) were observed for flux calibrations. He-Ar lamp exposures were taken following that of the object or standard star for wavelength calibrations. The slit was set in the E-W direction and its length projected on the chip (Table 2) provided a wide range of pixel rows for background subtractions.
The reductions were carried out using the IRAF package following standard procedures.
The
spectra were bias corrected, flat-fielded and extracted along the slit
according to the
dimensions of each galaxy's nuclear region. Typical
extractions were ![]() 8-10
8-10
![]() .
Afterwards, they were calibrated in wavelength and
flux units using a He-Ar lamp and standard star spectra, respectively. Corrections for
atmospheric extinction were applied, adopting the standard
mean extinction curves from ESO/La Silla and CASLEO (Minniti et al. 1989).
.
Afterwards, they were calibrated in wavelength and
flux units using a He-Ar lamp and standard star spectra, respectively. Corrections for
atmospheric extinction were applied, adopting the standard
mean extinction curves from ESO/La Silla and CASLEO (Minniti et al. 1989).
Since the spectral resolution was chosen for stellar population purposes, it is not
ideal for radial velocity measurements. We measured in any case the radial velocities using the
absorption bands/lines centred at the
G band (4301 Å), H![]() (4861 Å), Mg I (5175 Å) and Na I (5890 Å).
The measured velocities and those from the LEDA and NED extragalactic databases
are consistent (Table 1). In one case, ESO 221-26,
the LEDA velocity (Table 1) appears to be significantly different from that of
present observation. The measured
velocities were used to bring the galaxy spectra to the rest frame, which is
necessary for
the subsequent stellar population analysis.
(4861 Å), Mg I (5175 Å) and Na I (5890 Å).
The measured velocities and those from the LEDA and NED extragalactic databases
are consistent (Table 1). In one case, ESO 221-26,
the LEDA velocity (Table 1) appears to be significantly different from that of
present observation. The measured
velocities were used to bring the galaxy spectra to the rest frame, which is
necessary for
the subsequent stellar population analysis.
Figures 2-4 show the resulting rest-frame flux calibrated spectra for the observed galaxies at CASLEO 2.15-m and ESO 1.52-m telescopes. Note that although the spectra taken with the ESO 1.52-m telescope yield a larger spectral coverage (Table 2), we adopted the range (3600-6800 Å) for all the spectra.
![\begin{figure}
\par\resizebox{8.8cm}{!}{\includegraphics[clip]{h4234f2.eps}}
\end{figure}](/articles/aa/full/2003/34/aah4234/img40.gif) |
Figure 2:
Rest-frame spectra of galaxies observed at CASLEO. Spectra are in relative
|
| Open with DEXTER | |
![\begin{figure}
\par\resizebox{8.8cm}{!}{\includegraphics[clip]{h4234f3.eps}}
\end{figure}](/articles/aa/full/2003/34/aah4234/img41.gif) |
Figure 3: Rest-frame spectra of additional galaxies observed at CASLEO. Units are as in Fig. 2. |
| Open with DEXTER | |
![\begin{figure}
\resizebox{8.8cm}{!}{\includegraphics[clip]{h4234f4.eps}}
\end{figure}](/articles/aa/full/2003/34/aah4234/img42.gif) |
Figure 4: Rest-frame spectra of galaxies observed at ESO (La Silla). Units are as in Fig. 2. |
| Open with DEXTER | |
Table 3: Equivalent widths for strong absorption features in the templates and individual galaxy spectra.
All the observed spectra (Figs. 2-4) correspond to the nuclear region of early-type galaxies and, therefore, they are characterized by a red stellar population. Bica (1988) studied the stellar populations of the nuclear regions of early and late-type galaxies by means of their integrated spectra. Red stellar population galaxy nuclei spectra are ideal as Galactic reddening probes since the spectral distribution is essentially insensitive to age variations of the components and presents a small dependence on metallicity. He grouped the spectra in order to form high signal-to-noise red and blue stellar population templates, which are corrected for reddening following Sandage's law (1973). These templates represent the most frequent types of stellar populations found in normal galaxy nuclei.
In Paper I we defined
new red stellar population templates, T1 and T23, based on those of Bica (1988) and
new observations of early-type galaxies in the South Polar Cap. These templates are
reddening-corrected and formed by galaxies with dust emission reddening
![]() .
We adopted the T1 and T23 templates in the present study to perform the match
between the continuum distribution of these spectra and those from
the observed
galaxies for the purpose of estimating the reddening in their lines of sight.
.
We adopted the T1 and T23 templates in the present study to perform the match
between the continuum distribution of these spectra and those from
the observed
galaxies for the purpose of estimating the reddening in their lines of sight.
Internal reddening in early type galaxies might be a source of uncertainty in the present method.
Van Dokkum & Franx (1995) found high opacities in cores of ellipticals in a scale of 1-2
![]() using HST. Ferrari et al. (1999) showed the presence of internal dust in 75% of 22 observed elliptical galaxies. By integrating in larger areas (10-20
using HST. Ferrari et al. (1999) showed the presence of internal dust in 75% of 22 observed elliptical galaxies. By integrating in larger areas (10-20
![]() )
they derived a typical reddening value of
E(B-V)=0.01, thus within uncertainties of the present determinations (typically
)
they derived a typical reddening value of
E(B-V)=0.01, thus within uncertainties of the present determinations (typically
![]() ,
Paper I). Therefore the internal reddening variations in ellipticals are not expected to affect the present results significantly, since our apertures are relatively large (Sect. 3).
,
Paper I). Therefore the internal reddening variations in ellipticals are not expected to affect the present results significantly, since our apertures are relatively large (Sect. 3).
For the spectral comparisons, we need to determine which template has a stellar
population
which most closely resembles that of the observed galaxy. This estimation is
made by comparing the equivalent widths (Ws)
of both spectra. Then, we employ
Ws of strong absorption features from the sample galaxies and templates' spectra.
We use the following metal
features: K CaII (3933 Å), CN (4182 Å), G band
(4301 Å), MgI (5175 Å) and NaI (5890 Å), together with four
Balmer lines:
H![]() (4101 Å), H
(4101 Å), H![]() (4340 Å), H
(4340 Å), H![]() (4861 Å) and H
(4861 Å) and H![]() (6563 Å). Table 3 shows W values for templates and
individual galaxies measured with
continuum tracings and feature
windows following Bica & Alloin (1986) and Bica et al. (1994).
Typical W errors
are
(6563 Å). Table 3 shows W values for templates and
individual galaxies measured with
continuum tracings and feature
windows following Bica & Alloin (1986) and Bica et al. (1994).
Typical W errors
are ![]() 5% and depend mostly on uncertainties in the
continuum positioning.
5% and depend mostly on uncertainties in the
continuum positioning.
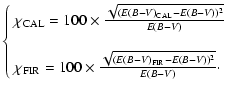
For each galaxy the spectroscopic reddening value
![]() was obtained by fitting
the observed galaxy spectrum to that of the corresponding template with
similar Ws,
by applying continuum corrections according to the Seaton's (1979) Galactic extinction law.
was obtained by fitting
the observed galaxy spectrum to that of the corresponding template with
similar Ws,
by applying continuum corrections according to the Seaton's (1979) Galactic extinction law.
Figure 5 illustrates the reddening determination for NGC 4976 (upper panel) and NGC 2663 (lower panel), of stellar populations similar to those of the templates T23 and T1, respectively. The reddening effect in the observed spectra are important. Table 4 provides the associated template, as well as the spectroscopic and dust emission reddening value for each galaxy.
Figure 6 shows the comparison between these two reddening estimates using the present data
and those from Paper I for
34 early-type galaxies at intermediate latitudes, surroundings of the Magellanic
Clouds and South Polar Cap. A qualitative analysis shows that the two reddening estimates are
consistent up to
E(B-V)< 0.25, but beyond this limit
the two available points indicate higher
![]() values. Figure 6 suggests a discrepancy between
spectroscopic and higher dust emission reddening values, which has also been detected
in other reddening comparisons
in the literature, as mentioned in Sect. 1. The spectroscopic reddening
determination method is a promising technique to understand this discrepancy
at high reddening values regime with a homogeneous way of expanding the sample
to fainter galaxies and extending the analysis towards the infrared domain.
values. Figure 6 suggests a discrepancy between
spectroscopic and higher dust emission reddening values, which has also been detected
in other reddening comparisons
in the literature, as mentioned in Sect. 1. The spectroscopic reddening
determination method is a promising technique to understand this discrepancy
at high reddening values regime with a homogeneous way of expanding the sample
to fainter galaxies and extending the analysis towards the infrared domain.
![\begin{figure}
\par\resizebox{7cm}{!}{\includegraphics[clip]{h4234f5.eps}}
\end{figure}](/articles/aa/full/2003/34/aah4234/img48.gif) |
Figure 5: Upper panel: reddening determination for NGC 4976. Lower panel: reddening determination for NGC 2663. |
| Open with DEXTER | |
Table 4: Spectroscopic and dust emission reddening values for observed galaxies from Bica (1988) and South Polar Cap samples.
![\begin{figure}
\par\resizebox{8.8cm}{!}{\includegraphics[clip]{h4234f6.eps}}
\end{figure}](/articles/aa/full/2003/34/aah4234/img49.gif) |
Figure 6:
Comparison between E(B-V) reddening values derived from galaxy spectra and those from 100 |
| Open with DEXTER | |
The transformation of opacity
![]() to
a reddening
to
a reddening
![]() map carried out by SFD98 uses the correlation between the intrinsic (B-V)0 colour of elliptical galaxies and their Mg2 index.
The Mg2 index described by Faber et al. (1989) has a tight correlation with (B-V)0,
which in turn can be used to obtain accurate reddening values.
SFD98 used 389 elliptical galaxies from Faber et al. (1989) to compute a linear regression of
reddening-corrected (B-V)0 values against Mg2 with residuals
map carried out by SFD98 uses the correlation between the intrinsic (B-V)0 colour of elliptical galaxies and their Mg2 index.
The Mg2 index described by Faber et al. (1989) has a tight correlation with (B-V)0,
which in turn can be used to obtain accurate reddening values.
SFD98 used 389 elliptical galaxies from Faber et al. (1989) to compute a linear regression of
reddening-corrected (B-V)0 values against Mg2 with residuals
![]() .
They computed the Spearman rank correlation coefficient of
.
They computed the Spearman rank correlation coefficient of
![]() versus the
versus the
![]() values, arguing that a
good dust map will have no residual correlation. SFD98 obtained the
following calibration factor:
values, arguing that a
good dust map will have no residual correlation. SFD98 obtained the
following calibration factor:
 |
(1) |
![\begin{figure}
\par\resizebox{7cm}{!}{\includegraphics[clip]{h4234f7.eps}}
\end{figure}](/articles/aa/full/2003/34/aah4234/img52.gif) |
Figure 7:
Comparison of reddening determinations: i) upper panel,
spectroscopic
|
| Open with DEXTER | |
Arce & Goodman (1999) found that SFD98's reddening maps overestimated
the reddening in the Taurus dark cloud complex by a factor of 1.3-1.5
in regions of high extinction (AV>0.5). They attributed this discrepancy
to the fact that in
the sample of 389 elliptical galaxies used to calculate a conversion from
dust column density to E(B-V), 90% of the galaxies have low-reddening
(
![]() )
and very few have high-reddening
(
)
and very few have high-reddening
(
![]() )
values. The lack of galaxies in
high-reddening regions results in an inaccuracy in the conversion between
dust column and reddening for lines of sight with
)
values. The lack of galaxies in
high-reddening regions results in an inaccuracy in the conversion between
dust column and reddening for lines of sight with
![]() .
.
We use the present reddening estimates
derived with the spectroscopic method to perform a new calibration of SFD98's
opacities derived from 100 ![]() m emission and temperature correction maps.
Figure 7's upper panel shows the comparison between spectroscopic reddening estimates and
the corresponding SFD98's opacities. A linear
regression to the data yields the following equation:
m emission and temperature correction maps.
Figure 7's upper panel shows the comparison between spectroscopic reddening estimates and
the corresponding SFD98's opacities. A linear
regression to the data yields the following equation:
| E(B-V) = 0.016 F100 X(T) + 0.0008 | (2) |
| (3) |
![\begin{figure}
\par\resizebox{8.8cm}{!}{\includegraphics[clip]{h4234f8.eps}}
\end{figure}](/articles/aa/full/2003/34/aah4234/img56.gif) |
Figure 8: Independent reddening values E(B-V) versus SFD98's opacities F100 X(T) for galaxy sample (open squares) and 3026 Bulge direction (filled circles). |
| Open with DEXTER | |
In order to extend further the opacity-reddening calibration to higher E(B-V) values, the K-band extinction AK map built by Dutra et al. (2003) within ten degrees of the Galactic center was used, together with the present reddening estimates.
Dutra et al. (2003) determined the AK extinction from
![]() infrared 2MASS photometry of Bulge red giants,
fitting the upper giant branch of (
infrared 2MASS photometry of Bulge red giants,
fitting the upper giant branch of (![]() ,
,
![]() )
colour-magnitude diagrams to a dereddened upper giant branch mean locus. These Bulge/Disk directions were divided into cells and about 6 million stars were used as reddening probes.
Adopting
RV = AV / E(B - V) = 3.1 and
AK/AV=0.112 (Cardelli et al. 1989), we transformed AK estimates to E(B-V) ones for 3026 cells with
)
colour-magnitude diagrams to a dereddened upper giant branch mean locus. These Bulge/Disk directions were divided into cells and about 6 million stars were used as reddening probes.
Adopting
RV = AV / E(B - V) = 3.1 and
AK/AV=0.112 (Cardelli et al. 1989), we transformed AK estimates to E(B-V) ones for 3026 cells with ![]() arcmin2 in size,
located at Galactic coordinates
arcmin2 in size,
located at Galactic coordinates
![]() and
and
![]() ,
in a region where the dust background contribution to the 100
,
in a region where the dust background contribution to the 100 ![]() m flux (less than 5%) is minimized
and
m flux (less than 5%) is minimized
and
![]() ,
where
,
where
![]() is the uncertainty in the AK determination. The latter constraint is to warrant accuracy for the AK estimates.
Figure 8 shows for the galaxy sample and 3026 Bulge directions
the comparison between independent reddening estimates and the SFD98's opacities.
A linear regression fit within the polygon region (Fig. 8) yields the following new
calibration:
is the uncertainty in the AK determination. The latter constraint is to warrant accuracy for the AK estimates.
Figure 8 shows for the galaxy sample and 3026 Bulge directions
the comparison between independent reddening estimates and the SFD98's opacities.
A linear regression fit within the polygon region (Fig. 8) yields the following new
calibration:
| (4) |
Figure 9's panels (a) and (b) show for the galaxy sample and 3026 Bulge directions the comparisons between independent reddening estimates and
those derived from SFD98
![]() and
and
![]() ,
respectively. In panel (a),
the
,
respectively. In panel (a),
the
![]() values appear to be systematically larger than the E(B-V) ones, while
panel (b) shows a good agreement between
values appear to be systematically larger than the E(B-V) ones, while
panel (b) shows a good agreement between
![]() and E(B-V), except for the points having
and E(B-V), except for the points having
![]() and
1.4<E(B-V)<2.7.
The latter points correspond to those with
and
1.4<E(B-V)<2.7.
The latter points correspond to those with
![]() and
the same E(B-V) range. In addition, Eq. (4) is not precise for higher reddening values of
E(B-V)>1.6, where the
slope of the
and
the same E(B-V) range. In addition, Eq. (4) is not precise for higher reddening values of
E(B-V)>1.6, where the
slope of the
![]() correlation has an abrupt variation (Fig. 8). In Fig. 9's panel (c)
we present histograms of the relative differences
correlation has an abrupt variation (Fig. 8). In Fig. 9's panel (c)
we present histograms of the relative differences
![]() and
and
![]() ,
between
,
between
![]() and independent E(B-V) measurements
and
and independent E(B-V) measurements
and
![]() and E(B-V) values, respectively. The relative differences
and E(B-V) values, respectively. The relative differences
![]() and
and
![]() are defined as:
are defined as:
 |
(5) |
| (6) |
![\begin{figure}
\par\resizebox{8.8cm}{!}{\includegraphics[clip]{h4234f9.eps}}
\end{figure}](/articles/aa/full/2003/34/aah4234/img72.gif) |
Figure 9:
Panels: a)
|
| Open with DEXTER | |
Hudson (1999) examined the large-scale systematic errors, which vary as a function of position on the sky, in Burstein & Heiles and SFD98
reddening maps. He determined for 311 early-type galaxies a relation Mg2 index and intrinsic (B-V)0 colour.
We used the data by Hudson (1999) available at CDS to study the
correlation between the Mg2 index and (B-V)0 colour; for such,
we dereddened the observed (B-V) colour using
SFD98's reddening estimates and those from the present calibration. Figure 10 shows in panels (a) and (c) the
![]() relation, once the observed (B-V) colours were
corrected for reddening using SFD98's
relation, once the observed (B-V) colours were
corrected for reddening using SFD98's
![]() and the present calibration
and the present calibration
![]() ,
respectively. Panels (b) and (d) show
the residuals from a linear fit to the
,
respectively. Panels (b) and (d) show
the residuals from a linear fit to the
![]() as a function of the respective reddening estimates.
Comparing the residual plots, we note that for the same sample,
as a function of the respective reddening estimates.
Comparing the residual plots, we note that for the same sample,
![]() values are higher
than
values are higher
than
![]() ones. The residual plot from the linear fit in (c) as a function of
ones. The residual plot from the linear fit in (c) as a function of
![]() shows a more symmetric distribution than
that for
shows a more symmetric distribution than
that for
![]() values, indicating that the former is less biased than the latter, mainly for higher reddening values. Blakeslee et al. (2001)
performed the same test for 200 galaxies using a relation between the intrinsic (V-I)0 colour and the Mg2 index.
They concluded that SFD98 reddening values overestimate
by 5-10% the interstellar reddening in the line-of-sight of the galaxies with
E(B-V)>0.2. This test is consistent with the present calibration.
values, indicating that the former is less biased than the latter, mainly for higher reddening values. Blakeslee et al. (2001)
performed the same test for 200 galaxies using a relation between the intrinsic (V-I)0 colour and the Mg2 index.
They concluded that SFD98 reddening values overestimate
by 5-10% the interstellar reddening in the line-of-sight of the galaxies with
E(B-V)>0.2. This test is consistent with the present calibration.
![\begin{figure}
\par\resizebox{8.8cm}{!}{\includegraphics[clip]{h4234f10.eps}}
\end{figure}](/articles/aa/full/2003/34/aah4234/img76.gif) |
Figure 10:
Panels: a) (B-V)0 versus Mg2 with (B-V)0 corrected by
|
| Open with DEXTER | |
We obtained spectra in the range (3600-6800 Å) for the nuclear region
of 20 early-type galaxies at low Galactic latitudes (
![]() )
and total blue magnitude
)
and total blue magnitude
![]() using the Boller & Chivens spectrograph
at the CASLEO 2.15-m and ESO 1.52-m telescopes. Two of these galaxies
have their radial velocities estimated for the first time.
using the Boller & Chivens spectrograph
at the CASLEO 2.15-m and ESO 1.52-m telescopes. Two of these galaxies
have their radial velocities estimated for the first time.
We derived spectroscopically the line-of-sight reddening of these galaxies. The reddening in each line-of-sight was determined from the comparison of continuum distribution of the galaxy's spectrum with that of a reddening-free template with comparable stellar population according to the equivalent widths of its absorption features.
We compared the spectroscopic reddening estimates with those derived
from the 100 ![]() m dust emission (
m dust emission (
![]() )
obtained by Schlegel et al. (1998) for the
lines-of-sight of 54 galaxies, 20 of them from the present work and the remaining 34 from Paper I.
The comparison reached reddening values up to
E(B-V) = 0.65 and indicates that
for
E(B-V)>0.25 the dust emission reddening estimates are higher
than the spectroscopic reddening values, in agreement with other reddening comparisons
carried out using different objects. The spectroscopic method proves to be useful
for reddening determinations in the line-of-sight of low Galactic latitude galaxies
and, therefore, it can be applied using larger telescopes to derive
the interstellar reddening in the directions of fainter galaxies
or of recently
catalogued 2MASS galaxies using the infrared domain. The present and future
reddening estimates using this method should constitute important observational constraints
to new Galactic extinction models.
)
obtained by Schlegel et al. (1998) for the
lines-of-sight of 54 galaxies, 20 of them from the present work and the remaining 34 from Paper I.
The comparison reached reddening values up to
E(B-V) = 0.65 and indicates that
for
E(B-V)>0.25 the dust emission reddening estimates are higher
than the spectroscopic reddening values, in agreement with other reddening comparisons
carried out using different objects. The spectroscopic method proves to be useful
for reddening determinations in the line-of-sight of low Galactic latitude galaxies
and, therefore, it can be applied using larger telescopes to derive
the interstellar reddening in the directions of fainter galaxies
or of recently
catalogued 2MASS galaxies using the infrared domain. The present and future
reddening estimates using this method should constitute important observational constraints
to new Galactic extinction models.
We used the present spectroscopic reddening estimates
(up to
![]() )
and the SFD98's opacities
(derived from 100
)
and the SFD98's opacities
(derived from 100 ![]() m emission and temperature correction maps)
to recalibrate their dust emission reddening maps. We obtained a calibration factor
of 0.016 between the spectroscopic E(B-V) values and SFD98's opacities, which is a factor 0.88 lower than that obtained by SFD98.
Using the AK extinction map recently built by
Dutra et al. (2003) within ten degrees of the Galactic centre, we
extended the calibration of dust emission reddening maps to low Galactic
latitudes down to
m emission and temperature correction maps)
to recalibrate their dust emission reddening maps. We obtained a calibration factor
of 0.016 between the spectroscopic E(B-V) values and SFD98's opacities, which is a factor 0.88 lower than that obtained by SFD98.
Using the AK extinction map recently built by
Dutra et al. (2003) within ten degrees of the Galactic centre, we
extended the calibration of dust emission reddening maps to low Galactic
latitudes down to
![]() and reddening values of
E(B-V)= 1.6 (
and reddening values of
E(B-V)= 1.6 (
![]() ). According to the new
calibration, a multiplicative factor of
). According to the new
calibration, a multiplicative factor of ![]() 0.75 must be
applied to the COBE/IRAS dust emission reddening maps in those regions.
0.75 must be
applied to the COBE/IRAS dust emission reddening maps in those regions.
Acknowledgements
We thank the CASLEO staff for hospitality and support during the observing run. The authors acknowledge use of the CCD and data acquisition system supported under U.S. National Science Foundation grant AST-90-15827 to R. M. Rich. We have made use of the LEDA database, and the NASA/IPAC Extragalactic Database (NED), which is operated by the Jet Propulsion Laboratory, California Institute of Technology, under contract with the National Aeronautics and Space Administration. We employed an electronic table from CDS/Simbad (Strasbourg) and Digitized Sky Survey images from the Space Telescope Science Institute (U.S. Government grant NAG W-2166) obtained using the extraction tool from CADC (Canada). This work was partially supported by the Brazilian institutions FAPESP, CNPq and FINEP, the Argentine institutions CONICET, Agencia Córdoba Ciencia, ANPCyT and SECYT (UNC), and the VITAE and Antorchas foundations. CMD acknowledges FAPESP for a post-doc fellowship (proc. 2000/11864-6). We acknowledge FAPESP grant 1998/10138-8.