A&A 408, 127-134 (2003)
DOI: 10.1051/0004-6361:20030944
C. M. Dutra1,2 - S. Ortolani3 - E. Bica4 - B. Barbuy1 - M. Zoccali5 - Y. Momany3
1 - Universidade de São Paulo, Instituto de Astronomia,
Geofísica e Ciências atmosféricas, CP 3386, São Paulo
01060-970, SP, Brazil
2 -
Universidade Estadual do Rio Grande do Sul, Rua Bompland 512, São Borja
97670-000, RS, Brazil
3 -
Università di Padova, Dept. di Astronomia, Vicolo dell'Osservatorio
2, 35122 Padova, Italy
4 -
Universidade Federal do Rio Grande do Sul, Instituto de Física,
CP 15051, Porto Alegre 91501-970, RS, Brazil
5 -
European Southern Observatory, Karl-Schwarzschild-Strasse 2, 85748
Garching bei München, Germany
Received 20 December 2002 / Accepted 25 April 2003
Abstract
We address the issue whether the central parts of the Galaxy harbour
young clusters other than Arches, Quintuplet and the Nuclear Young
Cluster. A large sample of centrally projected cluster candidates has
been recently identified from the 2MASS J, H and ![]() Atlas. We provide a
catalogue of higher angular resolution and deeper images for 57 2MASS cluster candidates,
obtained with the near-IR camera SOFI at the
ESO NTT telescope. We classify 10 objects as star clusters, some of
them deeply embedded in gas and/or dust clouds. Three other objects
are probably star clusters, although the presence of dust in the field
does not exclude the possibility of their being field stars seen through low-absorption
regions. Eleven objects are concentrations of stars in areas of little
or no gas, and are classified as dissolving cluster
candidates. Finally, 31 objects turned out to be the blend of a few
bright stars, not resolved as such in the low resolution 2MASS images.
By combining the above results with other known objects we provide an
updated sample of 42 embedded clusters and candidates projected within
7
Atlas. We provide a
catalogue of higher angular resolution and deeper images for 57 2MASS cluster candidates,
obtained with the near-IR camera SOFI at the
ESO NTT telescope. We classify 10 objects as star clusters, some of
them deeply embedded in gas and/or dust clouds. Three other objects
are probably star clusters, although the presence of dust in the field
does not exclude the possibility of their being field stars seen through low-absorption
regions. Eleven objects are concentrations of stars in areas of little
or no gas, and are classified as dissolving cluster
candidates. Finally, 31 objects turned out to be the blend of a few
bright stars, not resolved as such in the low resolution 2MASS images.
By combining the above results with other known objects we provide an
updated sample of 42 embedded clusters and candidates projected within
7![]() .
As a
first step we study Object 11 of Dutra & Bica (2000) projected at
.
As a
first step we study Object 11 of Dutra & Bica (2000) projected at
![]() 1
1![]() from the nucleus. We present H and
from the nucleus. We present H and ![]() photometry and study the colour-magnitude diagram and luminosity
function. Object 11 appears to be a less massive cluster than Arches
or Quintuplet, and it is located at a distance from the Sun
photometry and study the colour-magnitude diagram and luminosity
function. Object 11 appears to be a less massive cluster than Arches
or Quintuplet, and it is located at a distance from the Sun
![]() 8 kpc, with a visual absorption
8 kpc, with a visual absorption
![]() .
.
Key words: Galaxy: open clusters and associations - ISM: dust, extinction
The 2MASS Atlas (Skrutskie et al. 1997-http://pegasus.phast.umass.edu/2mass.html) has made
it possible to study the infrared population of star clusters and
candidates towards the central part of the Galaxy (e.g. Dutra & Bica
2000, 2001). By central part of the Galaxy we mean within
7![]() of the nucleus (1 kpc at the Galactic center distance).
Recently, Portegies Zwart et al. (2001) modeled cluster formation and
tidal survival in a more central region within 1.43
of the nucleus (1 kpc at the Galactic center distance).
Recently, Portegies Zwart et al. (2001) modeled cluster formation and
tidal survival in a more central region within 1.43![]() (200 pc).
(200 pc).
The central part of the Galaxy is known to harbour the massive star
clusters Arches, Quintuplet and the Nuclear Young cluster (e.g. Figer
et al. 1999a; Gerhard 2001 and references therein). Several more may
exist according to simulations by Portegies Zwart et al. (2001).
They estimated 50 massive clusters within 200 pc, which would survive
to a tidal dissolution time of ![]() 70 Myr. A fundamental
question is whether clusters predicted by Portegies Zwart et al.
(2001) can be detected. Can young clusters such as Arches and
Quintuplet be detected not only within 200 pc but also up to 1 kpc?
Are most central clusters too much absorbed to be seen at 2
70 Myr. A fundamental
question is whether clusters predicted by Portegies Zwart et al.
(2001) can be detected. Can young clusters such as Arches and
Quintuplet be detected not only within 200 pc but also up to 1 kpc?
Are most central clusters too much absorbed to be seen at 2 ![]() m?
The samples of Dutra & Bica (2000, 2001) provided candidates within
both zones, which at the 2MASS angular resolution resembled the images
of Arches and Quintuplet as seen on the same material. In the present
study we employ larger resolution images to better select these
samples, which is important for detailed photometric studies with large telescopes.
m?
The samples of Dutra & Bica (2000, 2001) provided candidates within
both zones, which at the 2MASS angular resolution resembled the images
of Arches and Quintuplet as seen on the same material. In the present
study we employ larger resolution images to better select these
samples, which is important for detailed photometric studies with large telescopes.
Since star clusters towards the central parts dissolve in faster timescales, we would expect to observe objects at different dynamical stages and differently populated. Recently formed clusters will be embedded in the parent molecular clouds in different stages, and older objects unrelated to gas and dust may show evidence of advanced dynamical evolution.
![\begin{figure}
\par\resizebox{8.8cm}{!}{\includegraphics[clip]{h4195f1.eps}}\end{figure}](/articles/aa/full/2003/34/aah4195/img15.gif) |
Figure 1:
Images of object 11: a
|
| Open with DEXTER | |
Using the J,H and ![]() 2MASS images, Dutra & Bica (2000, hereafter
Paper I) detected 58 infrared star cluster candidates projected near
the Centre. Typical dimensions were 1-2
2MASS images, Dutra & Bica (2000, hereafter
Paper I) detected 58 infrared star cluster candidates projected near
the Centre. Typical dimensions were 1-2![]() ,
like those of
Arches and Quintuplet. At higher resolution the Arches cluster is
concentrated while the Quintuplet cluster is loose (Figer et al.
1999a). Seven additional candidates in the central parts were
indicated by Dutra & Bica (2001, hereafter Paper II). The angular
resolution of the 2MASS Atlas is not high, and it is necessary to
increase it and obtain deep images in order to constrain the nature of
the candidates. This is the objective of the present
,
like those of
Arches and Quintuplet. At higher resolution the Arches cluster is
concentrated while the Quintuplet cluster is loose (Figer et al.
1999a). Seven additional candidates in the central parts were
indicated by Dutra & Bica (2001, hereafter Paper II). The angular
resolution of the 2MASS Atlas is not high, and it is necessary to
increase it and obtain deep images in order to constrain the nature of
the candidates. This is the objective of the present ![]() survey with the 3.55 m ESO New Technology Telescope (NTT) making use
of the resolving power of the SOFI camera to study 52 candidates from
Paper I and 5 from Paper II. We also present detailed photometry of
Object 11 from Dutra & Bica (2000).
survey with the 3.55 m ESO New Technology Telescope (NTT) making use
of the resolving power of the SOFI camera to study 52 candidates from
Paper I and 5 from Paper II. We also present detailed photometry of
Object 11 from Dutra & Bica (2000).
In Sect. 2 we present the ![]() survey and results. In
Sect. 3 we present the H and K photometry of Object 11 and
analyse the results. Finally, concluding remarks are given in
Sect. 4.
survey and results. In
Sect. 3 we present the H and K photometry of Object 11 and
analyse the results. Finally, concluding remarks are given in
Sect. 4.
In view of selecting the previous 2MASS samples for detailed studies
with large telescopes we present a ![]() imaging survey carried
out with the NTT for 57 cluster candidates.
imaging survey carried
out with the NTT for 57 cluster candidates.
We employed the SOFI camera at the NTT Nasmyth A focus with the detector Rockwell
Hg:Cd:Te of
![]() pixels (18.5
pixels (18.5 ![]() m)
Hawaii array. We used the Small Field mode
(
m)
Hawaii array. We used the Small Field mode
(
![]() and scale 0.145
and scale 0.145
![]() /pixel)
on June 27, 2001 and the Large Field mode
(
/pixel)
on June 27, 2001 and the Large Field mode
(
![]() and scale 0.292
and scale 0.292
![]() /pixel)
on July 4-6, 2002.
The
/pixel)
on July 4-6, 2002.
The ![]() band (2.162
band (2.162 ![]() m) allows one to minimize dust absorption effects
(
m) allows one to minimize dust absorption effects
(
![]() ,
Cardelli et al. 1989).
Owing to weather conditions only a few objects were observed on
June 27, 2001 and July 5, 2002.
In June 2001 we adopted a detector integration time DIT = 4 s, a
number of detector integrations NDIT = 5 and a number of exposures
NEXP = 20, whereas on July 2002 DIT = 7,
NDIT = 7 and NEXP = 18.
More details on the observations are given in Table 1.
,
Cardelli et al. 1989).
Owing to weather conditions only a few objects were observed on
June 27, 2001 and July 5, 2002.
In June 2001 we adopted a detector integration time DIT = 4 s, a
number of detector integrations NDIT = 5 and a number of exposures
NEXP = 20, whereas on July 2002 DIT = 7,
NDIT = 7 and NEXP = 18.
More details on the observations are given in Table 1.
For infrared observations it is necessary to frequently subtract the sky thermal emission. We used the subtraction technique for small objects or uncrowded fields, from the SOFI Users Manual (Lidman et al. 2000). The reduction consisted of dark frame subtraction, sky subtraction and flat fielding, following the steps given in the SOFI manual.
In the process of flat fielding the illumination correction frames and the bad pixels maps, both available from the ESO webpages, were used.
Table 1: Log of observations.
The higher angular resolution and depth of the NTT images with respect to the 2MASS Atlas allowed us to classify the objects more clearly now. Note that the classifications are based on eye estimates of the stellar overdensity on the images.
Objects 11 (Fig. 1), 52 (Fig. 2a), 6 (Fig. 2b), 5 (Fig. 2b), 55, 10 (Fig. 2c), 01-40 and 01-41 (Fig. 2d) appear to be resolved star clusters, most of them embedded in nebulosity.
Objects 10 and 11 have counterparts in the Mid Space Experiment (MSX) survey (Egan et al. 1999). This infrared survey
provides data and images in the bands A (8.28 ![]() m), C (12.13
m), C (12.13 ![]() m), D (14.65
m), D (14.65 ![]() m)
and E (21.3
m)
and E (21.3 ![]() m) and is electronically available at the Web site http://irsa.ipac.caltech.edu/applications/MSX/.
The infrared emission of Objects 11 and 10 in these MSX bands is probably due to
dust heated by massive stars. In addition Object 10 has a counterpart in the IRAS point source catalog, [IRAS 17470-2853].
Using the colours diagram of IRAS PSC sources associated with ultra compact HII region from Wood & Churchwell (1989) and
IRAS 17470-2853's 12
m) and is electronically available at the Web site http://irsa.ipac.caltech.edu/applications/MSX/.
The infrared emission of Objects 11 and 10 in these MSX bands is probably due to
dust heated by massive stars. In addition Object 10 has a counterpart in the IRAS point source catalog, [IRAS 17470-2853].
Using the colours diagram of IRAS PSC sources associated with ultra compact HII region from Wood & Churchwell (1989) and
IRAS 17470-2853's 12 ![]() m, 25
m, 25 ![]() m and 60
m and 60 ![]() m IRAS fluxes, we find that it is an ultracompact HII region. In the field of Objects 11/10 there is diffuse emission with diameter
m IRAS fluxes, we find that it is an ultracompact HII region. In the field of Objects 11/10 there is diffuse emission with diameter ![]() 5
5![]() in a Digitized Sky Survey R band image (http://cadcwww.dao.nrc.ca/cadcbin/getdss), corresponding to the
optical HII region Sh2-21 (Sharpless 1959). Using the 2MASS Atlas one can trace in the area a dust (molecular) cloud with a diameter of
in a Digitized Sky Survey R band image (http://cadcwww.dao.nrc.ca/cadcbin/getdss), corresponding to the
optical HII region Sh2-21 (Sharpless 1959). Using the 2MASS Atlas one can trace in the area a dust (molecular) cloud with a diameter of ![]() 15
15![]() .
These structures, if located at about the Galactic center distance, would define a giant
molecular cloud and HII region with 2 embedded star clusters. In Sect. 3 we provide a NTT H and K photometry analysis of Object 11.
.
These structures, if located at about the Galactic center distance, would define a giant
molecular cloud and HII region with 2 embedded star clusters. In Sect. 3 we provide a NTT H and K photometry analysis of Object 11.
Objects 26 (Fig. 3a) and 56 (Fig. 3b) appear to be star clusters deeply embedded in dust and gas, in very early stages of star formation.
Near objects 12, 58 (Fig. 4a) and 01-42 (Fig. 4b) we find dust absorption. Therefore, it is not excluded that these objects are field stars seen through low absorption windows. Infrared colour-magnitude diagrams (CMD) may clarify the issue.
Object 01-01 (Fig. 4c) is an open cluster candidate. It is an interesting target for CMD studies, since not much is known about open clusters towards the Galactic center, a few kpc away from the Sun.
Object 49 is a clump of stars embedded in a nebula.
Several objects turned out to be concentrations of stars with little
or no gas/dust in the area. They may be clusters in the
process of dissolution. In the solar neighbourhood the timescale for
dissolution of open clusters is a few Gyr or less and several have
been studied in detail (Pavani et al. 2001; Carraro 2002; Pavani et al. 2003), while in
the central 200 pc the timescale is reduced to ![]() 70 Myr (Portegies
Zwart et al. 2001). These candidate dissolving clusters are objects 1, 7, 17, 25, 31, 32,
35, 40, 41, 42 and 01-02. Object 1 is shown in Fig. 4d.
70 Myr (Portegies
Zwart et al. 2001). These candidate dissolving clusters are objects 1, 7, 17, 25, 31, 32,
35, 40, 41, 42 and 01-02. Object 1 is shown in Fig. 4d.
Based on NTT images, the following objects were found not to be clusters, but one or more relatively bright stars (plus faint ones) or clumps which were previously unresolved in the 2MASS images (Paper I). These are the objects 2, 3, 4, 8, 9, 13, 14, 15, 16, 19, 20, 21, 22, 23, 24, 29, 30, 33, 34, 36, 37, 38, 39, 43, 44, 46, 47, 48, 53, 54 and 57. Recording such blended images which mimic clusters is also important in view of future systematic cluster surveys on the 2MASS Atlas.
![\begin{figure}
\par\resizebox{7.3cm}{!}{\includegraphics[clip]{h4195f2.eps}}\end{figure}](/articles/aa/full/2003/34/aah4195/img22.gif) |
Figure 2:
|
| Open with DEXTER | |
| |
Figure 3:
|
| Open with DEXTER | |
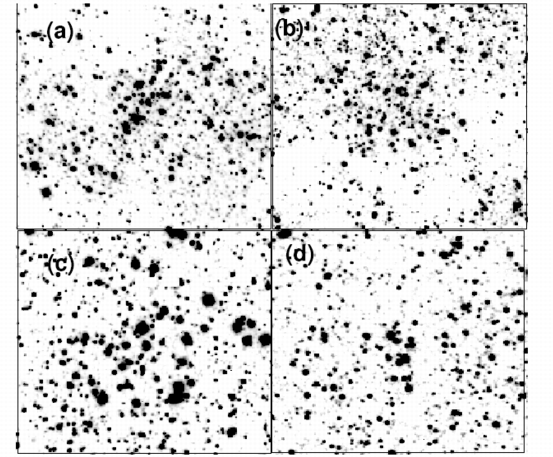 |
Figure 4:
|
| Open with DEXTER | |
We checked the possibility of association of the present objects with optical and radio nebulae (e.g. Kuchar & Clark 1997; Caswell & Haynes 1987; Lockman 1989), which in turn reinforces the possibility that they are young stellar systems. Object 58 appears to be related to the optical HII region Sh2-17, Objects 5 and 6 to Sh2-20, and Objects 7, 10, 11 and 12 to Sh2-21. Although Object 01-01 is projected close to the dark nebula LDN74 (Lynds 1962), it appears to be an evolved open cluster and consequently unrelated to it.
Object 26 is related to the nuclear star-forming complex Sgr D and Object 52 to Sgr E (Liszt 1992). Object 01-40 is in the radio HII region G353.4-04, 01-41 in G354.664+0.470 and 01-42 in G359.3-0.3. Object 55 appears to be related to G359.54+0.18, and 56 to G359.7-0.4.
We show in Fig. 5 the angular distribution including the results from
the present survey. We indicate clusters, cluster candidates and
cluster dissolution candidates. The overall sample spans objects
within 7![]() (1 kpc at the Galactic Center distance), and we
also indicate the region of 200 pc modeled by Portegies Zwart et al. (2001). In addition to objects from Dutra & Bica (2000, 2001) we
show objects from a recent 2MASS cluster search in the directions of
optical and radio nebulae (Bica et al. 2003). The asymmetry in the
sense of more objects projected on the eastern part of the central
Galaxy is due to the fact that the eastern side has been surveyed
with 2MASS for infrared clusters in all directions (Dutra & Bica
2000), while the western side has been mostly surveyed for embedded
clusters in the directions of nebulae.
(1 kpc at the Galactic Center distance), and we
also indicate the region of 200 pc modeled by Portegies Zwart et al. (2001). In addition to objects from Dutra & Bica (2000, 2001) we
show objects from a recent 2MASS cluster search in the directions of
optical and radio nebulae (Bica et al. 2003). The asymmetry in the
sense of more objects projected on the eastern part of the central
Galaxy is due to the fact that the eastern side has been surveyed
with 2MASS for infrared clusters in all directions (Dutra & Bica
2000), while the western side has been mostly surveyed for embedded
clusters in the directions of nebulae.
Since we are dealing mostly with embedded clusters and candidates,
these objects constitute an important sample for probing the cluster
populations related to intervening spiral arms and the central parts
of the Galaxy. We conclude that 42 objects are now available within
7![]() of the center, being 19 of them projected on Portegies
Zwart et al.'s zone.
of the center, being 19 of them projected on Portegies
Zwart et al.'s zone.
![\begin{figure}
\par\includegraphics[width=15cm,clip=]{h4195f5.eps}\end{figure}](/articles/aa/full/2003/34/aah4195/img25.gif) |
Figure 5:
Upper panel: updated angular distribution of star clusters and
candidates in the inner 7 |
| Open with DEXTER | |
The only object for which two colour photometry was available is
Object 11 from Dutra & Bica (2000). It is located at ![]() 1
1![]() (
(
![]() ,
b = -0.86) from the Galactic nucleus,
thus projected on the zone modeled by Portegies Zwart et al. (2001). In this section we present a more detailed analysis of the
cluster population, using its
,
b = -0.86) from the Galactic nucleus,
thus projected on the zone modeled by Portegies Zwart et al. (2001). In this section we present a more detailed analysis of the
cluster population, using its
![]() CMD.
CMD.
The H and ![]() observations at the NTT were
obtained with the SOFI camera equipped with the Hawaii
observations at the NTT were
obtained with the SOFI camera equipped with the Hawaii
![]() HgCdTe detector, with a pixel size of 18.5
HgCdTe detector, with a pixel size of 18.5 ![]() m, on July 2002.
m, on July 2002.
The observations used the SOFI small mode, with scale
![]() /pixel and field
/pixel and field
![]() .
The detector integration times DIT were 30 and 20 s for H and
.
The detector integration times DIT were 30 and 20 s for H and ![]() ,
respectively. Similarly, the number
of detector integrations NDIT was 2 and 3, for a total number of
exposures NEXP of 15.
,
respectively. Similarly, the number
of detector integrations NDIT was 2 and 3, for a total number of
exposures NEXP of 15.
The thermal emission subtraction technique follows (Lidman et al. 2000). The standard stars 9150, 9157 and 9170 from Persson et al. (1998) were observed at different airmasses. For each standard star five measurements of 2 s for each airmass were obtained.
Dark frame subtraction, sky subtraction and flat fielding were applied. We used illumination correction frames and the bad pixels masks, available from the ESO webpages for flat fielding.
We used a ![]() filter, and we consider that this introduces an
extra uncertainty in the K filter calibration of
filter, and we consider that this introduces an
extra uncertainty in the K filter calibration of ![]() 0.02 mag
(e.g. Ivanov et al. 2000). The instrumental magnitudes of the
standard stars were normalized to 1 s exposure and zero airmass,
according to the following equation:
0.02 mag
(e.g. Ivanov et al. 2000). The instrumental magnitudes of the
standard stars were normalized to 1 s exposure and zero airmass,
according to the following equation:
 |
(1) |
| (2) |
| (3) |
The photometric extractions were performed on the stacked images using
DAOPHOT/ALLSTAR package. The final calibrated magnitudes took into
account aperture corrections applied to PSF magnitudes (0.115 and
0.080 mag for H and ![]() respectively).
respectively).
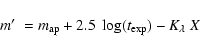
 |
Figure 6: H and K comparisons of the present and 2MASS photometries. Identity functions are shown. |
| Open with DEXTER | |
We searched in our observations for stars in common with the 2MASS
photometry. They occur both in the object area and in the surrounding
field, reaching
![]() and
and
![]() .
The comparison is
shown in Fig. 6. There is a linear relation between the photometries,
which departs somewhat from identity. The zero-point differences
between linear fits to the data and the identity function are 0.17
for H and 0.11 for
.
The comparison is
shown in Fig. 6. There is a linear relation between the photometries,
which departs somewhat from identity. The zero-point differences
between linear fits to the data and the identity function are 0.17
for H and 0.11 for
![]() .
In the linear fits we disregarded three
deviant points in H and one in K which are probably due to, e.g.,
crowding, cosmic rays or variable stars.
.
In the linear fits we disregarded three
deviant points in H and one in K which are probably due to, e.g.,
crowding, cosmic rays or variable stars.
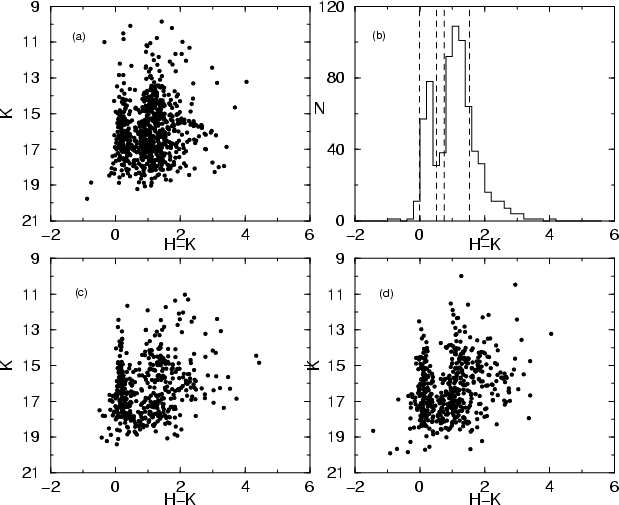 |
Figure 7: K, H-K diagrams for cluster (panel a)) and fields 1 (panel c)) and 2 (panel d)) extractions. Panel b) shows H-K colour histogram for the object area. |
| Open with DEXTER | |
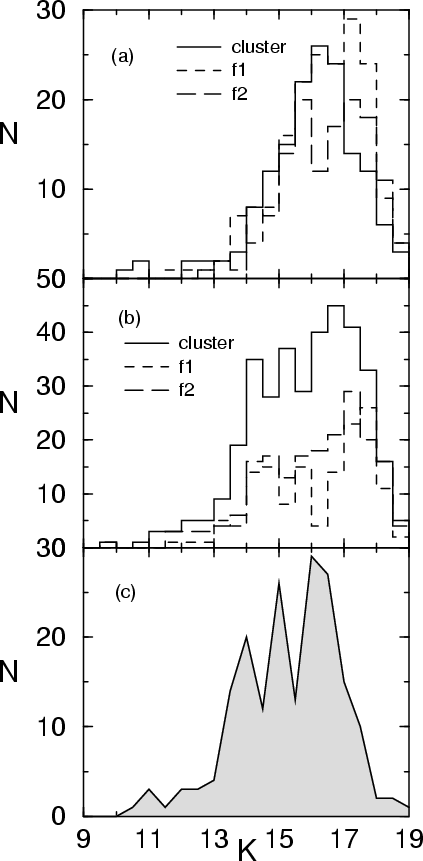 |
Figure 8: Upper panel: K histogram for stars in the range 0.0 <H-K< 0.5. Middle panel: K histogram for stars in the range 0.75 <H-K< 1.5. Continuous line corresponds to object while dashed and long dashed lines to the fields. Lower panel: K cluster luminosity function derived from average field subtraction for 0.75 <H-K< 1.5. |
| Open with DEXTER | |
For the photometric analyses we selected three
![]() square regions in the object area and two fields on either side to the east
(Field 1) and west (Field 2).
square regions in the object area and two fields on either side to the east
(Field 1) and west (Field 2).
Figure 7 shows K, H-K CMDs from the NTT photometry for the object
(panel a) and the two side fields (panels c and d). In the CMDs two
sequences are clearly present, which peak at
![]() and 1.10 respectively, as shown in the colour histogram
of panel b). Note that in the object CMD the second sequence is more
populated than in the CMDs of the fields. In order to verify this
point which would indicate the presence of a cluster, we built
histograms of the distribution of stars along the K magnitude,
assuming a H-K colour interval for each sequence. Figure 8 shows the
results, where we assumed for the blue and red sequences the
respective colour intervals
0.0<H-K<0.5 and
0.75<H-K<1.5. The
upper panel of Fig. 8 shows that no contrast is observed for the blue
sequence, indicating that we are dealing with field stars both in the
object and field extractions. The middle panel of Fig. 8 shows a
strong contrast between the object and field extractions for the red
sequence, especially for stars fainter than K = 13, indicating a
cluster. Finally, in the lower panel of Fig. 8 we show the field
subtracted luminosity function which increases to
and 1.10 respectively, as shown in the colour histogram
of panel b). Note that in the object CMD the second sequence is more
populated than in the CMDs of the fields. In order to verify this
point which would indicate the presence of a cluster, we built
histograms of the distribution of stars along the K magnitude,
assuming a H-K colour interval for each sequence. Figure 8 shows the
results, where we assumed for the blue and red sequences the
respective colour intervals
0.0<H-K<0.5 and
0.75<H-K<1.5. The
upper panel of Fig. 8 shows that no contrast is observed for the blue
sequence, indicating that we are dealing with field stars both in the
object and field extractions. The middle panel of Fig. 8 shows a
strong contrast between the object and field extractions for the red
sequence, especially for stars fainter than K = 13, indicating a
cluster. Finally, in the lower panel of Fig. 8 we show the field
subtracted luminosity function which increases to
![]() ,
also
suggesting a cluster. Completeness effects must be affecting fainter
magnitudes.
,
also
suggesting a cluster. Completeness effects must be affecting fainter
magnitudes.
For a more detailed CMD analysis we statistically
decontaminated the cluster's CMD (Fig. 9a) from the Bulge stellar field contribution represented by
stars extracted outside the cluster area (Fig. 9b). In the decontamination procedure, we scaled the Bulge stars contribution considering the cluster area.
For each star in the scaled bulge CMD we picked the closest star in the cluster's CMD, and subtracted it. The distance on the CMD from bulge field star and star in the cluster area was defined as:
![\begin{displaymath}d=\sqrt{[7 \times \Delta(H-K)]^2 + \Delta H^2}
\end{displaymath}](/articles/aa/full/2003/34/aah4195/img44.gif)
The bulge tilted horizontal branch can be seen in Fig. 9b starting
from K = 13.8 and
H-K = 0.76. Assuming that the dust/molecular cloud must
be behind the bulk of the bulge population seen in the diagram (it must have a much higher extinction), we can set a lower limit for
the distance of Object 11. We use as reference for the bulge field population
that of the CMDs at the minor axis
![]() (Zoccali et al. 2003).
In this field the bulge clump is located at K = 12.7 and
H-K =
0.25. The reddening at
(Zoccali et al. 2003).
In this field the bulge clump is located at K = 12.7 and
H-K =
0.25. The reddening at
![]() is
E(B-V) = 0.37, corresponding to
E(H-K) = 0.10 and
AK = 0.175. The intrinsic value is K0 = 12.53,
and
(H-K)0 = 0.15. The colour difference between the bulge in the
direction of Object 11 and the
is
E(B-V) = 0.37, corresponding to
E(H-K) = 0.10 and
AK = 0.175. The intrinsic value is K0 = 12.53,
and
(H-K)0 = 0.15. The colour difference between the bulge in the
direction of Object 11 and the
![]() field is
field is
![]() corresponding to
AK = 1.05 (or AV = 9.6). The relative distance modulus is
corresponding to
AK = 1.05 (or AV = 9.6). The relative distance modulus is
![]() .
Given the distance uncertainties this means that the two fields are at the
same distance, i.e. compatible with that of the Galactic center.
From the colour excess of the Object 11 field we get the minimum absorption
which is likely the absorption in front of the cloud (AV = 9.6). This value is consistent
with the presence of an optical HII region (Sect. 2.2).
.
Given the distance uncertainties this means that the two fields are at the
same distance, i.e. compatible with that of the Galactic center.
From the colour excess of the Object 11 field we get the minimum absorption
which is likely the absorption in front of the cloud (AV = 9.6). This value is consistent
with the presence of an optical HII region (Sect. 2.2).
The 10th brightest star method to determine cluster distances is useful when no spectral type information is available for young clusters (Dutra & Bica 2001). The method assumes similarity of luminosity functions of two clusters, and avoids uncertainties due to the brightest stars, for which luminosity effects are important. The 10th brightest star in the giant H II region cluster NGC 3603 is an O4V star (Moffat 1983). We will make two assumptions, that Object 11 is: i) a massive cluster where the 10th brightest star is an O5V, or ii) a less massive cluster where the 10th brightest star would correspond to a B0V star. According to Cotera et al. (2000) O5V stars have intrinsic magnitude and colour MK=-4.81 and (H-K)0=-0.08, while B0V stars have MK=-3.34 and (H-K)0=-0.07.
Object 11 (Fig. 1) is embedded in nebulosity which suggests very
young ages (t<5 Myr). For the subsequent analysis we use Cotera et al.'s (2000) values for
upper Main Sequence (MS) stars and the 10th brightest star method to estimate the reddening and
distance parameters for Object 11. We derive from Object 11's decontaminated CMD (Fig. 9c) a reddening
E(H-K)= 1.14 with an important differential reddening
![]() as can be estimated from a mean reddening of
H-K = 1.07 in comparison to Cotera et al.'s (2000) MS stars. Adopting the
absorption ratios from Schlegel et al. (1998), one can derive the
relation
AK=1.436 E(H-K), which leads to AK=1.64. This value
corresponds to a visual absorption
as can be estimated from a mean reddening of
H-K = 1.07 in comparison to Cotera et al.'s (2000) MS stars. Adopting the
absorption ratios from Schlegel et al. (1998), one can derive the
relation
AK=1.436 E(H-K), which leads to AK=1.64. This value
corresponds to a visual absorption
![]() .
.
According to Fig. 9c the 10th brightest star in Object 11 is
located at K=12.7. Assuming Object 11 as a massive cluster similar
to NGC 3603, we derive a distance from the Sun
![]() kpc. On the other hand, it we assume a less massive cluster with a B0V star as 10th
brightest, then
kpc. On the other hand, it we assume a less massive cluster with a B0V star as 10th
brightest, then
![]() kpc. The Quintuplet cluster,
argued to be at the Galactic centre distance, has AV= 29 (Figer et al. 1999b), much higher than that of Object 11. Therefore, Object 11
appears to be slightly in the foreground of the Galactic centre, being a less
reddened and less massive cluster, favouring the solution
kpc. The Quintuplet cluster,
argued to be at the Galactic centre distance, has AV= 29 (Figer et al. 1999b), much higher than that of Object 11. Therefore, Object 11
appears to be slightly in the foreground of the Galactic centre, being a less
reddened and less massive cluster, favouring the solution
![]() kpc. Differential reddening is the main source of
uncertainties in distance, assuming that the spectral type of
the 10th brightest star is correct. For Object 11
kpc. Differential reddening is the main source of
uncertainties in distance, assuming that the spectral type of
the 10th brightest star is correct. For Object 11
![]() implies
implies
![]() and a distance uncertainty of
and a distance uncertainty of
![]() 1.2 kpc. Figure 10 shows the decontaminated Object 11 CMD
superimposed on Cotera et al.'s (2000) MS
spectral type distribution considering
the B0V reddening/distance solution. Note that we are probably
reaching F0 stars. It would be important to carry out spectroscopy of
cluster stars in order to further constrain the distance.
1.2 kpc. Figure 10 shows the decontaminated Object 11 CMD
superimposed on Cotera et al.'s (2000) MS
spectral type distribution considering
the B0V reddening/distance solution. Note that we are probably
reaching F0 stars. It would be important to carry out spectroscopy of
cluster stars in order to further constrain the distance.
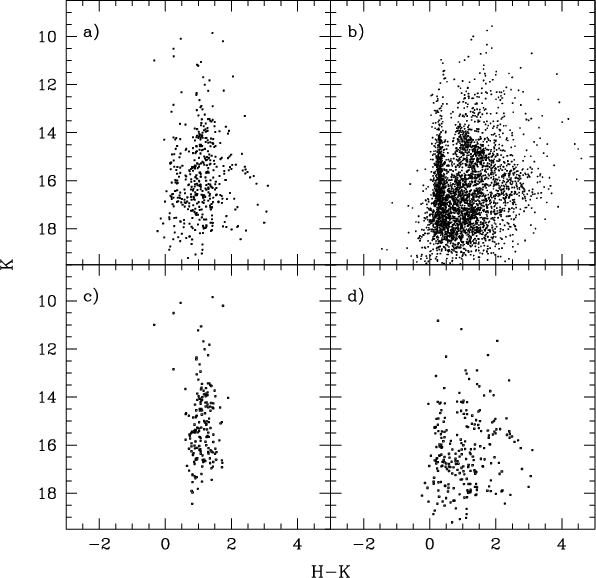 |
Figure 9:
K, H-K diagrams: a) Object 11 area, extraction of stars with distance
|
| Open with DEXTER | |
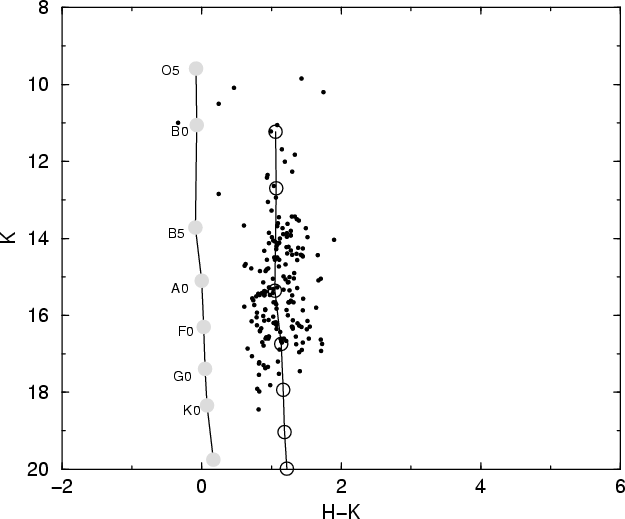 |
Figure 10:
K, H-K diagram of object, where field stars have been statistically
subtracted. MS spectral types sequence from Cotera et al. (2000): reddening-free and at 7.6 kpc (gray circles and solid line) and with a reddening/distance solution with AK= 1.64(AV= 15) and
|
| Open with DEXTER | |
This study aimed to settle a star cluster sample for the exploration of the
structure and star formation events towards the central parts of the Galaxy.
By means of ESO NTT observations we increased the angular resolution
and depth of observations for 57 infrared cluster candidates towards
the central Galaxy, as compared to those of the 2MASS Atlas, where
these objects had been first identified. We explored this sample
showing which objects are clusters, remain as cluster candidates or
appear to be dissolving cluster candidates. We also indicated
additions from other samples giving an updated census of 42 objects
within 7![]() (1 kpc distance from the Galactic centre), of which
19 are within 1.43
(1 kpc distance from the Galactic centre), of which
19 are within 1.43![]() (200 pc). Detailed photometry of the
present set of objects using large telescopes is required to derive
their properties such as star membership, reddening and age, in order
to establish their location in the Galaxy as intervening spiral arms
or the Galactic Center.
(200 pc). Detailed photometry of the
present set of objects using large telescopes is required to derive
their properties such as star membership, reddening and age, in order
to establish their location in the Galaxy as intervening spiral arms
or the Galactic Center.
We analyzed in detail one of these objects projected at ![]()
![]() of the nucleus. H and K photometry of Object 11 showed
a colour-magnitude diagram and luminosity function of a cluster. The
cluster has AV=15 and appears to be located at
of the nucleus. H and K photometry of Object 11 showed
a colour-magnitude diagram and luminosity function of a cluster. The
cluster has AV=15 and appears to be located at
![]() kpc from the Sun, therefore not far from the Galactic centre. The
cluster appears to be less massive than the Arches and Quintuplet clusters.
kpc from the Sun, therefore not far from the Galactic centre. The
cluster appears to be less massive than the Arches and Quintuplet clusters.
Acknowledgements
We acknowledge support from the Brazilian Institutions CNPq and FAPESP. CMD acknowledges FAPESP for a post-doc fellowship (Proc. 2000/11864-6). SO thanks the Italian Ministero dell'Università e della Ricerca Scientifica e Tecnologica (MURST) under the program on Stellar Dynamics and Stellar Evolution in Globular Clusters: a Challenge for New Astronomical Instruments.