T. Lueftinger1 - R. Kuschnig1,2 - N. E. Piskunov3 - W. W. Weiss1
1 - Inst. for Astronomy, Univ. of Vienna, Türkenschanzstr. 17, 1180
Vienna, Austria
2 - Department of Physics & Astronomy, Univ. British Columbia, Canada
3 - Uppsala Astronomical Observatory, Box 515, 75120 Uppsala, Sweden
Received 19 July 2001 / Accepted 20 May 2003
Abstract
The surface abundance structure of seven elements of the brightest chemically peculiar
A-type star, ![]() Ursae Majoris (
Ursae Majoris (![]() UMa, HD 112185, HR 4905) has been determined.
Cr, Fe and, Mn are enhanced at the magnetic polar region of
UMa, HD 112185, HR 4905) has been determined.
Cr, Fe and, Mn are enhanced at the magnetic polar region of ![]() UMa while they avoid the
magnetic equator. Sr seems to behave like Cr, Fe, and Mn, but is
concentrated only at one of the two magnetic poles.
Ti, in contrast, is accumulated at the magnetic equator and
is depleted where Cr and Fe are accumulated, in accordance with theoretical predictions.
Mg and Ca do not correlate with the distribution of
Cr, Fe, Mn, and Sr or with Ti.
The surface distribution of Mn, Sr, Ti, and Mg was determined
for the first time for this star.
A Doppler Imaging code was used that allows to analyse elements present in complex spectral line blends
and thus to increase significantly the potential to map more elements.
We compare our Cr and Fe distributions to already published maps. The high
consistency of our results, based on different observations and Doppler Imaging codes, proves the reliability of the different methods.
UMa while they avoid the
magnetic equator. Sr seems to behave like Cr, Fe, and Mn, but is
concentrated only at one of the two magnetic poles.
Ti, in contrast, is accumulated at the magnetic equator and
is depleted where Cr and Fe are accumulated, in accordance with theoretical predictions.
Mg and Ca do not correlate with the distribution of
Cr, Fe, Mn, and Sr or with Ti.
The surface distribution of Mn, Sr, Ti, and Mg was determined
for the first time for this star.
A Doppler Imaging code was used that allows to analyse elements present in complex spectral line blends
and thus to increase significantly the potential to map more elements.
We compare our Cr and Fe distributions to already published maps. The high
consistency of our results, based on different observations and Doppler Imaging codes, proves the reliability of the different methods.
Key words: stars: abundances - stars: chemically peculiar -
stars: magnetic fields -
stars: individual: ![]() UMa, HD 112185, HR 4905
UMa, HD 112185, HR 4905
Magnetic Ap stars show the variation of line profiles synchronized with the stellar rotation. These variations are assumed to be due to a significantly inhomogeneous surface distribution of elements, unusually strong lines of rare earth elements and magnetic fields, whereby all these quantities vary with the rotational period.
Doppler imaging is an inversion technique which allows to derive two-dimensional abundance distributions on the surface of Ap stars from observed spectral line profile variations. Recent reviews on this technique were published, e.g., by Piskunov & Rice (1993) and Rice (1996), who describe Doppler Imaging methods in general, and Hatzes (1996), who focusses on Ap star mapping.
Presently the most convincing theory for explaining abundance distribution anomalies on the surface of magnetic Ap stars is based on radiative diffusion of chemical elements and their interaction with an oblique magnetic field (Michaud et al. 1981; Michaud 1993). Other mechanisms that may contribute to the observed surface abundance inhomogeneities are accretion or diffusion combined with mass loss due to weak metal-rich winds. Detailed analyses concerning diffusion velocity and the influence of the ionization state of Si on its diffusion behaviour have been made by Alecian & Vauclair (1981). The effect of weak metal-rich winds is discussed in detail by Babel (1992, 1995). It is the goal of the present paper to provide further observational constraints on theories explaining atmospheric inhomogeneities, diffusion mechanisms and the influence of magnetic fields.
We determined for ![]() UMa for the first time the abundance distributions of Mn, Ti, Sr, and Mg
and we prove that our code is capable of handling difficult data.
The Doppler Imaging code INVERS11, developed by NP,
allows to map simultaneously more than one element and using complex spectral line
blends. Comparing our results with previously published maps we found
good agreement (Cr and Fe, mapped by Wehlau et al.
1982; Rice & Wehlau 1990, 1991; Hatzes
1988, 1991).
A detailed description of the method is given in Appendix A.
UMa for the first time the abundance distributions of Mn, Ti, Sr, and Mg
and we prove that our code is capable of handling difficult data.
The Doppler Imaging code INVERS11, developed by NP,
allows to map simultaneously more than one element and using complex spectral line
blends. Comparing our results with previously published maps we found
good agreement (Cr and Fe, mapped by Wehlau et al.
1982; Rice & Wehlau 1990, 1991; Hatzes
1988, 1991).
A detailed description of the method is given in Appendix A.
The new code and a spectral coverage of 4040 Å-4260 Å and 4440 Å-4640 Å allowed to increase significantly the number of useable spectral lines and as a result the number of elements to be mapped. The reliability of the determined elemental surface distributions is also increased by using lines of the same element but with different atomic parameters (compare Fig. 7, Cr from the Cr II 4558 Å line, to Fig. A.1, Cr from the blend of Cr I, Fe I/ II and Ca I in the region around 4526 Å).
At this point we would like to summarize Doppler imaging results already
obtained for ![]() UMa:
UMa:
Fe and Cr were mapped in 1982 by Wehlau et al. (1982) and they find two
regions of enhanced Fe and Cr abundance. Rice & Wehlau published further maps of
these two elements in 1990 and find a major feature at 0![]() and another
enhancement region between 140
and another
enhancement region between 140![]() and 260
and 260![]() ,
supporting their results
from 1982. They suspect the distribution
of Fe and Cr being the same, represented by a certain set of poles and rings
(for details see Rice & Wehlau 1990), but caution the readers against
distortion effects in the Cr maps due to limited quality of absorption line
profiles. In a follow up paper (Rice & Wehlau 1991), they apply a modified
Doppler Imaging program (Rice 1990) and obtain
comparable results. Abundances of both elements range from the solar value up to
factors of 100.
,
supporting their results
from 1982. They suspect the distribution
of Fe and Cr being the same, represented by a certain set of poles and rings
(for details see Rice & Wehlau 1990), but caution the readers against
distortion effects in the Cr maps due to limited quality of absorption line
profiles. In a follow up paper (Rice & Wehlau 1991), they apply a modified
Doppler Imaging program (Rice 1990) and obtain
comparable results. Abundances of both elements range from the solar value up to
factors of 100.
Donati et al. published in 1990 the "first reliable magnetic
detection'' for the Ap star ![]() UMa and assume a decentered dipolar structure. They
propose that the overabundant regions of Fe II coincide with the magnetic
poles. Bohlender & Landstreet (1990) published a further analysis of the weak magnetic
field of
UMa and assume a decentered dipolar structure. They
propose that the overabundant regions of Fe II coincide with the magnetic
poles. Bohlender & Landstreet (1990) published a further analysis of the weak magnetic
field of ![]() UMa and find consistency of their results with Donati et al., the surface maps
calculated by Hatzes (1988) and by Rice & Wehlau (1990): Fe and Cr are enhanced in intermediate
magnetic spots or rings and seem to be depleted near the magnetic equator.
UMa and find consistency of their results with Donati et al., the surface maps
calculated by Hatzes (1988) and by Rice & Wehlau (1990): Fe and Cr are enhanced in intermediate
magnetic spots or rings and seem to be depleted near the magnetic equator.
Hatzes (1991) suggests for Cr a depleted band or ring circling the magnetic equator and a depleted spot at the magnetic poles and he proposes two different explanations for the depletion around the magnetic equator: the presence of a strong quadrupole component if Cr is depleted where magnetic field lines are vertical, or horizontal diffusion of the element after its vertical diffusion in the atmosphere, whereby he favours the horizontal diffusion concept.
The first images of O and Ca were presented by Babel et al. (1995). They find a ring that seems to coincide with the magnetic equator in which Ca and O show enhanced abundances, while Fe and Cr are depleted in this region. They argue that horizontal diffusion cannot operate because it is efficient only for specific elements, and furthermore, Ca and O should be accumulated at the magnetic poles.
Another O map was presented in 1997 by Rice et al., who finds significantly
enhanced O abundance in a belt at the magnetic equator and a
second belt tilted at 60![]() to 70
to 70![]() .
.
Holmgren & Rice (2000) analysed the distribution of Ca and also found a ring of enhanced Ca abundance (compared to other regions) along the magnetic equator.
![]() Ursae Majoris (
Ursae Majoris (![]() UMa, HD 112185, HR 4905) is the brightest
(
UMa, HD 112185, HR 4905) is the brightest
(
![]() )
chemically peculiar A star and has been extensively studied during the last
century.
Periodic changes in absorption line intensities lead to the first precise
value for the rotation period of 5.0887 days (Guthnick 1934).
Spectroscopic and photometric studies by Struve &
Hiltner (1943) and Provin (1953) confirmed this period.
)
chemically peculiar A star and has been extensively studied during the last
century.
Periodic changes in absorption line intensities lead to the first precise
value for the rotation period of 5.0887 days (Guthnick 1934).
Spectroscopic and photometric studies by Struve &
Hiltner (1943) and Provin (1953) confirmed this period.
Values in the literature for ![]() are
are ![]() km s-1
(Hatzes 1991), 35 km s-1 (Rice et al. 1989) and 38 km s-1 (Rice & Wehlau 1991). Most recent results (Babel et al. 1995; Rice et al. 1997; Holmgren & Rice 2000)
converge towards a
km s-1
(Hatzes 1991), 35 km s-1 (Rice et al. 1989) and 38 km s-1 (Rice & Wehlau 1991). Most recent results (Babel et al. 1995; Rice et al. 1997; Holmgren & Rice 2000)
converge towards a ![]() of 33 km s-1.
of 33 km s-1.
Radius determinations for ![]() UMa give values between 3.6 to
4.3 solar radii (Hatzes 1991; Lueftinger 2000).
UMa give values between 3.6 to
4.3 solar radii (Hatzes 1991; Lueftinger 2000).
Phases were calculated for the present investigations with the ephemeris of Provin (1953):
| (1) |
Landstreet et al. (1975) and Borra & Landstreet (1980) did
not detect a magnetic field larger than a few hundred Gauss using a solar magnetograph
technique for Balmer lines.
Glagolevsky et al. (1982, 1983) detected a magnetic field varying from -300
to +600 G from polarization of the H![]() -line. Hubrig (1988) applied
Babcock's technique and measured a field ranging from +708 to -1100 G.
-line. Hubrig (1988) applied
Babcock's technique and measured a field ranging from +708 to -1100 G.
More recent measurements, to which we refer in
Sect. 6, are from Donati et al. (1990) and Bohlender & Landstreet (1990).
All give evidence for a weak magnetic field, varying sinusoidally between +128 and -64 G and dominated by
a decentered dipolar component. Their analyses reveal that the magnetic poles cross the line of sight at phases
0.941 and 0.441 (according to the ephemeris of Provin, 1953), which corresponds to the region of enhanced Cr and Fe
in our maps (see Sect. 5) visible around phases 0.9 and 0.5. Measurements of the polar magnetic field yield ![]() G (Donati & Semel 1990)
or about 400 G by Bohlender & Landstreet (1990), who used a Balmer-line
magnetometer.
Shtol' et al. (1997) measured the magnetic field of
G (Donati & Semel 1990)
or about 400 G by Bohlender & Landstreet (1990), who used a Balmer-line
magnetometer.
Shtol' et al. (1997) measured the magnetic field of ![]() UMa
(also using a hydrogen-line magnetometer) and found values for
UMa
(also using a hydrogen-line magnetometer) and found values for
![]() G and
G and
![]() G.
The ratio of the magnetic extrema, r, for a magnetic field dominated by the dipolar component can be used to derive the obliquity of the rotation axis to the magnetic axis,
G.
The ratio of the magnetic extrema, r, for a magnetic field dominated by the dipolar component can be used to derive the obliquity of the rotation axis to the magnetic axis, ![]() (Preston 1967):
(Preston 1967):
| (2) |
The observations used for this work were obtained by RK in June 1994 and in March 1995 at the Observatoire de Haute Provence with the AURELIE spectrograph, covering the spectral regions 4040 Å-4260 Å and 4440 Å-4640 Å. A resolution of about 20 000 and a signal-to-noise ratio of 200 was achieved for all spectra.
Observations for previously published maps reached signal-to-noise ratios of up to 800 for individual phases (Hatzes 1991) and a spectral reslution of R = 60 000 and more. It is comforting to see that INVERS11 produces with our data of lower quality (see also Sect. 5.2) comparable maps for, e.g., Cr and Fe.
Data reduction, wavelength calibration and normalization was done with the pcIPS software (Smirnov & Piskunov 1994).
Observations used for mapping and the corresponding phases are listed in Table 1.
Table 1:
![]() UMa: log of observations.
UMa: log of observations.
The effective surface temperature
![]() of
of ![]() UMa was
estimated from Balmer line fitting. Model atmospheres with a step interval of 100 K were calculated with
Kurucz's ATLAS9 programs (Kurucz 1992, 1993). Hydrogen lines were synthesized with the program SYNTH
(Piskunov 1992) and the resulting profiles were compared to the observed profiles of the
UMa was
estimated from Balmer line fitting. Model atmospheres with a step interval of 100 K were calculated with
Kurucz's ATLAS9 programs (Kurucz 1992, 1993). Hydrogen lines were synthesized with the program SYNTH
(Piskunov 1992) and the resulting profiles were compared to the observed profiles of the ![]() line.
An additional check was performed using spectrophotometry and lead us to the
final choice of
line.
An additional check was performed using spectrophotometry and lead us to the
final choice of
![]() K which is lower by 500 K than what is used by
others.
In any case, tests confirmed that size and location of surface features
discussed in this paper are only marginally
affected by the choice of the temperature.
K which is lower by 500 K than what is used by
others.
In any case, tests confirmed that size and location of surface features
discussed in this paper are only marginally
affected by the choice of the temperature.
The surface gravity ![]() was also determined via Balmer line fitting and
refined by selecting the value which best approximates the strong Fe I and Fe II lines.
was also determined via Balmer line fitting and
refined by selecting the value which best approximates the strong Fe I and Fe II lines.
Starting values for the determination of ![]() and i were taken from the literature (Rice et al. 1989;
Hatzes 1991; Rice & Wehlau 1991) and refined by
minimizing the deviation between the observed and calculated
profiles.
The best fit was obtained for:
and i were taken from the literature (Rice et al. 1989;
Hatzes 1991; Rice & Wehlau 1991) and refined by
minimizing the deviation between the observed and calculated
profiles.
The best fit was obtained for:
Macroturbulent velocity was set to 0 km s-1, microturbulent velocity to 2 km s-1.
The radius of ![]() UMa corresponding to our choice of
UMa corresponding to our choice of ![]() and i
yields
and i
yields
![]() using the trigonometric parallax
measured by Hipparcos,
using the trigonometric parallax
measured by Hipparcos, ![]() mas (ESO, 1997) and an angular diameter of
1.561 mas. The latter value was determined by fitting observed
fluxes in the ultraviolet and visible region (Jamar 1976, and Geneva photometry)
with fluxes from our model atmosphere and we obtain a formal error of 0.01 mas.
mas (ESO, 1997) and an angular diameter of
1.561 mas. The latter value was determined by fitting observed
fluxes in the ultraviolet and visible region (Jamar 1976, and Geneva photometry)
with fluxes from our model atmosphere and we obtain a formal error of 0.01 mas.
An inclination angle of 57![]() would be consistent with this radius according
to
would be consistent with this radius according
to
Maps produced for an i=57![]() and a
and a ![]() of 33 km s-1 and 35 km s-1,
respectively, using the Cr line at 4558 Å resulted in deviations of
1.49% and 1.46% instead of 0.9% for
of 33 km s-1 and 35 km s-1,
respectively, using the Cr line at 4558 Å resulted in deviations of
1.49% and 1.46% instead of 0.9% for
![]() km s-1 and i=45
km s-1 and i=45![]() .
Clearly, an i=45
.
Clearly, an i=45![]() results in a formally better map.
results in a formally better map.
The Vienna Atomic Line Database (VALD, Piskunov et al. 1995; Ryabchikova et al. 1999; Kupka et al. 1999) provided the atomic line data necessary for the spectral synthesis of the local line profiles. The quality of the atomic parameters included in VALD has been investigated and commented upon in the literature.
It is known that errors in the atomic parameters may cause distortions in the maps. This is also the reason why we tried to derive abundance maps from different lines. For two elements, Sr and Ca, this was unfortunately not possible, but for all others, Cr, Fe, Mn, Ti, and Mg, the mapping with different lines resulted in similar abundance structures.
The macroturbulent velocity was set to 0 km s-1 and microturbulent velocity to 2 km s-1. This choice should be appropriate for this star because a non-zero microturbulence can take into account magnetic field effects. It is accepted that a microturbulence value of 0 km s-1 can be expected for magnetic stars, but this knowledge is of limited help when producing synthetic line profiles unless a good model for a magnetic field and a synthesis code which is based on Stokes parameters is available. It could be argued that a microturbulent velocity of 1 km s-1 might be a better compromise and we therefore computed maps with 0, 1, and 2 km s-1. The resuling maps do not differ in location and size of the spots, only in the abundance range, which is expected.
Abundance maps for each element are presented in one mercator and four spherical projections. The figures consist of:
Table 2: List of elements and spectral ranges used for the inversion procedure. In Cols. 3 and 4 we list central wavelengths and elements contributing to a blend.
In this section we present Doppler Images of the elements listed in Table 2, where the abundance distributions of Mn, Ti, Sr, and Mg have been determined for the first time. The innovative aspect of INVERS11 consists in its ability to image simultaneously various elements from complex spectral line blends (as, e.g. from the blend of Cr and Fe with Ca, see Sect. 5.2.3).
The Mn line at 4518 Å (Figs. 1 and 3) was used to derive the surface abundance
pattern of this element. The mean abundance of Mn is about -5.6 dex and varies within 0.1 dex.
The structure is very similar to that of Cr and Fe and shows one spot
from 0![]() to +50
to +50![]() in latitude (it is more pronounced than the spots in this region
for Cr and Fe) and from 90
in latitude (it is more pronounced than the spots in this region
for Cr and Fe) and from 90![]() to 200
to 200![]() in longitude. Another
spot can be found from longitude 310
in longitude. Another
spot can be found from longitude 310![]() through 0
through 0![]() to 30
to 30![]() and
between 0
and
between 0![]() to about 50
to about 50![]() in latitude.
in latitude.
![\begin{figure}
\par\includegraphics[width=8.8cm,clip]{1708.f1}
\end{figure}](/articles/aa/full/2003/30/aa1708/img28.gif) |
Figure 1:
The Mn distribution on the surface of |
| Open with DEXTER | |
The Ti distribution seems to be anticorrelated to
Fe, Cr, and Mn (Figs. 2 and 3). The map was derived from
the unblended
Ti Ilines at 4501 Å and 4571 Å, from a blend with Fe in this
region, and from mapping the
blends of Ti with Cr from 4563 Å to 4565 Å.
The Ti abundance varies between -7.75 and -7.55 dex and is
underabundant by about 0.3 to 0.5 dex compared to the solar value.
Two main features are
resolved: one big enhancement region from -30![]() to +30
to +30![]() in latitude and between
210
in latitude and between
210![]() and 310
and 310![]() in longitude and another with same latitude but a longitude from
0
in longitude and another with same latitude but a longitude from
0![]() to about 130
to about 130![]() .
.
![\begin{figure}
\par\includegraphics[width=8.8cm,clip]{1708.f2}
\end{figure}](/articles/aa/full/2003/30/aa1708/img29.gif) |
Figure 2:
Ti distribution on the surface of |
| Open with DEXTER | |
![\begin{figure}
\par\includegraphics[width=4.35cm,clip]{1708.f3a}\includegraphics[width=4.35cm,clip]{1708.f3b}
\end{figure}](/articles/aa/full/2003/30/aa1708/img30.gif) |
Figure 3: Mn II ( left, blended with Fe II between 4518 Å and 4522 Å) and Ti II ( right, blended with Cr II in the region from 4563 Å to 4565 Å) profiles. |
| Open with DEXTER | |
It seems that Sr (Fig. 4) shows a similar behaviour as Fe, Cr, and Mn, but
with the spotted ring structure slightly shifted towards the equator.
A very prominent spot can be found at phase 0.0 with stellar latitude between
+30![]() and -30
and -30![]() .
The enhancement region between 130
.
The enhancement region between 130![]() and 180
and 180![]() in longitude is less pronounced than for the
other elements. Sr was mapped using the blend with Cr around 4215 Å.
in longitude is less pronounced than for the
other elements. Sr was mapped using the blend with Cr around 4215 Å.
![\begin{figure}
\par\includegraphics[width=8.8cm,clip]{1708.f4}
\end{figure}](/articles/aa/full/2003/30/aa1708/img31.gif) |
Figure 4:
Sr surface distribution of |
| Open with DEXTER | |
The surface abundance structure of Mg (Figs. 5 and 6) was determined with the single Mg I
line at 4167 Å and the very prominent Mg II line around 4481 Å. Mg shows a
different behaviour than the other elements and is accumulated like a spotted
ring with four to five enhancement regions in the northern
hemisphere between 0![]() and +60
and +60![]() in latitude.
in latitude.
The structure of the Mg map could also be attributed to the so called "phase
ghosting'' effect. Wrong transition probabilities in the atomic data can lead
an inversion code to produce abundance patches exactly at phasegroups where the star was
observed. However, synthesizing the solar spectrum we did not find indications for a wrong ![]() value for the Mg I 4167 Å line. Thévenin (1989) gives a value of
value for the Mg I 4167 Å line. Thévenin (1989) gives a value of
![]() ,
what is only marginally different from what we used,
,
what is only marginally different from what we used,
![]() .
Furthermore, the Mg map derived from the very prominent Mg II line at
4481 Å with well known transition probabilitites leads to the same surface
abundance structure.
.
Furthermore, the Mg map derived from the very prominent Mg II line at
4481 Å with well known transition probabilitites leads to the same surface
abundance structure.
![\begin{figure}
\par\includegraphics[width=8.8cm,clip]{1708.f5}
\end{figure}](/articles/aa/full/2003/30/aa1708/img35.gif) |
Figure 5: Mg map, obtained with INVERS11 from the Mg I, 4167 Å line. |
| Open with DEXTER | |
![\begin{figure}
\par\includegraphics[width=4.35cm,clip]{1708.f6a}\includegraphics[width=4.35cm,clip]{1708.f6b}
\end{figure}](/articles/aa/full/2003/30/aa1708/img36.gif) |
Figure 6: Sr II ( left, blended with Cr II at 4215 Å) and Mg I, 4167 Å ( right) profiles. |
| Open with DEXTER | |
The maps for Cr and Fe are compared to previously published results and serve as a test for the capability of INVERS11 to reliably reproduce surface abundance structures from blended lines and from data with poor signal-to-noise ratio.
![\begin{figure}
\par\includegraphics[width=8.8cm,clip]{1708.f7}
\end{figure}](/articles/aa/full/2003/30/aa1708/img37.gif) |
Figure 7:
Cr map of |
| Open with DEXTER | |
The surface distribution of Cr (Fig. 7) was first derived from the very
prominent unblended Cr II line at 4558 Å. In a second step three blends with Fe and Ca
at 4526 Å, with Ti from 4563 Å to 4565 Å, and with Ti and Fe from 4588 Å to 4592 Å were mapped
and all revealed the same surface distribution as for the 4558 Å line.
The mean abundance of Cr is -5.7 dex and it is the element with
the strongest surface abundance variation: -5.7 dex and a variation of the
mean of the visible hemisphere of 0.5 dex.
Cr is concentrated in a ring-like structure consisting of a sequence of spots with one big spot
from +30![]() to +60
to +60![]() in latitude and from 315
in latitude and from 315![]() through 0
through 0![]() to
70
to
70![]() in longitude.
in longitude.
Fe maps were derived from unblended Fe lines at 4490 Å, 4520 Å, and
4576 Å (Fig. 8).
One additional map was calculated
taking into account simultaneously all three lines and resulted in the same surface pattern.
The mean abundance of Fe is about -4.65 dex and varies within about
0.2 dex.
Fe shows the same behaviour as Cr and is enhanced in two spots: one at
latitude 0![]() to 30
to 30![]() and longitude between 130
and longitude between 130![]() and 180
and 180![]() .
The other, more prominent spot can be found from
270
.
The other, more prominent spot can be found from
270![]() through 0
through 0![]() to 30
to 30![]() in longitude and 0
in longitude and 0![]() to 40
to 40![]() in
latitude.
Abundance maps using the Cr-Fe-Ca blend at 4526 Å generated by
simultaneously mapping all three elements lead to the same abundance pattern.
in
latitude.
Abundance maps using the Cr-Fe-Ca blend at 4526 Å generated by
simultaneously mapping all three elements lead to the same abundance pattern.
In Fig. 9 the rotationally modulated line profiles of the Cr II, 4558 Å line and the Fe I/ II, 4490 Å line are presented.
![\begin{figure}
\par\includegraphics[width=8.8cm,clip]{1708.f8}
\end{figure}](/articles/aa/full/2003/30/aa1708/img38.gif) |
Figure 8:
The Fe map of |
| Open with DEXTER | |
![\begin{figure}
\par\includegraphics[width=4.35cm,clip]{1708.f9a}\includegraphics[width=4.35cm,clip]{1708.f9b}
\end{figure}](/articles/aa/full/2003/30/aa1708/img39.gif) |
Figure 9:
The Cr II, 4558 Å ( left) and Fe I/ II, 4490 Å ( right) profiles of
|
| Open with DEXTER | |
Ca (Fig. 10) is enhanced between -30![]() and +60
and +60![]() in latitude and
180
in latitude and
180![]() to 360
to 360![]() in longitude.
The surface abundance distribution was calculated using the difficult Cr-Fe-Ca blend
around 4526 Å.
in longitude.
The surface abundance distribution was calculated using the difficult Cr-Fe-Ca blend
around 4526 Å.
In Fig. 11 the rotationally modulated line profiles of the Ca I line at 4526 Å line are presented. As can be seen from the synthetic profiles, the contribution of Ca to this blend is weak. Furthermore, the signal-to-noise ratio of our spectra is rather poor and the blends of Fe and Cr to the Ca line are severe. Nevertheless we find that INVERS11 still allows to use this blend for mapping reasonably well Ca and that, e.g., the Fe map is slightly less noisy, if the Ca surface distribution is taken into account for the mapping procedure.
![\begin{figure}
\par\includegraphics[width=8.8cm,clip]{1708.f10}
\end{figure}](/articles/aa/full/2003/30/aa1708/img40.gif) |
Figure 10:
Ca I distribution on the surface of |
| Open with DEXTER | |
![\begin{figure}
\par\includegraphics[width=5cm,clip]{1708.f11}
\end{figure}](/articles/aa/full/2003/30/aa1708/img41.gif) |
Figure 11:
Ca I profiles of |
| Open with DEXTER | |
Comparing our image of Cr to the ones derived by Hatzes
(1991) and by Rice & Wehlau (1990), we see that they also find a ring of low
abundance tracing the magnetic equator. Two merging spots with high
abundance are located close to the magnetic pole at a radius of about 20![]() .
The spherical projections in both papers are mirror images, but their
similarities are obvious.
Maps of Fe obtained by Rice & Wehlau (1990) show a ring structure centered on the
magnetic pole and a depletion band around the magnetic equator.
Both results agree well with maps based on single lines
and on blends. However, their maps provide more structure than ours what might
be caused by a higher signal-to-noise ratio and spectral resolution of
their observations or by using the MEM regularisation (Tikhonov regularisation was used in our
case, see Appendix).
.
The spherical projections in both papers are mirror images, but their
similarities are obvious.
Maps of Fe obtained by Rice & Wehlau (1990) show a ring structure centered on the
magnetic pole and a depletion band around the magnetic equator.
Both results agree well with maps based on single lines
and on blends. However, their maps provide more structure than ours what might
be caused by a higher signal-to-noise ratio and spectral resolution of
their observations or by using the MEM regularisation (Tikhonov regularisation was used in our
case, see Appendix).
Holmgren & Rice (2000) published a Doppler Image based on Ca II line at 8662 Å. They find a ring like structure along the magnetic equator which is comparable in location with what we found. However, the Ca distribution published here should mainly demonstrate the potential of the new code to derive still reasonable results under demanding spectroscopic conditions (weak component in a complex blend, rather poor spectral resolution and signal-to-noise ratio). The axis of symmetry of the maps of O and Ca derived by Rice et al. (1997) and by Holmgren & Rice (2000) suggest a polar magnetic field region that is more consistent with the Cr and Fe concentrations than the one suggested by our Ca map.
Cr, Fe, and Mn are enhanced in the region of the magnetic poles. Fe has solar abundance and Cr and Mn are overabundant by about 0.8 dex.
Ti, in contrast is accumulated in the region of the magnetic equator. The mean Ti abundance is about 0.3 to 0.5 dex below the solar value.
The Mg distribution does not seem to correlate with
the assumed magnetic field geometry of ![]() UMa (see Sect. 2).
Both lines that were used to derive the surface patches (the Mg I 4167 Å
line and the Mg II line at 4481 Å) reveal the same abundance
pattern. Ca does not seem to be correlated with the magnetic field as well.
UMa (see Sect. 2).
Both lines that were used to derive the surface patches (the Mg I 4167 Å
line and the Mg II line at 4481 Å) reveal the same abundance
pattern. Ca does not seem to be correlated with the magnetic field as well.
Concerning Cr and Fe, which were the elements investigated by
Rice & Wehlau (1990, 1991); Donati et al. (1990) and Hatzes (1991), the
results presented in this paper are in good agreement with previously published maps,
determined with different codes and based on different
observations, proving the reliability of our
method.
In addition to Cr, Fe, Mn, Ti, Sr, Mg and Ca, discussed in this
paper, the map of O was presented by Rice, Wehlau
& Holmgren (1997).
They find a well defined primary belt of O at the magnetic equator region
where abundance is five orders of magnitude higher than in the magnetic polar regions. A secondary
belt of O is tilted by 60![]() to 70
to 70![]() to the first one.
Rice et al. (1997) suggest a chemically differentiated stellar wind being responsible for the O abundance distribution.
to the first one.
Rice et al. (1997) suggest a chemically differentiated stellar wind being responsible for the O abundance distribution.
Applying simple dipolar, quadrupolar or decentered
dipolar fields one would expect, according to Michaud et al. (1981),
abundance patterns on ![]() UMa in terms of rings or of polar caps.
The patchiness of the ring structures and the abundance pattern of Sr
may support a suspicion of Rice &
Wehlau (1990), that the star possesses a more complicated magnetic field
structure.
UMa in terms of rings or of polar caps.
The patchiness of the ring structures and the abundance pattern of Sr
may support a suspicion of Rice &
Wehlau (1990), that the star possesses a more complicated magnetic field
structure.
Michaud et al. (Michaud et al. 1981; Michaud 1993) suggest that the magnetic field affects diffusion of elements such that at low enough pressures ionized elements can diffuse only along magnetic field lines and thus are guided into spots or rings on the stellar surface. Alecian & Vauclair (1981) find that the abundance distribution of, e.g., silicon reflects the magnetic field geometry of a star as well as its evolutionary state. Silicon accumulates where magnetic field lines are horizontal and moves sideways in time scales of 107-109 years where the magnetic field is vertical (horizontal diffusion). Thus in young stars silicon should be concentrated where magnetic field lines are horizontal and in old stars where they are vertical. Ionized iron peak elements may deplete due to weak metal winds at the magnetic polar regions and consequently elements that are lifted by radiative acceleration (Babel 1992, 1995) should be relatively overabundant at the magnetic equator.
![\begin{figure}
\par\includegraphics[width=7.2cm,clip]{1708.f12}
\end{figure}](/articles/aa/full/2003/30/aa1708/img42.gif) |
Figure 12:
Position of |
| Open with DEXTER | |
These predictions, however, are not supported by the surface abundance structure of Fe and Cr
on ![]() UMa, but they are in agreement with
the surface distribution of Fe and Cr for
UMa, but they are in agreement with
the surface distribution of Fe and Cr for ![]() Aur,ET And,
Aur,ET And,
![]() Dra, and CU Vir, all stars mapped by RK (1998, 1999).
The distribution of Ti on the surface of
Dra, and CU Vir, all stars mapped by RK (1998, 1999).
The distribution of Ti on the surface of ![]() UMa is
in good agreement with the predictions of Babel (1992, 1995).
However, a correlation of Ti to the magnetic field structure is not evident for
UMa is
in good agreement with the predictions of Babel (1992, 1995).
However, a correlation of Ti to the magnetic field structure is not evident for
![]() Aur, ET And, and
Aur, ET And, and ![]() Dra (Kuschnig et al. 1999).
Dra (Kuschnig et al. 1999).
Our results for ![]() UMa reveal that Cr and Fe show exactly the opposite correlation
of the surface abundance distribution to the
magnetic field than in the case of the Ap stars CU Vir,
UMa reveal that Cr and Fe show exactly the opposite correlation
of the surface abundance distribution to the
magnetic field than in the case of the Ap stars CU Vir,
![]() Dra, ET And, and
Dra, ET And, and ![]() Aur. For these stars Kuschnig et al.
(1999) found Cr
and Fe to be accumulated at the magnetic equator region and depleted at the poles.
According to the theory, predicting depletion of ionized iron peak elements at the magnetic polar regions due
to weak metal-rich winds (Babel 1992, 1995),
Aur. For these stars Kuschnig et al.
(1999) found Cr
and Fe to be accumulated at the magnetic equator region and depleted at the poles.
According to the theory, predicting depletion of ionized iron peak elements at the magnetic polar regions due
to weak metal-rich winds (Babel 1992, 1995), ![]() UMa should represent a young Ap
star for which this process did not yet significantly affect the elemental surface
distribution. In Fig. 12 the evolutionary status of
UMa should represent a young Ap
star for which this process did not yet significantly affect the elemental surface
distribution. In Fig. 12 the evolutionary status of ![]() UMa and the other stars
discussed in this paper is indicated.
UMa and the other stars
discussed in this paper is indicated. ![]() UMa seems to be among the most evolved Ap stars
and therefore poses a problem for the metal wind concept.
UMa seems to be among the most evolved Ap stars
and therefore poses a problem for the metal wind concept.
This leads to the suspicion that either the field geometry is more complex than anticipated or theory has to be improved.
As for the theory, it works well for other (non-magnetic) stars, but perhaps the interaction
of element diffusion with a magnetic field is more complex and results in complex abundance patterns like in ![]() UMa. Magnetic Doppler Imaging will provide in the future much more reliable answers to these questions.
UMa. Magnetic Doppler Imaging will provide in the future much more reliable answers to these questions.
In any case the results presented in this paper constrain theories concerning diffusion mechanisms in atmospheres of Ap stars in the presence of a magnetic field, particularly because it was possible to map simultaneously several elements which respond differently to a magnetic field.
| Element | CU Vir | |||
| Ti | + | |||
| Cr | - | + | + | + |
| Mn | - | + | ||
| Fe | - | + | + | + |
| Sr | - | + |
![]() UMa hosts presumably a weak dipolar magnetic field that influences
the distribution of elements on the surface. Cr and Fe (according to this
paper and to already published literature) as well as Mn seem to be
accumulated where magnetic field lines are vertical, whereas Ti avoids these
regions and tends to accumulate at the magnetic equator.
Sr shows a similar behaviour as Fe and Cr, but seems to be concentrated only at
one of the magnetic poles. Mg does not show any correlation to the magnetic
field.
Previously published O and Ca maps also show a correlation
of elemental distribution to the orientation of the magnetic field. According
to Babel et al. (1995), Rice et al. (1997), and Holmgren & Rice (2000), O and
Ca are overabundant in a belt at the magnetic equator, whereby
Rice et al. (1997) find an additional slightly enhanced region of O in a belt tilted
to the other one by 60
UMa hosts presumably a weak dipolar magnetic field that influences
the distribution of elements on the surface. Cr and Fe (according to this
paper and to already published literature) as well as Mn seem to be
accumulated where magnetic field lines are vertical, whereas Ti avoids these
regions and tends to accumulate at the magnetic equator.
Sr shows a similar behaviour as Fe and Cr, but seems to be concentrated only at
one of the magnetic poles. Mg does not show any correlation to the magnetic
field.
Previously published O and Ca maps also show a correlation
of elemental distribution to the orientation of the magnetic field. According
to Babel et al. (1995), Rice et al. (1997), and Holmgren & Rice (2000), O and
Ca are overabundant in a belt at the magnetic equator, whereby
Rice et al. (1997) find an additional slightly enhanced region of O in a belt tilted
to the other one by 60![]() to 70
to 70![]() .
.
In the present paper we add abundance distributions of four hitherto not mapped elements and describe a new Doppler Imaging tool, INVERS11, which allows to use blends and data with lower signal-to-noise ratio and spectral resolution. These abilities are demonstrated by comparing our maps with those already published.
A discussion of available maps indicates an inconsistency of some theoretical aspects and observations.
An inhomogeneity on the surface of a star caused by a different abundance or temperature structure than on the average remaining sphere leads to distortions in the spectral line profiles. These features or so called bumps appear on the blue side of the spectrum when the spot comes into sight, moves through the spectral line and disappears on the red wing as the spot rotates out of sight. The longitudinal position of the inhomogeneity can be seen directly, whereas its latitude has to be deduced from spectral time series. Spots at low latitudes appear at the extreme blue, can be seen for half of the rotation phase and disappear again at the extreme red end. Bumps that result from higher latitude spots are visible for a much larger fraction of the rotational period and, after first appearing around the visible pole of the star, only move slightly from red to blue.
In the following we will describe the formalism and theoretical background of Doppler Imaging and the procedure itself. Two different versions of a computer program developed by N. Piskunov, INVERS8 and INVERS11, were applied and compared (a more detailed description of the comparison can be found in Kuschnig 1998).
Earlier versions of our code used pre-computed tables of local line profiles parameterized by the abundance value. This highly efficient method could not be used with INVERS11 because we did not want to restrict the number of chemical elements which could be mapped simultaneously.
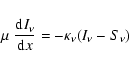
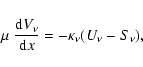
In INVERS11 the equation of radiative transfer is solved in a way that
allows one to calculate maps of several chemical elements simultaneously
and self-consistently.
In this program the pre-calculated local line profile tables are
replaced by the calculation of specific intensities for each visible
surface element on each iteration.
Hence, even spectral line blends can be used to derive the surface abundance
structure of the contributing elements.
To be able to do that efficiently, INVERS11 uses the FEAUTRIER algorithm
(e.g., in Mihalas Stellar Atmospheres) to solve the equation of
radiative transfer. The total radiation is split in the radiation towards the
stellar interior I- and the flow towards the surface I+.
The equation of radiative transfer
 |
(A.1) |
 |
 |
(A.2) |
Detailed tests deriving the surface abundance of the same element from a single, unblended line and from a contribution to a spectral line blend have been performed by Kuschnig (1998) and Lueftinger (2000). The tests confirm that both approaches lead to the same surface pattern, which proves the ability of the INVERS11 code to reliably determine abundance variations of elements contributing to a line blend.
Generally it is possible to derive surface abundances from single blended lines as well as from stretches of a spectrum with multiple blended or unblended lines and reconstruct the distribution of various elements simultaneously, without pre-setting known abundances.
We derived the distribution of Fe and Cr from the same blend, considering Ca homogeneously as well as inhomogeneously distributed (Fig. A.1), and we found no significant differences for the maps. However, a simultaneous mapping of Fe (Fig. A.1, lower left panel) based on all blend components (Fig. 10), compares slightly better to Fig. 8 (Fe map based on three unblended Fe lines) than a map where the variation of the weak Ca blend is ignored (Fig. A.1, lower right panel).
Acknowledgements
The authors express their gratitude to T. Ryabchikova for her very valuable scientific advices.
This research received funding from the "Fonds zur Förderung der wissenschaftlichen Forschung'', Project P14984.
![\begin{figure}
\par\includegraphics[width=8.8cm,clip]{1708.f13}
\end{figure}](/articles/aa/full/2003/30/aa1708/img47.gif)