A&A 406, 667-671 (2003)
DOI: 10.1051/0004-6361:20030789
On the statistical implication of timing noise for pulsar
braking index
A. E. Chukwude1,2
1 - Hartebeesthoek Radio Astronomy Observatory, PO Box 443,
Krugersdorp
1740, South Africa
2 -
Department of Physics & Astronomy, University of Nigeria, Nsukka,
Enugu State, Nigeria
Received 24 February 2003 / Accepted 13 May 2003
Abstract
Timing data on 27 radio pulsars spanning more than 13 years were analysed in
order to investigate the correlations of radio pulsar timing noise (random
fluctuations in the observed pulse phase - RPTN), with the observed
electromagnetic torque braking index (
 ). The results reveal
significant correlations (
). The results reveal
significant correlations ( %) between the statistics used to
parameterize RPTN and the absolute magnitude of the observed second time
derivative of the pulse (rotation) frequency (
%) between the statistics used to
parameterize RPTN and the absolute magnitude of the observed second time
derivative of the pulse (rotation) frequency (
 ).
These correlations, most plausibly, suggest that the observed braking
indices of most pulsars, obtained through the traditional phase-connected
method, are strongly dominated by intrinsic variability in their spin rates.
The implication of this result for a significant measurement of pulsar
systematic frequency second derivative is discussed.
).
These correlations, most plausibly, suggest that the observed braking
indices of most pulsars, obtained through the traditional phase-connected
method, are strongly dominated by intrinsic variability in their spin rates.
The implication of this result for a significant measurement of pulsar
systematic frequency second derivative is discussed.
Key words: methods: statistical - stars: neutron - pulsars: general
Radio pulsars are widely accepted to be rapidly spinning, highly magnetized
neutron stars. The rotational kinetic energy of such stars powers their pulsed
electromagnetic radiation, in addition to accelerating particle winds. In the
standard dipole radiation model, which describes this conversion of rotational
kinetic energy into vacuum magnetic dipole radiation (e.g. Goldreich & Julian 1969),
the braking of an isolated pulsar follows a simple power-law relation of the
form
 |
(1) |
where  is the pulsar rotation frequency,
  is its first
derivative with respect to time, n is the braking index and K is assumed to
be an arbitrary positive constant and depends explicitly on the inertial and
magnetic dipole moments of the neutron star. For the highly simplified model,
in which the pulsar spin-down torque arises solely from magnetic dipole
radiation at the spin frequency, the braking index n = 3. In terms of the
pulsar rotational observables, n is obtained (e.g. Manchester & Taylor 1977) from
is its first
derivative with respect to time, n is the braking index and K is assumed to
be an arbitrary positive constant and depends explicitly on the inertial and
magnetic dipole moments of the neutron star. For the highly simplified model,
in which the pulsar spin-down torque arises solely from magnetic dipole
radiation at the spin frequency, the braking index n = 3. In terms of the
pulsar rotational observables, n is obtained (e.g. Manchester & Taylor 1977) from
 |
(2) |
where
 is the second derivative of the rotation frequency with
respect to time.
is the second derivative of the rotation frequency with
respect to time.
However, long-term timing observations of radio pulsars have revealed enormous
complexities in the true dynamical behaviour of most pulsars. For instance, it
is now widely believed that a variety of rotational irregularities, in the form
of timing noise and glitches - sudden changes (the larger ones exclusively
increases) in the magnitudes of pulsar spin rates - is superimposed on the
systematic pulsar spin down. While glitches have been observed in just a few
radio pulsars (Wang et al. 2000 and references therein), timing noise -
sustained, random fluctuations in the observed pulse phase - is more prevalent
among the known pulsar population (Cordes & Downs 1985,Chukwude 2002,Boynton et al. 1972). In principle, a
qualitative assessment of the level of timing noise activity for a given pulsar
can be obtained from the ("excess'') phase residuals remaining after
accounting for its deterministic spin-down (Cordes & Downs 1985,Cordes 1993,Cordes & Greenstein 1981,D'Alessandro et al. 1995).
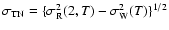
A statistic of importance is the timing noise activity parameter (A) defined,
following Cordes & Downs (1985), as
![\begin{displaymath}A =
\log\left[\frac{\sigma_{{\rm TN}}(m,T)}{\sigma_{{\rm TN}}(m,T)_{{\rm
crab}}}\right],
\end{displaymath}](/articles/aa/full/2003/29/aah4339/img12.gif) |
(3) |
where m is the order of the polynomial fit to the data, T is the time span
of the fit in days,
 is the timing noise contribution
to the gross rms phase residuals, in ms, and
is the timing noise contribution
to the gross rms phase residuals, in ms, and
 is the timing noise of the Crab pulsar in ms, which scales with
T as
is the timing noise of the Crab pulsar in ms, which scales with
T as
 .
The scaling of the Crab pulsar timing noise activity with T is consistent
with frequency noise (Cordes 1993,Cordes 1980,Groth 1975,Cordes & Helfand 1980).
.
The scaling of the Crab pulsar timing noise activity with T is consistent
with frequency noise (Cordes 1993,Cordes 1980,Groth 1975,Cordes & Helfand 1980).
It has now been widely observed (Chukwude 2002,D'Alessandro et al. 1993,Boynton et al. 1972) that the m = 3 polynomial
model appears to describe the observations of most pulsars significantly better than the m = 2 model, in that both
the rms phase residuals and the reduced chi-squares are significantly less
for the third-order model. However, there is still controversy over whether the
m = 3 polynomial models offer a better description of the intrinsic pulsar
spin-down instead of just merely absorbing fluctuations in the pulsar spin rates.
The coefficient of the cubic term obtained from this phase-connected solution
will be referred to throughout this paper as the observed frequency second
derivative (
). In view of the complicated nature
of radio pulsar spin evolution, the observed frequency second derivative can
be expressed as
 |
(4) |
where
 is the contribution from all forms of
fluctuations (including unresolved glitches) in the pulsar rotation rates and
is the contribution from all forms of
fluctuations (including unresolved glitches) in the pulsar rotation rates and
 is the contribution from the intrinsic pulsar torque
braking processes. Assuming 1) that the third-order polynomial is only modelling
the intrinsic pulsar rotation history (
is the contribution from the intrinsic pulsar torque
braking processes. Assuming 1) that the third-order polynomial is only modelling
the intrinsic pulsar rotation history (
 and
and
 )
and 2) the pulsar's spin brakes via purely electromagnetic torques, the
observed frequency second derivative is expected to yield
)
and 2) the pulsar's spin brakes via purely electromagnetic torques, the
observed frequency second derivative is expected to yield
 .
Alternately, if the coefficient of the cubic term merely absorbs
fluctuations in the pulsar spin rates, i.e.
.
Alternately, if the coefficient of the cubic term merely absorbs
fluctuations in the pulsar spin rates, i.e.
 ,
then
,
then
 .
In this case the resulting
would be expected to be highly variable, with the sign of
being either positive or negative, thus yielding anomalous braking indices
(
)
whose absolute values could deviate significantly from
the canonical value of 3. Furthermore, one would expect a significant
correlation between the absolute value of the observed frequency second
derivative (
)
and any statistic used to quantify the
rotational fluctuations which, presumably, would be absorbed by the coefficient
of the cubic term. Accordingly, we define
.
In this case the resulting
would be expected to be highly variable, with the sign of
being either positive or negative, thus yielding anomalous braking indices
(
)
whose absolute values could deviate significantly from
the canonical value of 3. Furthermore, one would expect a significant
correlation between the absolute value of the observed frequency second
derivative (
)
and any statistic used to quantify the
rotational fluctuations which, presumably, would be absorbed by the coefficient
of the cubic term. Accordingly, we define
 |
(5) |
as a statistical measure of the amount of phase fluctuations absorbed by the
coefficient of the cubic term, where
 and
and
 are the rms phase residuals obtained from second- and third-order
polynomials, respectively, fitted over a time span T. Currently, there appears
to be some consensus that the observed
for most pulsars is
severely biased by fluctuations of timing noise origin, a situation which
precludes significant measurements of n for most radio pulsars (Baykal et al. 1999; Johnston & Galloway 1999). However, the exact form of the
dependence of n on radio pulsar timing noise is not yet well understood.
are the rms phase residuals obtained from second- and third-order
polynomials, respectively, fitted over a time span T. Currently, there appears
to be some consensus that the observed
for most pulsars is
severely biased by fluctuations of timing noise origin, a situation which
precludes significant measurements of n for most radio pulsars (Baykal et al. 1999; Johnston & Galloway 1999). However, the exact form of the
dependence of n on radio pulsar timing noise is not yet well understood.
In this paper, radio timing data on 27 pulsars, collected at Hartebeesthoek
Radio Astronomy Observatory (HartRAO), are analysed in order to investigate the
forms of statistical dependence of
on the observed
timing noise activity, as parameterized by the statistics A and
 .
.
Timing observations of radio pulsars at Hartebeesthoek Radio Astronomy
Observatory in South Africa commenced 1984 and are still on-going at the time
of this writing. However, continuous pulsar observations were interrupted
between June 1999 and December 2000. Consequently, the data reported here
are those accumulated between January 1984 and May 1999. Observations were made
at regular intervals of  14 days at either 1668 or 2272 MHz using the
26-m HartRAO radio telescope. Pulses were recorded through a single 10 MHz
bandwidth receiver at both frequencies and no pre-detection dedispersion
hardware was available. Detected pulses were smoothed with an appropriate time
constant, and integrated over
14 days at either 1668 or 2272 MHz using the
26-m HartRAO radio telescope. Pulses were recorded through a single 10 MHz
bandwidth receiver at both frequencies and no pre-detection dedispersion
hardware was available. Detected pulses were smoothed with an appropriate time
constant, and integrated over
 consecutive rotation periods,
where
is different for different pulsars. Integration
commenced at a particular second via synchronization to the station clock, which
is derived from a hydrogen maser and is referenced to UTC via GPS.
consecutive rotation periods,
where
is different for different pulsars. Integration
commenced at a particular second via synchronization to the station clock, which
is derived from a hydrogen maser and is referenced to UTC via GPS.
All topocentric arrival times obtained at HartRAO were transformed to infinite
observing frequency at the Solar System Barycenter (SSB) using the Jet Propulsion
Laboratory DE200 solar system ephemeris and the TEMPO software package
(http://pulsar.princeton.edu/tempo). The barycentric arrival times were
subsequently modelled using the HartRAO in-house timing analysis software,
which is based on the standard pulsar timing technique of Manchester & Taylor
(1977) as described in Flanagan (1995). The time evolution of the rotational
phase of a non-binary pulsar (when corrected to the SSB) can be approximated
by a polynomial of the form (Lyne & Graham-Smith 1998):
 |
(6) |
where
 is the phase at an arbitrary time epoch
 ,
,
and
are the rotation
frequency, and its first and second time derivatives, respectively.
In practice, for sufficiently accurate values of ,
and
,
Eq. (3) can be used to predict the phase/(Barycentric
time of pulse peak arrival, BTOA) of a given pulsar at/(very near) any
time t. The phase residuals,
,
,
and
are the rotation
frequency, and its first and second time derivatives, respectively.
In practice, for sufficiently accurate values of ,
and
,
Eq. (3) can be used to predict the phase/(Barycentric
time of pulse peak arrival, BTOA) of a given pulsar at/(very near) any
time t. The phase residuals,
 for
for
 where N is the number of observations for a given pulsar, are given
by the difference between the observed and predicted BTOA's.
are used to calculate the root-mean-square phase residuals
where N is the number of observations for a given pulsar, are given
by the difference between the observed and predicted BTOA's.
are used to calculate the root-mean-square phase residuals
 (where, e.g., m = 2 is order of the polynomial) and the rms "white
noise"
(where, e.g., m = 2 is order of the polynomial) and the rms "white
noise"
 ,
following Cordes & Downs (1985). Pulse-to-pulse phase jitter, measurement uncertainty, and other effects that fluctuate
on much shorter timescales (<1 day), all contribute to the
white noise component. The rms timing noise
,
following Cordes & Downs (1985). Pulse-to-pulse phase jitter, measurement uncertainty, and other effects that fluctuate
on much shorter timescales (<1 day), all contribute to the
white noise component. The rms timing noise
 is
calculated as:
is
calculated as:
 .
.
Table 1:
Results of the second- and third-order polynomial fits to
the 27
HartRAO pulsars.
The results of the data analysis for 27 HartRAO pulsars are summarized in Table 1.
Column 1 lists the name of the pulsar, using the B1950.0 naming convention;
Cols. 2 and 3, respectively, give the rms phase residuals from m = 2
and 3 polynomial models; Col. 4 lists the timing noise statistic
;
Col. 5 shows the ratio of the reduced chi-squares
of the second- and third-order polynomial fits to the data
(
 ); Col. 6 contains the
timespan of the observations; Cols. 7 and 8 give the resulting frequency
second time derivative and its associated formal standard error; while Col. 9
gives the value expected from the simple spin-down law (
); Col. 6 contains the
timespan of the observations; Cols. 7 and 8 give the resulting frequency
second time derivative and its associated formal standard error; while Col. 9
gives the value expected from the simple spin-down law (
 ), assuming n = 3; Col. 10 lists the observed
braking index (
), assuming n = 3; Col. 10 lists the observed
braking index (
 )
and Col. 11 gives the timing noise activity parameter (A).
The results, among other things, show that the observed frequency second
derivative (
)
is highly variable: being negative
for 13 pulsars and positive for 14 objects. Furthermore,
)
and Col. 11 gives the timing noise activity parameter (A).
The results, among other things, show that the observed frequency second
derivative (
)
is highly variable: being negative
for 13 pulsars and positive for 14 objects. Furthermore,
 in most cases deviates from the expected value of 3 by several orders
of magnitude. As a consequence, the inferred braking indices (
)
have values ranging from -105 to +104. This result is consistent
with the measured
being severely contaminated by
random steps in .
Assuming that the amplitudes of these steps have
nonzero mean (Cordes & Helfand 1980) and consequently could introduce a positive or
negative bias to the observed frequency second derivative (
), one would expect that
will be strongly correlated with the timing noise statistics (A and
).
in most cases deviates from the expected value of 3 by several orders
of magnitude. As a consequence, the inferred braking indices (
)
have values ranging from -105 to +104. This result is consistent
with the measured
being severely contaminated by
random steps in .
Assuming that the amplitudes of these steps have
nonzero mean (Cordes & Helfand 1980) and consequently could introduce a positive or
negative bias to the observed frequency second derivative (
), one would expect that
will be strongly correlated with the timing noise statistics (A and
).
Figure 1 plots the timing noise statistic
against
(Fig. 1a) the absolute magnitude of the observed frequency second derivative
(
), and (Fig. 1b) the expected frequency second
derivative from the standard spin-down model (
),
both on the log-log scale. Similarly, Fig. 2a plots the timing noise activity
parameter (A) against
 ,
while Fig. 2b plots
A against
.
As expected, Figs. 1b and 2b reveal
no apparent correlations between the two timing noise statistics and the secular
frequency second derivative (
). However, Fig. 1a
shows a clearly defined trend in which objects with large
are characterized by large
.
Figure 2a also shows a similar trend between A and
.
Simple least squares analyses of the current HartRAO data show that the absolute
magnitude of the observed frequency second derivative is significantly
correlated with the timing noise statistics. In particular, we obtain r =
+0.95 and +0.90, respectively, as the correlation coefficients between
,
while Fig. 2b plots
A against
.
As expected, Figs. 1b and 2b reveal
no apparent correlations between the two timing noise statistics and the secular
frequency second derivative (
). However, Fig. 1a
shows a clearly defined trend in which objects with large
are characterized by large
.
Figure 2a also shows a similar trend between A and
.
Simple least squares analyses of the current HartRAO data show that the absolute
magnitude of the observed frequency second derivative is significantly
correlated with the timing noise statistics. In particular, we obtain r =
+0.95 and +0.90, respectively, as the correlation coefficients between
 and
and between
A and
(where
is in units of 10-25 Hz/s-2). On the other hand, similar analysis
reveals no appreciable correlation between the timing noise statistics and
the predicted frequency second derivative. More quantitatively, we estimated
and
and between
A and
(where
is in units of 10-25 Hz/s-2). On the other hand, similar analysis
reveals no appreciable correlation between the timing noise statistics and
the predicted frequency second derivative. More quantitatively, we estimated
 and 0.1 as the correlation coefficients between A and
 and
and
,
respectively.
and
and
,
respectively.
![\begin{figure}
\par\includegraphics[width=7.2cm,clip]{H4339F1.PS}
\end{figure}](/articles/aa/full/2003/29/aah4339/Timg52.gif) |
Figure 1:
Plots showing the relationship between the logarithm of the timing
noise parameter (
), obtained as described in text,
and the logarithms of a) the absolute magnitude of the observed frequency
second derivative (
)
and b) the model-predicted
frequency second derivative (
)
for the current 27
HartRAO pulsars.
|
| Open with DEXTER |
![\begin{figure}
\par\includegraphics[width=7.2cm,clip]{H4339F2.PS}
\end{figure}](/articles/aa/full/2003/29/aah4339/Timg53.gif) |
Figure 2:
VPlots showing the relationship between the activity parameter A
and the logarithms a) the absolute magnitude of the observed frequency
second derivative (
)
and b) the expected
frequency second derivative (
)
for the current
HartRAO pulsars.
|
| Open with DEXTER |
Significant measurements of the braking index (n) of radio pulsars are
essential in order to constrain the mechanism of angular momentum loss from
the spinning neutron stars. However, after more than 3 decades of timing
observations of radio pulsars, n has been significantly measured for only
about five pulsars (Manchester et al. 1985,Zhang et al. 2001,Camilo et al. 2000,Lyne et al. 1996,Lyne & Pritchard 1988). In the context of the
standard model, Eq. (1) suggests that the braking index explicitly depends on
three pulsar observables - the rotation frequency (), and its first and second
derivatives (
and
)
respectively. While
and
are relatively easy to measure (giving timing data that span a few
hundreds of days), a number of factors have combined to make significant
measurement of
as related to the braking index n in Eq. (2)
difficult, or impossible in most cases. For instance, assuming that all isolated
pulsars strictly obey the simple spin-down law (Eq. (1)), the expected secular
would be extremely small for most pulsars. For a
typical middle-aged radio pulsar characterized by  Hz and
 Hz/s, the expected frequency second derivative (
)
is 10-30 Hz/s2 (assuming a canonical value of n =
3). Table 1 shows that
Hz/s, the expected frequency second derivative (
)
is 10-30 Hz/s2 (assuming a canonical value of n =
3). Table 1 shows that
 for the 27 HartRAO
pulsars, which is too small to be significantly measured even with timing data
that span some hundreds of years.
for the 27 HartRAO
pulsars, which is too small to be significantly measured even with timing data
that span some hundreds of years.
However, given the prevalence of timing noise activity in radio pulsars and
the fact that the statistics of radio pulsar timing noise have been shown
(Cordes & Downs 1985,Chukwude 2002) to be non-stationary: implying that its effects increase
with the time span of observations, it becomes difficult to see how such a long
span of observations could really help in measuring these extremely small
systematic
's. The prevailing picture is that timing noise
fluctuations in the pulsar rotation rates seriously contaminate the observed
coefficient of the cubic term,
,
in most pulsars.
In particular, Cordes & Helfand (1980) have noted that timing noise
activity-dominated
(i.e.
)
would be random in nature, with either sign, and
would be characterized by
 .
Our results show that the observed frequency second derivative
(
)
for the current HartRAO sample is positive for
14 pulsars and negative for 13 pulsars and that
.
Our results show that the observed frequency second derivative
(
)
for the current HartRAO sample is positive for
14 pulsars and negative for 13 pulsars and that
 .
Accordingly, the inferred braking indices
vary over a wide range,
.
Accordingly, the inferred braking indices
vary over a wide range,
 .
Physical
interpretation of this result is not immediately obvious. Even the moderate
positive braking indices of 6.5 and 5.1 obtained, respectively, for the
pulsars B0450-18 and B1727-47 are still too high to be associated to pulsar
torque braking processes, unless the
is significantly
contaminated by recovery of
from unresolved glitch events. Even
though anomalous positive braking indices observed in a few young/middle-aged
pulsars (Shemar & Lyne 1996) have been plausibly explained as characteristics of
interglitch recovery in these objects (Alpar 1998), negative braking indices
are still difficult to understand in context of the prevailing picture of
radio pulsar spin evolution. Using a method that negates the measurement of
frequency second derivative, Johnston & Galloway (1999) have argued that large
negative braking indices could be attributed to glitches occurring in between
the epochs of the timing solution. However, no resolved glitch events have
been reported in the present data, suggesting that the speculated influence
of glitches on the observed braking indices is minimal at best.
.
Physical
interpretation of this result is not immediately obvious. Even the moderate
positive braking indices of 6.5 and 5.1 obtained, respectively, for the
pulsars B0450-18 and B1727-47 are still too high to be associated to pulsar
torque braking processes, unless the
is significantly
contaminated by recovery of
from unresolved glitch events. Even
though anomalous positive braking indices observed in a few young/middle-aged
pulsars (Shemar & Lyne 1996) have been plausibly explained as characteristics of
interglitch recovery in these objects (Alpar 1998), negative braking indices
are still difficult to understand in context of the prevailing picture of
radio pulsar spin evolution. Using a method that negates the measurement of
frequency second derivative, Johnston & Galloway (1999) have argued that large
negative braking indices could be attributed to glitches occurring in between
the epochs of the timing solution. However, no resolved glitch events have
been reported in the present data, suggesting that the speculated influence
of glitches on the observed braking indices is minimal at best.
A much more plausible interpretation of the current results can be obtained
if one assumes that the observed frequency second derivatives (
), at least for the current data, are composed of two components:
a secular component (
)
and a component arising from
an accumulation of fluctuations in the pulsar spin rates
(
). The most probable scenario is that the timing
noise component strongly dominates over the secular component (i.e.
 ), hence it is
reasonable to argue that the
listed in Table 1
are merely manifestations of timing noise activity rather than due to an
intrinsic pulsar torque braking process.
), hence it is
reasonable to argue that the
listed in Table 1
are merely manifestations of timing noise activity rather than due to an
intrinsic pulsar torque braking process.
Perhaps the strongest observational evidence for the timing noise interpretation
of the
could be found in the observed strong
correlations between the two timing noise statistics - the activity parameter
A (a qualitative measure of the fluctuations in the pulsar rotation rates due
to timing noise activity) and
(a measure of the amount
of timing noise absorbed by the coefficient of cubic the term) - and
.
In principle, if the large
are mainly due to the inadequacy of a second-order
model and a third-order model simply provides a better description of the
intrinsic pulsar rotational history, one would expect no significant correlation
between
and the resulting coefficient of the cubic
term (
), as was observed for
.
However, the fact that there exists a
significant correlation,
 ,
between them suggests that the
,
even if it contains a secular component, is
strongly dominated by the timing noise components in the data. Hence, as would
be expected, the larger the amount of fluctuations absorbed by the cubic
polynomial (
)
the more the absolute magnitudes of the
resultant
are biased to higher values. Similarly,
the equally strong correlation between A and
further supports the timing noise interpretation of the observed frequency
second derivatives. The
,
between them suggests that the
,
even if it contains a secular component, is
strongly dominated by the timing noise components in the data. Hence, as would
be expected, the larger the amount of fluctuations absorbed by the cubic
polynomial (
)
the more the absolute magnitudes of the
resultant
are biased to higher values. Similarly,
the equally strong correlation between A and
further supports the timing noise interpretation of the observed frequency
second derivatives. The
 correlation
suggests that pulsars characterized by higher level of timing noise activity,
on average, have larger absolute values of frequency second derivative.
correlation
suggests that pulsars characterized by higher level of timing noise activity,
on average, have larger absolute values of frequency second derivative.
The obvious implication of the current results is that the secular braking
index, even when it exists, may never be measurable for most pulsars
(especially those with moderate and small values of )
because of
the strong dominant effect of rotational fluctuations in the form of timing
noise activity. Moreover, the argument that significant measurements of
for middle-aged and old pulsars would require a very long
timespan of observations appears weakened by the observed correlations.
As a consequence, future efforts at measuring the braking indices of radio
pulsars, especially methods that aim at minimizing the effect of timing noise,
would have to explore alternative techniques to the conventional phase-connected
solution of observations spanning decades in time. However, phase-connected
solutions of timing data could still be important in measuring systematic
frequency second time derivative if there is a realistic method of modelling
out the timing noise component from the secular component of
.
We have investigated the statistical implication of long-term intrinsic
fluctuations in the rotation of radio pulsars for the observed braking
index. The result reveals that the observed frequency second derivative is
strongly correlated with the statistics used to quantify fluctuations of timing
noise origin. This, most probably, suggests that significant measurement of the
secular component of the frequency second derivative in the presence of radio
pulsar timing noise could be very difficult, if not impossible, for most
(especially the old and middle-aged) pulsars owing to the dominant presence
of the timing noise component of
.
Acknowledgements
I am very grateful to G. D. Nicolson, the director of HartRAO, and
C. S. Flanagan for providing me with the pulsar data, J. O. Urama
and A. A. Ubachukwu for very helpful discussions, M. J. Gaylard for critically
reading through the manuscript and an anonymous referee for useful comments
which helped to improve the paper. This work was done while the author was in
HartRAO as a visiting research student and he has the pleasure to acknowledge
the support and hospitality of HartRAO staff. IAU Commission 38 supported the
visit to South Africa with a travel grant.
- Alpar, M. A. 1998, Adv. Space. Res., 21, 159
In the text
NASA ADS
- Baykal, A., Alpar M. A., Boynton, P.
E., & Deeter, J. E. 1999, MNRAS, 306, 207
NASA ADS
- Boynton, P. E., Groth, E. J., Hutchinson,
D. P., et al. 1972, ApJ, 175, 217
In the text
NASA ADS
- Camilo, F., Kaspi, V. M., Lyne, A. G.,
et al. ApJ, 541, 367
In the text
NASA ADS
- Chukwude, A. E. 2002, Ph.D. Thesis, University
of Nigeria, Nsukka
In the text
- Cordes, J. M. 1993, in Planets
Around Pulsars, ed. J. A. Phillips, S. E. Thorsett, & S. R. Kulkarni (San
Francisco: ASP), ASP Conf. Ser., 36, 43
In the text
- Cordes, J. M. 1980, ApJ, 237, 216
In the text
NASA ADS
- Cordes, J. M., & Downs, G. S. 1985, ApJS,
59, 343
In the text
NASA ADS
- Cordes, J. M., & Helfand, D. J. 1980,
ApJ, 239, 640
In the text
NASA ADS
- Cordes, J. M., & Greenstein, G.
1981, ApJ, 245, 1060
In the text
NASA ADS
- D'Alessandro, F., McCulloch, P. M.,
Hamilton, P. A., & Deshpande, A. A. 1995, MNRAS, 277, 1033
In the text
NASA ADS
- D'Alessandro, F., McCulloch, P.
M., Hamilton, P. A., & McConnell, D. 1993, MNRAS, 261, 883
In the text
NASA ADS
- Goldreich, P., & Julian, W. H. 1969,
ApJ, 157, 869
In the text
NASA ADS
- Flanagan, C. S. 1995, Ph.D. Thesis, Rhodes
University, Grahamstown, South Africa
- Groth, E. J. 1975, ApJS, 29, 443
In the text
NASA ADS
- Lyne, A. G., & Graham-Smith, F. 1998,
Pulsar Astronomy (Cambridge University Press)
In the text
- Lyne, A. G., & Pritchard, R. S. 1988,
MNRAS, 233, 667
In the text
NASA ADS
- Lyne, A. G., Pritchard, R. S., Graham-Smith,
F., & Camilo, F. 1996, Nature, 381, 497
In the text
NASA ADS
- Manchester, R. N., Durdin, J. M., &
Newton, L. M. 1985, Nature, 313, 31
In the text
- Manchester, R. N., & Taylor, J. H.
1977, Pulsars (San Francisco: Freeman)
In the text
- Shemar, A. L., & Lyne, A. G. 1996, MNRAS,
282, 677
In the text
NASA ADS
- Wang, N., Manchester, R. N., Pace, R. T.
et al. 2000, MNRAS, 317, 843
NASA ADS
- Zhang, W., Marshall, F. E., Gotthelf, E. V.,
Middleditch, J., & Wang, Q. D. 2001, ApJ, 554, L177
In the text
NASA ADS
Copyright ESO 2003
![\begin{figure}
\par\includegraphics[width=7.2cm,clip]{H4339F1.PS}
\end{figure}](/articles/aa/full/2003/29/aah4339/img52.gif)
![\begin{figure}
\par\includegraphics[width=7.2cm,clip]{H4339F2.PS}
\end{figure}](/articles/aa/full/2003/29/aah4339/img53.gif)