A&A 406, 265-271 (2003)
DOI: 10.1051/0004-6361:20030745
A. Frankowski
Nicolaus Copernicus Astronomical Center, Polish Academy of Sciences, Rabianska 8, 87-100 Torun, Poland
Received 9 October 2002 / Accepted 13 May 2003
Abstract
A synthetic method for tracing the evolution
of the post-AGB stars, based on existing numerical calculations,
is presented.
The main advantage of this procedure, based on the
published numerical evolutionary sequences, is that it is simple, fast, and
allows to treat post-AGB objects of arbitrary mass.
Key words: stars: evolution - stars: AGB and post-AGB
Evolution of low- and intermediate-mass stars, considering their
high abundance in stellar populations, is
an important factor for the evolution of whole galaxies. Late stages of this
evolution, associated with intense mass loss,
are of particular interest, especially a transition from an
inflated red giant of the Asymptiotic Giant Branch (AGB)
to the hot compact core of a Planetary Nebula (PN).
After climbing up to the tip of the Asymptotic Giant
Brach and losing most of its hydrogen-rich envelope due to a copious wind
(
![]() /yr),
a star proceeds almost horizontally on the Hertzsprung-Russell diagram to the
Planetary Nebula (PN) region.
When the effective temperature reaches
/yr),
a star proceeds almost horizontally on the Hertzsprung-Russell diagram to the
Planetary Nebula (PN) region.
When the effective temperature reaches ![]()
![]() K, high
energy photons emanating from the star ionize the previously ejected
envelope - there appears a PN around the star and the Planetary Nebula
Nucleus (PNN) stage begins.
K, high
energy photons emanating from the star ionize the previously ejected
envelope - there appears a PN around the star and the Planetary Nebula
Nucleus (PNN) stage begins.
A relatively
short (
103-104 yrs) phase between AGB and PNN is called post-AGB
or Proto-Planetary Nebula (PPN) phase. In this short time the stellar mass
loss rate drops by several orders of magnitude. The wind gradually loses its
dominant evolutionary role and is overcome by the thermonuclear reactions
rate. The final mass of the star becomes fixed from now on - it will not
change during later evolutionary phases.
The structure of a post-AGB object is more or less onion-like. There
is a compact CO core (with a radius of ![]()
![]() )
surrounded
by a thin He layer with the H-burning shell on its top.
(If the post-AGB phase coincides with the last thermal
pulse, nuclear reactions take place at the bottom of the He layer,
with the H shell being inactive).
All this is in turn
embedded within a diluted H-rich envelope (shrinking from
)
surrounded
by a thin He layer with the H-burning shell on its top.
(If the post-AGB phase coincides with the last thermal
pulse, nuclear reactions take place at the bottom of the He layer,
with the H shell being inactive).
All this is in turn
embedded within a diluted H-rich envelope (shrinking from ![]()
![]() at the end of AGB to
at the end of AGB to ![]()
![]() at the beginning
of the PNN phase). Then there is a stellar wind still emanating from the
star and expanding shells of AGB matter even further from the center.
The evolution of a post-AGB
object is a sum of two processes: the evolution of the star, which is to
become a Planetary Nebula Nucleus, and the evolution of an expanding
proto-nebula, consisting of the matter expelled while on the AGB.
The evolution of the star itself is rather independent of the proto-nebula
state, but the reverse is not true: the development of the proto-nebula
is significantly affected by the evolving central star characteristics.
Hence, the evolution of the PPN's central star can be studied separately
and then treated as an external input parameter for evolutionary
calculations of the nebula. A reasonable description of the central star
evolution is a necessary condition for a credible simulation
of evolution of the entire post-AGB object.
at the beginning
of the PNN phase). Then there is a stellar wind still emanating from the
star and expanding shells of AGB matter even further from the center.
The evolution of a post-AGB
object is a sum of two processes: the evolution of the star, which is to
become a Planetary Nebula Nucleus, and the evolution of an expanding
proto-nebula, consisting of the matter expelled while on the AGB.
The evolution of the star itself is rather independent of the proto-nebula
state, but the reverse is not true: the development of the proto-nebula
is significantly affected by the evolving central star characteristics.
Hence, the evolution of the PPN's central star can be studied separately
and then treated as an external input parameter for evolutionary
calculations of the nebula. A reasonable description of the central star
evolution is a necessary condition for a credible simulation
of evolution of the entire post-AGB object.
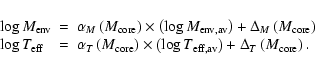
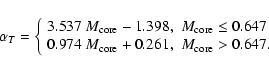
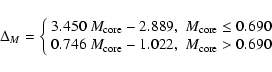
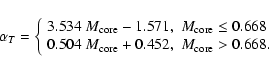
The course of the post-AGB phase depends on the mass loss rate variations - how the wind depends on other stellar parameters and how rapidly it drops. However, the stellar wind evolution is hard to study (observationally - because the phase is short and hence objects are not very abundant, and theoretically - because the physical mechanisms driving the mass loss at AGB and post-AGB stages are only roughly known, and there is no consistent, credible model as yet). In the numerical models of the stellar evolution, the AGB to PNN transition is covered by semi-empirical analytical wind formulae, that are devised to produce mass loss rate just somewhere in-between the strong AGB wind and the much weaker PNN wind, with no firm calibration.
Not surprisingly, the post-AGB stage of stellar evolution is recently a subject of intense studies - both observational and theoretical. Since a pioneering work of Paczynski (1971), numerous studies on this topic have been presented (e.g. Härm & Schwarzschild 1975; Schönberner 1979, 1981, 1983; Iben et al. 1983; Iben 1984; Kwok 1993; Vassiliadis & Wood 1993, 1994; Blöcker 1995; Stanghellini & Renzini 2000; Marigo et al. 2001). Various aspects of the post-AGB evolution are extensively discussed in Szczerba & Górny (2001). For a general review on AGB, post-AGB and PNN phases the reader can consult Iben & Renzini (1983) and Kwok (2000). Unfortunately, despite this effort, there exist only few detailed, time-dependent, numerical models of a star evolving through this transient phase between AGB and PN stages. There are two published sets of post-AGB data from full evolutionary calculations: one consists of results of Schönberner (1981, 1983) and Blöcker (1995) (hereafter BS) and second is from Vassiliadis & Wood (1993, 1994 hereafter VW) models. The VW results have been published for a more extensive grid of stellar parameters and are more reliable at the low-temperature region of late AGB phase (due to newer opacity tables used). However, their description of the mass loss rate evolution with stellar parameters seems to be less adequate. Abrupt switching from AGB wind to PNN wind in a quite arbitrarily choosen point causes the VW models to stay too long in the low effective temperature region (eg. Tylenda & Stasinska 1994). A nice idea would be to mix somehow VW models with Blöcker's (or some other) wind description.
Both BS and VW models are calculated only for a very limited number of progenitor masses and for a specific mass loss description preferred by the authors. The main reason for this situation is the complexity of the problem and high computational cost of such modelling. But in some applications, e.g. in the population synthesis, it is essential to trace post-AGB evolution of many objects of different initial mass. This means that a fast, synthetic method of calculating the post-AGB evolution is needed.
Such methods in context of "post-AGB" evolution have been developed by
Stanghellini & Renzini (2000) and by Marigo et al. (2001), but
both groups
use the term "post-AGB" in a broad sense, i.e. for all stages following the AGB, and focus in fact on the PN phase. Accordingly, in both papers the
modelling starts from the point where
![]() .
"Post-AGB" defined as the transition phase from AGB to PN is not covered by
their synthetic tracks.
.
"Post-AGB" defined as the transition phase from AGB to PN is not covered by
their synthetic tracks.
Another method, focused mainly on this transition phase, is set forth in the present paper. The idea is to construct a synthetic relation between H-rich envelope mass and effective temperature, parametrized by the CO core mass. This synthetic relation is calibrated by fitting analytical expressions to the grid of detailed numerical tracks. The main advantage of the proposed procedure is that it allows to treat post-AGB objects of arbitrary mass without excessive numerical costs. Preliminary results of this study have been presented in Frankowski (2003).
In Sect. 2, the general concept of the method along with its theoretical background is described. Putting VW evolutionary tracks into this scheme in Sect. 3 results in synthetic models of post-AGB stellar evolution for two metallicities (solar and SMC). Discussion and conclusions follow in Sect. 4.
Paczynski (1971) has shown that the evolution of a star transiting
from a red giant to planetary nebula (PN) stage can be conveniently
presented on a diagram displaying the hydrogen-rich envelope mass vs. the
effective temperature.
The
![]() diagram has later been used to describe
the
post-AGB behavior by Schönberner (1981, 1983) and Blöcker
(1995).
diagram has later been used to describe
the
post-AGB behavior by Schönberner (1981, 1983) and Blöcker
(1995).
On such a diagram a star spends its AGB phase in the low temperature, high envelope mass region, with the effective temperature generally decreasing as the envelope mass decreases. The departure from the AGB begins when this trend is reversed. Then, the post-AGB phase shows up as a sharply downward and then a quasi-horizontal line, going from low to high effective temperatures with decreasing envelope mass. Some noise to this general tendency is introduced by He shell flashes (thermal pulses) - and if a He-flash occurs at or near the horizontal part of the relation, the picture is noticeably distorted. This case will not be considered in detail here. The simple method proposed in this paper is not suitable for modelling He-flash events, due to their non-equilibrium nature. In the available post-AGB evolutionary tracks there are also too few data to allow any systematical analysis of the stable He burning periods, that follow the flashes. Stable He burning does not usually last long and only one track in the VW dataset features stable He burning from AGB, through post-AGB and PN to the point where nuclear reactions cease. For these reasons, only H-burning post-AGB evolution can be considered within the proposed model.
At
![]() K the stellar
radiation starts to ionize the previously ejected matter and a PN is formed.
When the nuclear reactions in the H-burning shell finally
extinguish, the temperature stops rising and object enters the white dwarf
cooling track. This last part is,
however,
beyond the scope of the present work.
An example of a
K the stellar
radiation starts to ionize the previously ejected matter and a PN is formed.
When the nuclear reactions in the H-burning shell finally
extinguish, the temperature stops rising and object enters the white dwarf
cooling track. This last part is,
however,
beyond the scope of the present work.
An example of a
![]() vs.
vs.
![]() diagram resulting from
detailed, numerical calculations of Vassiliadis & Wood (1993,
1994)
is shown in Fig. 1, together with arrows and labels indicating the
evolutionary stages.
diagram resulting from
detailed, numerical calculations of Vassiliadis & Wood (1993,
1994)
is shown in Fig. 1, together with arrows and labels indicating the
evolutionary stages.
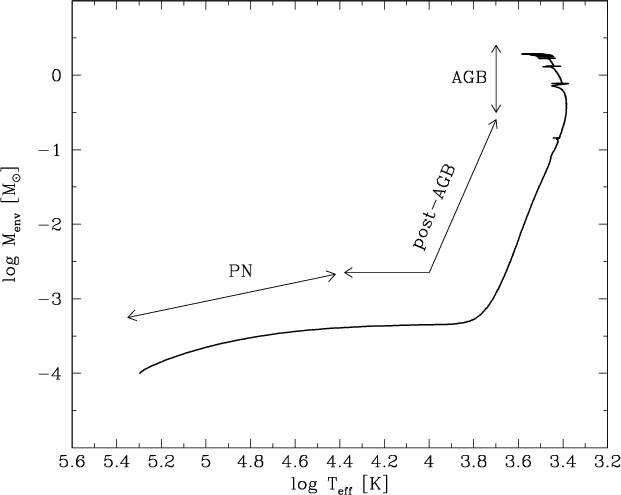 |
Figure 1:
The
|
| Open with DEXTER | |
The post-AGB phase is relatively short (![]() 104 yrs) and proceeds
at nearly constant CO core mass (and, unless a shell flash occurs, also at
almost constant luminosity). In this
short time the mass of the hydrogen-rich envelope is reduced by orders of
magnitude and the effective temperature increases dramatically.
Hence, the
104 yrs) and proceeds
at nearly constant CO core mass (and, unless a shell flash occurs, also at
almost constant luminosity). In this
short time the mass of the hydrogen-rich envelope is reduced by orders of
magnitude and the effective temperature increases dramatically.
Hence, the
![]() vs.
vs.
![]() relation can be treated - at
least in the post-AGB phase - as characterized by a specific CO core mass,
relation can be treated - at
least in the post-AGB phase - as characterized by a specific CO core mass,
![]() .
It is the core mass that determines the position and shape of the
stellar track on the
.
It is the core mass that determines the position and shape of the
stellar track on the
![]() vs.
vs.
![]() diagram.
diagram.
![]() governs also the stellar luminosity
(Paczynski 1970; Uus 1970).
governs also the stellar luminosity
(Paczynski 1970; Uus 1970).
These facts were used to construct a
![]() -parametrized synthetic
-parametrized synthetic
![]() relation that allows to trace the evolution
of a H-burning post-AGB object of arbitrary core mass. When accompanied
with a mass loss rate formula
and the H burning rate,
this relation gives also the time evolution of the stellar
parameters in this phase.
relation that allows to trace the evolution
of a H-burning post-AGB object of arbitrary core mass. When accompanied
with a mass loss rate formula
and the H burning rate,
this relation gives also the time evolution of the stellar
parameters in this phase.
The procedure of constructing this synthetic relation was as follows.
First, note that the general shape of the
![]() relation is fairly similar for all the computed models, not only in the
almost horizontal part, but also in the relatively cool, early phase of
departure from the AGB stage, when
relation is fairly similar for all the computed models, not only in the
almost horizontal part, but also in the relatively cool, early phase of
departure from the AGB stage, when
![]() rises only slowly
with decreasing envelope mass. Even stars suffering a late thermal pulse,
before and after this event behave in a way very similar to the non
flashing objects. This fact allows to use all the VW tracks in the
constuction of the synthetic model (although the resulting synthetic
evolution will not be able to reproduce late He-flashes).
Main difference between the tracks is their
position on the
rises only slowly
with decreasing envelope mass. Even stars suffering a late thermal pulse,
before and after this event behave in a way very similar to the non
flashing objects. This fact allows to use all the VW tracks in the
constuction of the synthetic model (although the resulting synthetic
evolution will not be able to reproduce late He-flashes).
Main difference between the tracks is their
position on the
![]() plane. This is illustrated in
Fig. 2, displaying
plane. This is illustrated in
Fig. 2, displaying
![]() diagrams for
solar metallicity VW tracks of
diagrams for
solar metallicity VW tracks of
![]() ,
and
,
and
![]() (having, when on post-AGB,
core masses
(having, when on post-AGB,
core masses
![]() ,
0.755, and
,
0.755, and
![]() ,
respectively).
Otherwise the tracks are similar, but differ slightly in the curvature
and extension of both the steep part and the quasi-horizontal one.
,
respectively).
Otherwise the tracks are similar, but differ slightly in the curvature
and extension of both the steep part and the quasi-horizontal one.
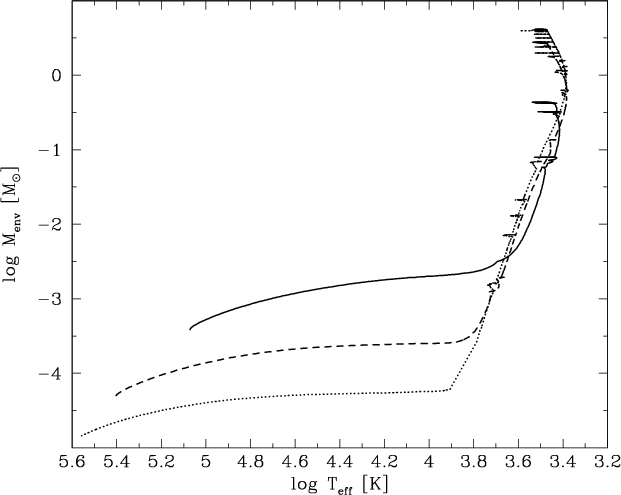 |
Figure 2:
|
| Open with DEXTER | |
So, the general shape of the
future synthetic
![]() relation can be easily obtained by moving the
curves
corresponding to the numerical evolutionary tracks
over the plane until they best cover each other and
then making an average.
As the shapes are noisy (due to the thermal pulses), differ
in their span along both axes, and contain gaps (only H-burning periods
should be considered), this fit has to be made by eye.
When the curves match each other best, points along this bunch
of lines can be choosen, that reflect its "average'' course and therefore
a general shape of the
relation can be easily obtained by moving the
curves
corresponding to the numerical evolutionary tracks
over the plane until they best cover each other and
then making an average.
As the shapes are noisy (due to the thermal pulses), differ
in their span along both axes, and contain gaps (only H-burning periods
should be considered), this fit has to be made by eye.
When the curves match each other best, points along this bunch
of lines can be choosen, that reflect its "average'' course and therefore
a general shape of the
![]() relation.
This general shape may be tabulated and
it
becomes a basis for the
synthetic model. Then, moving this "average''
curve over the plane to fit best actual
relation.
This general shape may be tabulated and
it
becomes a basis for the
synthetic model. Then, moving this "average''
curve over the plane to fit best actual
![]() curves, one gets position coefficients of the synthetic diagram.
Let us denote the coefficient governing the offset in the vertical direction
(i.e. along
curves, one gets position coefficients of the synthetic diagram.
Let us denote the coefficient governing the offset in the vertical direction
(i.e. along
![]() axis) by
axis) by ![]() ,
and the coefficient governing the offset in the horizontal direction
(i.e. along
,
and the coefficient governing the offset in the horizontal direction
(i.e. along
![]() axis) by
axis) by ![]() .
It can be seen that these coefficients correlate with the CO core masses of
given tracks. Next step is to account for shape differences between
the computed models. It has been done by
horizontal and vertical stretching of the "average'' shape to fit the shape of
a specific
original model (while still keeping this synthetic curve in the right
position on the
.
It can be seen that these coefficients correlate with the CO core masses of
given tracks. Next step is to account for shape differences between
the computed models. It has been done by
horizontal and vertical stretching of the "average'' shape to fit the shape of
a specific
original model (while still keeping this synthetic curve in the right
position on the
![]() plane).
This procedure gives a set of stretching coefficients in the vertical
and horizontal direction (
plane).
This procedure gives a set of stretching coefficients in the vertical
and horizontal direction (![]() and
and ![]() ,
respectively),
and also modifies values of the position coefficients mentioned above.
Tests with VW and BS tracks have proved that inside a uniform grid of
tracks
all the four sets of
coefficients show a good correlation with the CO core mass.
Fitting analytical dependences on the CO core mass to all these coefficients
leads to the final form of the synthetic
,
respectively),
and also modifies values of the position coefficients mentioned above.
Tests with VW and BS tracks have proved that inside a uniform grid of
tracks
all the four sets of
coefficients show a good correlation with the CO core mass.
Fitting analytical dependences on the CO core mass to all these coefficients
leads to the final form of the synthetic
![]() relation parametrized by
relation parametrized by
![]() .
.
To get a synthetic
![]() curve for a
specific core mass one uses the aforementioned analytical expressions for
stretching coefficients and for position coefficients (as functions of
curve for a
specific core mass one uses the aforementioned analytical expressions for
stretching coefficients and for position coefficients (as functions of
![]() )
and applies them to the basic "average'' tabulated relation.
The diagram obtained in this way allows to determine the effective
temperature for a post-AGB object characterized, for a given
)
and applies them to the basic "average'' tabulated relation.
The diagram obtained in this way allows to determine the effective
temperature for a post-AGB object characterized, for a given
![]() ,
only by its envelope mass,
,
only by its envelope mass,
![]() (luminosity, L, can be provided from
(luminosity, L, can be provided from
![]() relation
appropriate for
a given set of original numerical
models). For values of
relation
appropriate for
a given set of original numerical
models). For values of
![]() other
than tabulated, linear interpolation between the two closest points can be
used. Finally, supplying the nuclear burning rate and a wind formula
translates this data into a time-dependent evolutionary sequence.
A post-AGB object of core mass
other
than tabulated, linear interpolation between the two closest points can be
used. Finally, supplying the nuclear burning rate and a wind formula
translates this data into a time-dependent evolutionary sequence.
A post-AGB object of core mass
![]() travels down its
travels down its
![]() relation at a rate determined
by the nuclear burning and choosen expression for the mass loss rate.
relation at a rate determined
by the nuclear burning and choosen expression for the mass loss rate.
In principle, the above described procedure can be applied to any set
of numerical evolutionary tracks that contain information required
to construct
![]() diagrams.
The two aforementioned grids, BS and VW, differ in the parameter space
coverage and in the opacities used.
There is also some difference in "solar'' abundance definition.
Although it would be desired to use as much available data as possible, the
incompatibility of these datasets proved to be too big and forced a decision
to choose one of them. The VW grid has been choosen, because it consists of
more models, is more
uniform and uses more recent opacities. It also supplies more information on
the earliest stages of an object's detachment from the AGB. Unfortunately,
because of the difference in the opacity tables, a post-AGB evolution model
based on the VW dataset will not reproduce the behaviour of the SB tracks.
diagrams.
The two aforementioned grids, BS and VW, differ in the parameter space
coverage and in the opacities used.
There is also some difference in "solar'' abundance definition.
Although it would be desired to use as much available data as possible, the
incompatibility of these datasets proved to be too big and forced a decision
to choose one of them. The VW grid has been choosen, because it consists of
more models, is more
uniform and uses more recent opacities. It also supplies more information on
the earliest stages of an object's detachment from the AGB. Unfortunately,
because of the difference in the opacity tables, a post-AGB evolution model
based on the VW dataset will not reproduce the behaviour of the SB tracks.
The available VW grid consists of six tracks with metallicities Z=0.016 (solar), seven with Z=0.008 (LMC), seven with Z=0.004 (SMC), and two with Z=0.001. From these, only solar and SMC subgrids contain enough useful (i.e. not distorted too heavily by He-flashes) tracks to apply the procedure described in the previous section.
The solar metallicity subgrid consists of tracks computed for stars
starting on ZAMS with masses
![]() ,
1.5, 2.0, 2.5, 3.5, and
,
1.5, 2.0, 2.5, 3.5, and
![]() .
The final core masses on the post-AGB are, respectively,
.
The final core masses on the post-AGB are, respectively,
![]() ,
0.600, 0.635, 0.668, 0.755, and
,
0.600, 0.635, 0.668, 0.755, and
![]() .
All these tracks have been used in the process of deriving the shape of
the
.
All these tracks have been used in the process of deriving the shape of
the
![]() relation and its modifying coefficients,
as described in Sect. 2.
The derived average shape
relation and its modifying coefficients,
as described in Sect. 2.
The derived average shape
![]() of the
of the
![]() relation
for solar metallicity
is presented in Table 1.
This average curve is closest to the
relation
for solar metallicity
is presented in Table 1.
This average curve is closest to the
![]() relation of the
relation of the
![]() track.
track.
Table 1:
Points defining the average shape of the
![]() -
-
![]() relation, used to construct the synthetic dependence
for solar metallicity.
relation, used to construct the synthetic dependence
for solar metallicity.
Table 2: Same as Table 1, but for SMC metallicity.
To get a synthetic relation
![]() for a given
for a given
![]() ,
the following expressions should be applied to each point from
Table 1:
,
the following expressions should be applied to each point from
Table 1:
 |
(2) |
 |
(3) |
 |
(4) |
The SMC metallicity subgrid consists of tracks computed for stars
starting on ZAMS with masses
![]() ,
1.0, 1.5, 2.0, 2.5, 3.5,
and
,
1.0, 1.5, 2.0, 2.5, 3.5,
and
![]() .
The final core masses on the post-AGB are, respectively,
.
The final core masses on the post-AGB are, respectively,
![]() ,
0.593, 0.640, 0.672, 0.692, 0.855, and
,
0.593, 0.640, 0.672, 0.692, 0.855, and
![]() .
The track
.
The track
![]() ,
,
![]() has been dropped from the analysis due to an
inconveniently placed He-flash, all the other tracks have been used.
Obtained average shape
has been dropped from the analysis due to an
inconveniently placed He-flash, all the other tracks have been used.
Obtained average shape
![]() of the
of the
![]() relation
for SMC metallicity is presented in Table 2. Main difference
compared to
the solar metallicity average shape appears in the quasi-horizontal part
of the curve.
relation
for SMC metallicity is presented in Table 2. Main difference
compared to
the solar metallicity average shape appears in the quasi-horizontal part
of the curve.
As for the solar metallicity case, to get an SMC synthetic relation
![]() for a given
for a given
![]() ,
Eq. (1) should be applied to each point from Table 2.
Appropriate coefficients
,
Eq. (1) should be applied to each point from Table 2.
Appropriate coefficients
![]() ,
,
![]() ,
,
![]() ,
and
,
and
![]() ,
for SMC metallicity are given by the following formulae:
,
for SMC metallicity are given by the following formulae:
 |
(7) |
 |
(8) |
An obvious test for this model is a comparison of the model results
with the original data it is based on. Such a comparison is given by
Fig. 3
(solar metallicity case) and Fig. 4 (SMC metallicity)
where the synthetic curves are overplotted on the original
![]() vs.
vs.
![]() diagrams from numerical tracks of Vassiliadis & Wood.
Panels in
Figs. 3 and 4
show numerical and synthetic
diagrams from numerical tracks of Vassiliadis & Wood.
Panels in
Figs. 3 and 4
show numerical and synthetic
![]() diagrams for objects of different final mass, as indicated in each panel.
Initial masses
diagrams for objects of different final mass, as indicated in each panel.
Initial masses
![]() of respective VW tracks are also given.
Full lines correspond to the
numerical tracks, dotted - to the synthetic ones.
of respective VW tracks are also given.
Full lines correspond to the
numerical tracks, dotted - to the synthetic ones.
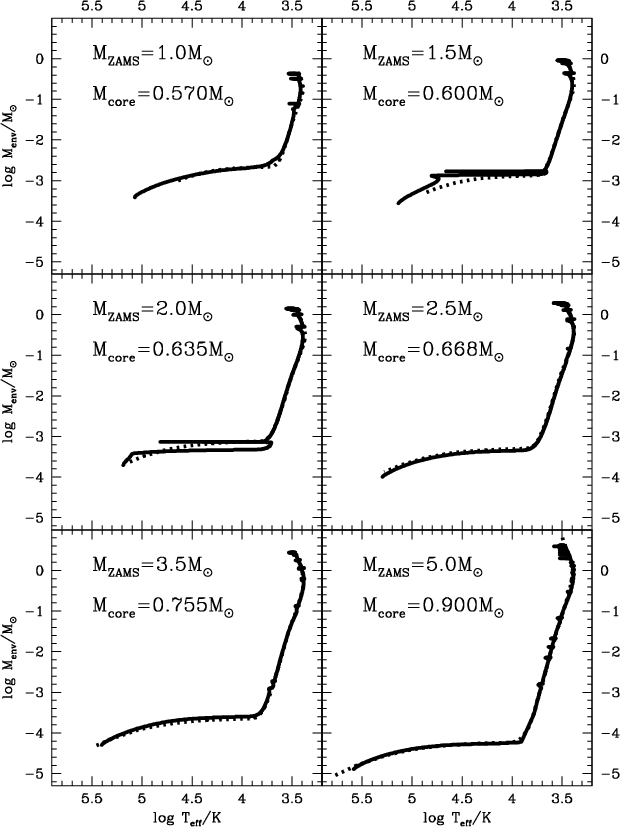 |
Figure 3:
Comparison of
|
| Open with DEXTER | |
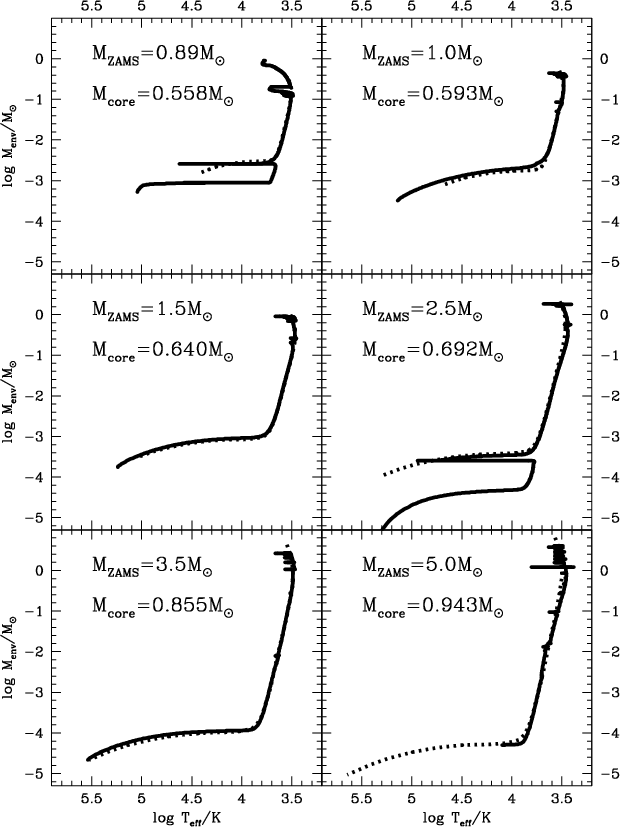 |
Figure 4: Same as Fig. 3, but for SMC metallicity. |
| Open with DEXTER | |
It can be seen that the overall match
for solar metallicity models
is good, with the exception of the least
massive object of core mass
![]() ,
which goes to much higher
effective temperatures in the numerical calculations than is reached
in the synthetic model. However, even in this case, at
,
which goes to much higher
effective temperatures in the numerical calculations than is reached
in the synthetic model. However, even in this case, at
![]() the agreement is acceptable.
Also tracks that exhibit
a late He-flash (
the agreement is acceptable.
Also tracks that exhibit
a late He-flash (
![]() and
and
![]() )
deviate from the
synthetic relation during these flashes, but
this is to be expected, as noted in Sect. 2.
)
deviate from the
synthetic relation during these flashes, but
this is to be expected, as noted in Sect. 2.
Figure 5
compares the time evolution of the effective temperature in
the original numerical tracks
of solar metallicity
and as reproduced by the proposed synthetic
method. The mass loss prescription put into the synthetic calculations is
the same as used by Vassiliadis & Wood in their tracks.
Only H-burning post-AGB tracks
have been shown, but in other respects panels and symbols are as
in Fig. 3.
It can be seen that also here the agreement is satisfactory - the
main timescales are reasonably reproduced. Again, the
![]() case exhibits the highest degree of
deviation. A significant deceleration of the
case exhibits the highest degree of
deviation. A significant deceleration of the
![]() evolution at
evolution at
![]() yrs, which in the original VW track results from
the AGB-to-PN wind regime switching, is not reproduced. This is because in
the synthetic model, due to a more sharp bending of the synthetic
yrs, which in the original VW track results from
the AGB-to-PN wind regime switching, is not reproduced. This is because in
the synthetic model, due to a more sharp bending of the synthetic
![]() curve at
curve at
![]() ,
compared to the original track (cf. upper left panel in Fig. 3)
this regime
switching occurs at lower envelope mass,
already at the quasi-horizontal part of the
,
compared to the original track (cf. upper left panel in Fig. 3)
this regime
switching occurs at lower envelope mass,
already at the quasi-horizontal part of the
![]() relation. At this point even minute changes in
relation. At this point even minute changes in
![]() lead to large
differences in
lead to large
differences in
![]() and this is why a weak PN-type wind suffices
for fast
and this is why a weak PN-type wind suffices
for fast
![]() evolution. A close inspection of the synthetic
evolution. A close inspection of the synthetic
![]() curve in the upper left panel
of Fig. 5
reveals that the
curve in the upper left panel
of Fig. 5
reveals that the
![]() evolution does slow down for a while as the
wind intensity drops, but this effect is
much less pronounced than it is in the original track, where the wind regime
change occurs at higher
evolution does slow down for a while as the
wind intensity drops, but this effect is
much less pronounced than it is in the original track, where the wind regime
change occurs at higher
![]() ,
just on the bending before the
quasi-horizontal part of the
,
just on the bending before the
quasi-horizontal part of the
![]() curve. In other
words, in the original track the PN-type wind starts at higher envelope
mass and therefore has to strip off more matter before the evolution can
accelerate again.
Note, that although the
curve. In other
words, in the original track the PN-type wind starts at higher envelope
mass and therefore has to strip off more matter before the evolution can
accelerate again.
Note, that although the
![]() and
and
![]() tracks experience a post-AGB He-flash, their behaviour
near this characteristic bending in the
tracks experience a post-AGB He-flash, their behaviour
near this characteristic bending in the
![]() plane
(at the beginning of the quasi-horizontal part of the diagram)
is better reproduced by the synthetic model than in the
plane
(at the beginning of the quasi-horizontal part of the diagram)
is better reproduced by the synthetic model than in the
![]() case.
This means that the model would reasonably represent time evolution of
H-burning objects of
case.
This means that the model would reasonably represent time evolution of
H-burning objects of
![]() .
A conservative upper limit for using this method would
be
.
A conservative upper limit for using this method would
be
![]() ,
as this is the highest mass used in
constructing the model. However, good agreement of the original and
synthetic results at the high-mass end of the VW grid suggests that the
applicability of the synthetic model can be assumed to extend at
least to
,
as this is the highest mass used in
constructing the model. However, good agreement of the original and
synthetic results at the high-mass end of the VW grid suggests that the
applicability of the synthetic model can be assumed to extend at
least to
![]() .
.
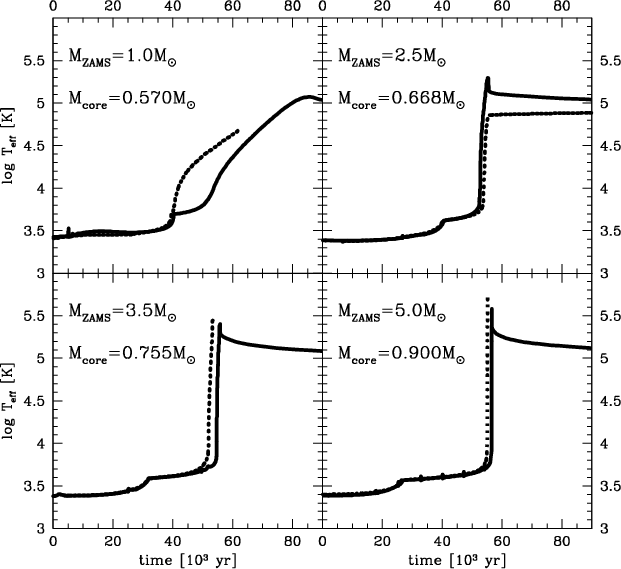 |
Figure 5:
The
|
| Open with DEXTER | |
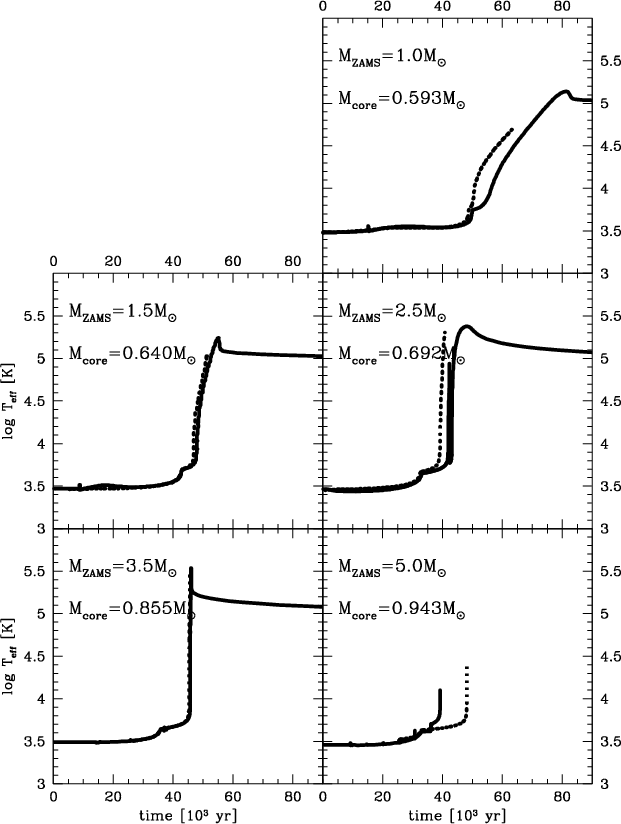 |
Figure 6: Same as Fig. 5, but for SMC metallicity. |
| Open with DEXTER | |
Comparison of
![]() diagrams for SMC metallicity
also reveals satisfactory agreement between numerical and synthetic results
(Fig. 4), although the match is slightly less exact than in the
solar metallicity case.
Again, the least massive object (
diagrams for SMC metallicity
also reveals satisfactory agreement between numerical and synthetic results
(Fig. 4), although the match is slightly less exact than in the
solar metallicity case.
Again, the least massive object (
![]() )
breaks
the picture, but now there is an additional reason - it is a late He-flash
track.
A late He-flash occurs also in the
)
breaks
the picture, but now there is an additional reason - it is a late He-flash
track.
A late He-flash occurs also in the
![]() VW track
and the lower quasi-horizontal branch in this
VW track
and the lower quasi-horizontal branch in this
![]() diagram represents steady He burning that follows the flash.
H burning does not recover in this case, as the flash occurs at extremely
low envelope mass and this object ends it evolution as a He-burner.
Obviously, the synthetic model should be compared to the upper branch, which
corresponds to H burning - and in this part the match is good.
Note also, that the numerical track for the most massive object,
diagram represents steady He burning that follows the flash.
H burning does not recover in this case, as the flash occurs at extremely
low envelope mass and this object ends it evolution as a He-burner.
Obviously, the synthetic model should be compared to the upper branch, which
corresponds to H burning - and in this part the match is good.
Note also, that the numerical track for the most massive object,
![]() ,
ends at
,
ends at
![]() - there is
no data for higher temperatures in the publicly available VW track.
In other cases, the agreement is acceptable at least up to
- there is
no data for higher temperatures in the publicly available VW track.
In other cases, the agreement is acceptable at least up to
![]() .
.
Figure 6 displays, for the SMC metallicity case, a comparison
of the time
evolution of the effective temperature in the VW tracks and as reproduced
by the synthetic method (with VW mass loss prescription).
As for solar metallicity, only H-burning post-AGB tracks are shown
(in the case of the abovementioned
![]() object
the original VW track is displayed only to the point of H burning
cessation).
The timescales are again reproduced quite well, but problems noted in
solar abundance
object
the original VW track is displayed only to the point of H burning
cessation).
The timescales are again reproduced quite well, but problems noted in
solar abundance
![]() object are now present
(to a lesser extent, though) for a higher mass star,
object are now present
(to a lesser extent, though) for a higher mass star,
![]() .
Reasons are the same as for the least massive solar metallicity case.
The most massive SMC metallicity object (bottom right panel in
Fig. 6) also
deserves a comment. There is a shift of
.
Reasons are the same as for the least massive solar metallicity case.
The most massive SMC metallicity object (bottom right panel in
Fig. 6) also
deserves a comment. There is a shift of ![]()
![]() yrs between the
original VW and synthetic results for this case in the onset of the
yrs between the
original VW and synthetic results for this case in the onset of the
![]() evolution acceleration. This shift does not originate from
an intrinsic inaccuracy of the proposed synthetic method, but is caused by
a He-flash occuring in the original VW track right after departure from the AGB.
The flash causes a short (
evolution acceleration. This shift does not originate from
an intrinsic inaccuracy of the proposed synthetic method, but is caused by
a He-flash occuring in the original VW track right after departure from the AGB.
The flash causes a short (![]() 400 yrs) rejuvenation of a strong AGB wind,
which at a very high rate (two orders of magnitude higher than before and
after this episode) blows out a portion of the envelope and
significantly shortens the post-AGB phase following the He-flash. As no such
event is possible in the synthetic model for H-burning post-AGB evolution,
the post-AGB phase lasts longer in this case.
Other objects are free of such difficulties and it seems that the
applicability range of the synthetic method for SMC metallicity can
be assumed similar to that of
solar metallicity, i.e.
400 yrs) rejuvenation of a strong AGB wind,
which at a very high rate (two orders of magnitude higher than before and
after this episode) blows out a portion of the envelope and
significantly shortens the post-AGB phase following the He-flash. As no such
event is possible in the synthetic model for H-burning post-AGB evolution,
the post-AGB phase lasts longer in this case.
Other objects are free of such difficulties and it seems that the
applicability range of the synthetic method for SMC metallicity can
be assumed similar to that of
solar metallicity, i.e.
![]() .
.
In summary, the conclusion is that the proposed
synthetic evolution model is consistent with the numerical results it is
based on. It can be used to obtain post-AGB evolutionary
tracks of
solar and SMC metallicity.
Covered mass range is
![]() in the solar metallicity case and
in the solar metallicity case and
![]() for SMC metallicity, with possible extension to higher core masses in
both cases.
It should be stressed, that the model parameters obtained in this work
do not reproduce the post-AGB evolution of Schönberner and Blöcker
tracks, that are based on different opacity tables than these of VW, as
noted in Sect. 3.
for SMC metallicity, with possible extension to higher core masses in
both cases.
It should be stressed, that the model parameters obtained in this work
do not reproduce the post-AGB evolution of Schönberner and Blöcker
tracks, that are based on different opacity tables than these of VW, as
noted in Sect. 3.
The synthetic model of post-AGB stellar evolution presented here allows for fast computing of extensive grids of models for post-AGB objects of different parameters. It can be used e.g. as a part of synthetic stellar evolution or as input for hydrodynamical calculations of PPN and PN phases. Such applications are currently under development and their results will be published in next papers.
Acknowledgements
The author is very indebted to Prof. R. Tylenda for inspiration to work on this subject, his strong support during the project and careful reading of the manuscript. It is a pleasure to thank Prof. P. R. Wood for supplying numerical evolutionary tracks and to thank an anonymous referee for helpful suggestions that significantly improved the manuscript. This work has been supported from the grants No. 5.P03D.005.21 and No. 2.P03D.020.17 of the Polish State Committee for Scientific Research.