![\begin{figure}
\par\includegraphics[width=8.1cm,clip]{H4267F1.ps}\end{figure}](/articles/aa/full/2003/27/aah4267/img17.gif) |
Figure 1:
Multiplicity function of LCLGs showing the fraction of groups
in systems with at least 2 members as a function of the neighbourhood
radius. Bold lines: solid line - slice
 ,
dotted
line - slice ,
dotted
line - slice
 ,
dashed line - slice ,
dashed line - slice
 .
Thin lines: solid line: slice .
Thin lines: solid line: slice
 ,
dotted line - slice ,
dotted line - slice
 ,
and dashed line - slice ,
and dashed line - slice
 .
Note the difference between the slice
and other slices. .
Note the difference between the slice
and other slices. |
| Open with DEXTER | |
In the text
![\begin{figure}
\par\includegraphics[width=7.1cm,clip]{H4267F2.ps}\end{figure}](/articles/aa/full/2003/27/aah4267/img37.gif) |
Figure 2: The angle between the line-of-sight and the large semiaxes of the LCLG superclusters (Table 1). The diagonal corresponds to the uniform distribution. |
| Open with DEXTER | |
In the text
![\begin{figure}
\par\includegraphics[width=8.8cm,clip]{H4267F3.ps}\end{figure}](/articles/aa/full/2003/27/aah4267/img39.gif) |
Figure 3: The distribution of Abell clusters (open circles), Las Campanas Loose Groups (triangles) and LCRS galaxies (stars) in the region of the supercluster SCL126 along line-of-sight, with shape ellipses. Open circles denote Abell clusters, triangles - LCLGs, stars - LCRS galaxies. |
| Open with DEXTER | |
In the text
![\begin{figure}
\par\includegraphics[width=7.8cm,clip]{H4267F4a.ps}\par\vspace*{2mm}
\includegraphics[width=7.8cm,clip]{H4267F4b.ps}\end{figure}](/articles/aa/full/2003/27/aah4267/img40.gif) |
Figure 4:
The distribution of Abell clusters and Las Campanas loose
groups in the region of the supercluster SCL48 (the
Horologium-Reticulum supercluster) in supergalactic YX (upper panel)
and YZ (lower panel) coordinates in Mpc. Filled circles denote Abell
clusters, open circles - LCLGs from the slice
,
crosses - LCLGs from the slice
,
and  's - LCLGs
from the slice
.
The Abell numbers of the richest
Abell clusters in this supercluster are given (see text). 's - LCLGs
from the slice
.
The Abell numbers of the richest
Abell clusters in this supercluster are given (see text). |
| Open with DEXTER | |
In the text
![\begin{figure}
\par\includegraphics[width=8.1cm,clip]{H4267F5.ps}\end{figure}](/articles/aa/full/2003/27/aah4267/img58.gif) |
Figure 5: The rms line-of-sight velocities of loose groups in Abell superclusters against the distances from the nearest Abell cluster in a supercluster. The open circle represents LCLG-12 163, that is located at an end of a filament centred on an Abell cluster from SCL119. |
| Open with DEXTER | |
In the text
![\begin{figure}
\par\includegraphics[width=14.8cm,clip]{H4267F6a.ps}\par\includegraphics[width=15.4cm,clip]{H4267F6b.ps}\end{figure}](/articles/aa/full/2003/27/aah4267/img59.gif) |
Figure 6: Upper panel: the Abell clusters in equatorial coordinates. Filled circles show the Abell clusters located in superclusters of richness 8 and more members, open circles mark the Abell clusters in less rich superclusters. Solid lines show the location of the LCRS slices, dashed lines - the location of the Dominant Supercluster Plane. Lower panels show intersections of supercluster ellipsoids with the LCRS slices |
| Open with DEXTER | |
In the text
![\begin{figure}
\par\includegraphics[width=8.3cm,clip]{H4267F7.ps}\end{figure}](/articles/aa/full/2003/27/aah4267/img60.gif) |
Figure 7:
Luminosities of LCRS loose groups from superclusters
of Abell clusters (filled circles) and from systems without Abell
clusters (open circles)
(in units of solar luminosity
 )
versus the distances of the groups (in h-1 Mpc). )
versus the distances of the groups (in h-1 Mpc). |
| Open with DEXTER | |
In the text
![\begin{figure}
\par\includegraphics[width=8.1cm,clip]{H4267F8.ps}\end{figure}](/articles/aa/full/2003/27/aah4267/img61.gif) |
Figure 8: Maximum relative densities in superclusters (Table 1) versus the distance of a supercluster. Filled circles correspond to superclusters of Abell clusters, open circles - to systems without Abell clusters. |
| Open with DEXTER | |
In the text
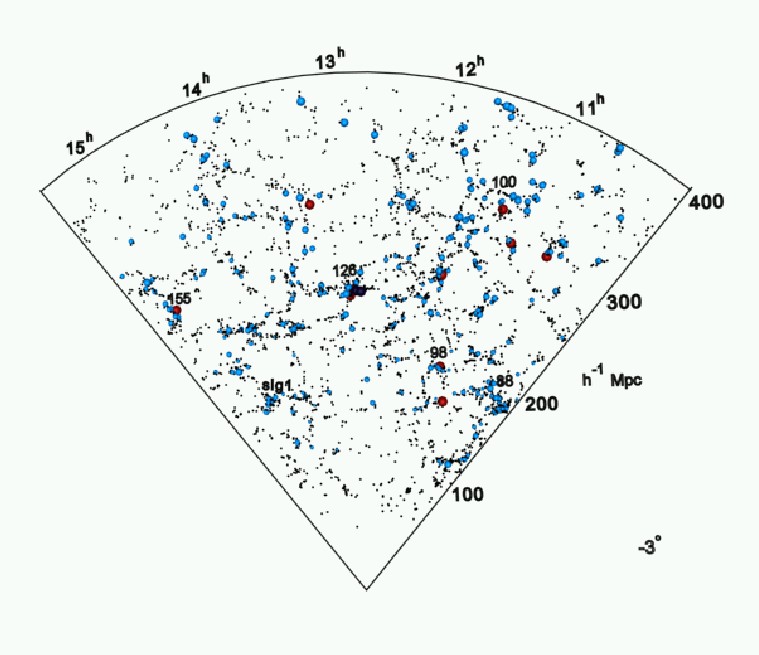 |
Figure 9: The slice delta = -3 degrees |
In the text
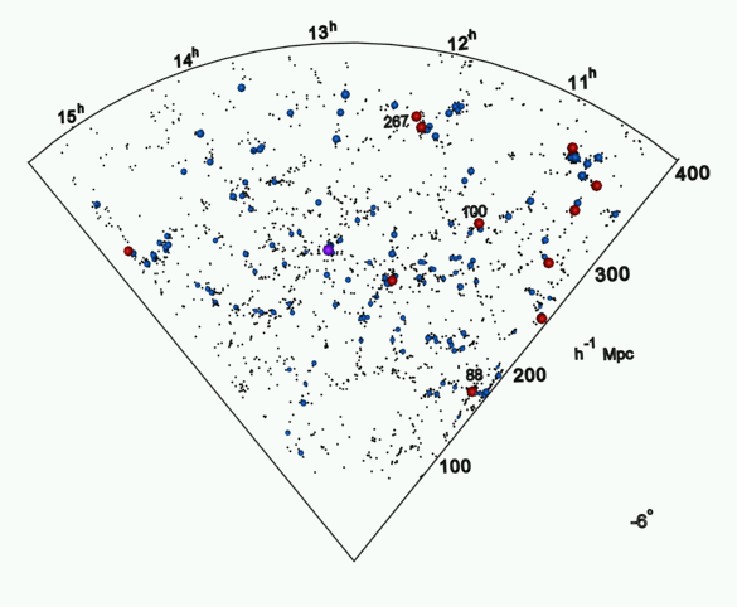 |
Figure 10: The slice delta = -6 degrees |
In the text
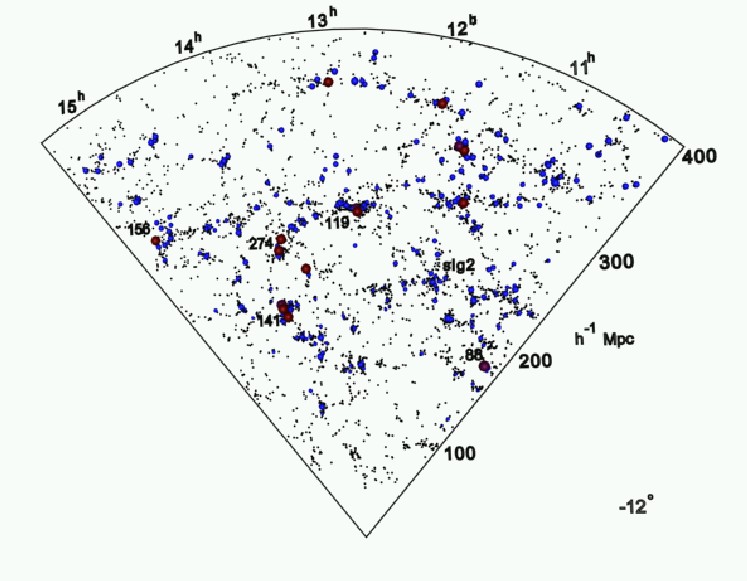 |
Figure 11: The slice delta = -12 degrees |
In the text
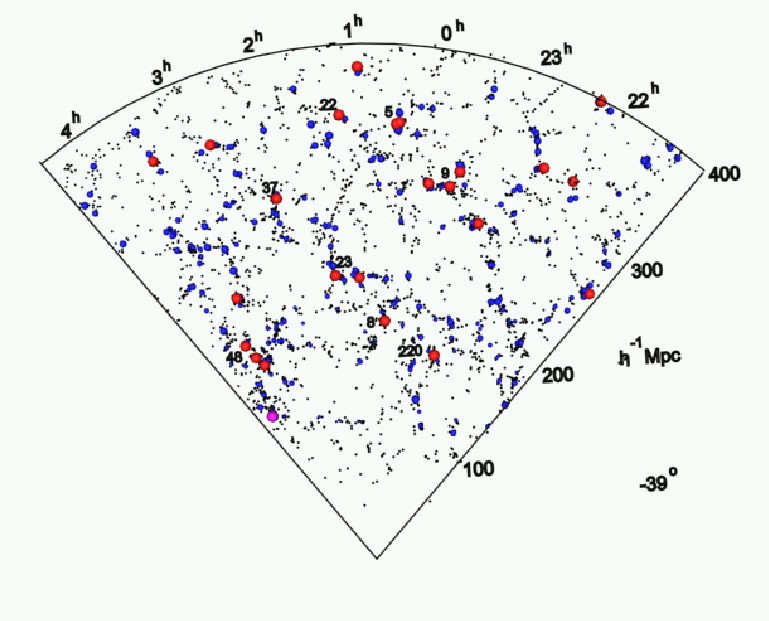 |
Figure 12: The slice delta = -39 degrees |
In the text
 |
Figure 13: The slice delta = -42 degrees |
In the text
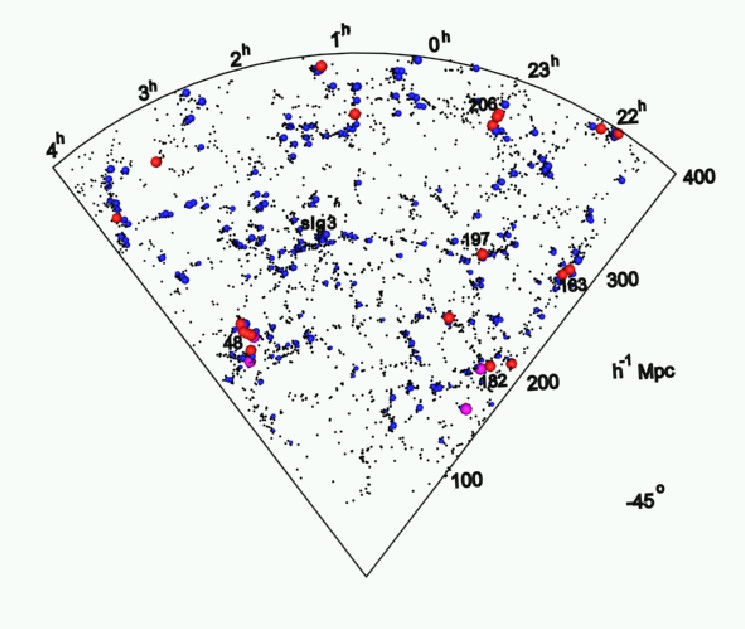 |
Figure 14: The slice delta = -45 degrees |
In the text