A&A 405, 991-998 (2003)
DOI: 10.1051/0004-6361:20030700
Does Cyg OB2 harbour any open cluster?
E. Bica 1 -
Ch. Bonatto 1 -
C. M. Dutra2,3
1 - Universidade Federal do Rio Grande do Sul, Instituto de Física, CP 15051,
Porto Alegre 91501-970, RS, Brazil
2 -
Universidade de São Paulo, Instituto de Astronomia, Geofísica e Ciências Atmosféricas,
CP 3386, São Paulo 01060-970, SP, Brazil
3 -
Universidade Estadual do Rio Grande do Sul, Unidade São Borja, Rua Bompland
512, São Borja 97670-000, RS, Brazil
Received 21 November 2002 / Accepted 6 May 2003
Abstract
We report the detection of three new open cluster candidates located in Cygnus.
Two of them are projected near the center of the rich compact association Cyg OB2. These
two objects have been found during an optical inspection of that region with Digitized Sky
Survey images. Using 2MASS photometry we determined their fundamental parameters. We
assumed an age of 1-4 Myr and obtained a distance from the Sun
 kpc for both objects. Reddening values for Objects 1 and 2 are
 and
and
 ,
respectively. A normal luminosity function is observed down to A0 stars,
similar to that of NGC 6910. The two open cluster candidates may form a physical pair in
Cyg OB2, similar to Tr 14/Tr 16 in Car OB1. Subsequently, we carried out a systematic
search with 2MASS in a region
,
respectively. A normal luminosity function is observed down to A0 stars,
similar to that of NGC 6910. The two open cluster candidates may form a physical pair in
Cyg OB2, similar to Tr 14/Tr 16 in Car OB1. Subsequently, we carried out a systematic
search with 2MASS in a region
 encompassing Cyg OB2. A third
uncatalogued object resulted from this search which is projected just outside Cyg OB2.
encompassing Cyg OB2. A third
uncatalogued object resulted from this search which is projected just outside Cyg OB2.
Key words: open clusters and associations: general
The Cygnus X area is a projected, extended structure to which are associated optical, infrared and
radio objects (e.g. Dickel et al. 1969; Wendker 1970; Odenwald & Schwartz 1993). It encompasses
one of the richest concentrations of star forming regions in the Galaxy as a result of the Local Arm plunge into Cygnus and/or the existence of a coherent structure with enhanced star formation.
Comerón & Torra (2001) carried out a near-infrared imaging survey of compact H II regions in Cygnus X using data from Observatorio del Teide and found new embedded clusters. Dutra & Bica (2001)
found new embedded clusters and stellar groups in the direction of known optical and radio nebulae in the Galaxy, including the Cygnus X area, using the Two Micron All Sky Survey (hereafter 2MASS,
Skrutskie et al. 1997). Embedded stellar groups are less dense than clusters but appear to be
physical systems (Bica et al. 2003).
Dutra & Bica (2001) studied colour-magnitude diagrams (CMDs) using the
2MASS Point Source Catalogue and obtained distances in the range
 for 7 Cygnus X clusters. Recently, Le Duigou & Knödlseder (2002), also using 2MASS observations,
studied the morphology and stellar content of 22 embedded clusters in Cygnus X, some of them new.
All these findings correspond to infrared clusters and stellar groups (Bica et al. 2003). An interesting issue is whether any optical or infrared open cluster remains uncatalogued in the area.
for 7 Cygnus X clusters. Recently, Le Duigou & Knödlseder (2002), also using 2MASS observations,
studied the morphology and stellar content of 22 embedded clusters in Cygnus X, some of them new.
All these findings correspond to infrared clusters and stellar groups (Bica et al. 2003). An interesting issue is whether any optical or infrared open cluster remains uncatalogued in the area.
The Cygnus X area contains the rich compact association Cyg OB2, which has been compared
to populous LMC blue clusters in terms of its properties (Knödlseder 2000).
The stellar content of the Cyg OB2 association has been much explored, especially in its
central parts (e.g. Schulte 1958; Massey & Thompson 1991; Massey et al. 1995; Knödlseder 2000;
Comerón et al. 2002).
Many associations are known to contain star clusters, e.g. NGC 6823 in Vul OB1,
NGC 6871 in Cyg OB3, Berkeley 86 in Cyg OB1 (Massey et al. 1995). Carina OB1 contains
several clusters, in particular the prominent pair Tr 14/Tr 16. An
interesting issue is whether Cyg OB2, as a prominent association, might harbour any open
cluster.
A large number of O stars has been found in Cyg OB2 spectroscopically or
photometrically (Massey & Thompson 1991; Knödlseder 2000). A recent study (Comerón et al. 2002) estimates this number as 90-100.
Another key issue is the actual distance to the association. Hutchings (1981) assumed
an absolute distance modulus (
m-M) = 10.7, converting to
 kpc. Humphreys
(1978) adopted
kpc. Humphreys
(1978) adopted
 kpc, while Torres-Dodgen et al. (1991) and Massey & Thompson
(1991) determined
kpc, while Torres-Dodgen et al. (1991) and Massey & Thompson
(1991) determined
 kpc ((
m-M)0=11.2). Knödlseder (2000) assumed a
distance
kpc ((
m-M)0=11.2). Knödlseder (2000) assumed a
distance
 kpc. The possibility of clusters related to Cyg OB2 in the
present study may
help constrain the distance. Early reddening determinations have been based on
less-reddened stars, e.g. AV=3.3 (Hutchings 1981), while more recent studies
show a range of values, e.g. Knödlseder (2000) found
kpc. The possibility of clusters related to Cyg OB2 in the
present study may
help constrain the distance. Early reddening determinations have been based on
less-reddened stars, e.g. AV=3.3 (Hutchings 1981), while more recent studies
show a range of values, e.g. Knödlseder (2000) found
 .
The large number of main sequence or evolved O stars constrains the age to the range
1-4 Myr (Massey et al. 1995).
.
The large number of main sequence or evolved O stars constrains the age to the range
1-4 Myr (Massey et al. 1995).
Any new cluster
in the area would bring further constraints to our understanding of the Cygnus X structure
and Cyg OB2.
In the present study we report two new open cluster candidates in the Cyg OB2
area and perform the first estimate of fundamental parameters for these objects using 2MASS data.
In Sect. 2 we present the two new open cluster candidates in Cyg OB2. In Sect. 3 we
derive the parameters for these objects from the 2MASS J, H and
 CMD analysis. In Sect. 4 we present a 2MASS survey in the area providing a
third uncatalogued object, projected just outside Cyg OB2.
In Sect. 5 we discuss the results. Finally, in Sect. 6 concluding remarks
are given.
CMD analysis. In Sect. 4 we present a 2MASS survey in the area providing a
third uncatalogued object, projected just outside Cyg OB2.
In Sect. 5 we discuss the results. Finally, in Sect. 6 concluding remarks
are given.
Since Cyg OB2 is a dense and rich association,
we were motivated to examine its optical structure on Digitized Sky Survey images. This
inspection revealed two objects resembling open clusters which are not
listed in any optical open cluster catalogue, e.g. Alter et al. (1970), Lyngå (1987), and more
recently Dias et al. (2002). The two objects are projected close to each other (
 )
suggesting a physical pair. The southern cluster candidate, which we refer to as Object 1, is
located at J2000.0
)
suggesting a physical pair. The southern cluster candidate, which we refer to as Object 1, is
located at J2000.0

 (
(
 ,
,
 )
and has angular dimensions of
)
and has angular dimensions of
 .
The
northern companion, Object 2, is located at J2000.0
.
The
northern companion, Object 2, is located at J2000.0

 (
(
 ,
,
 )
and has
)
and has
 .
Object 1 is approximately centered on Cyg OB2. Both objects might be faced as the
association core, if located at the same distance.
.
Object 1 is approximately centered on Cyg OB2. Both objects might be faced as the
association core, if located at the same distance.
It is noteworthy that the present objects have been overlooked in
previous investigations, despite the fact that both were present in charts and optical
images. The northern object detaches as a concentration in Fig. 2 of Schulte (1958) and
in Fig. 9 of Massey & Thompson (1991). Both objects are clear in zone 3 of Fig. 1 of Massey
& Thompson (1991) - a blue POSS plate. Le Duigou & Knödlseder (2002) have not investigated
the central zone of Cygnus OB2 on the basis of having already covered it in sufficient
detail in Knödlseder (2000). The work by Dutra & Bica (2001) studied directions of prominent nebula, but none occurs in the center of Cyg OB2.
We show in Figs. 1 and 2 red XDSS images of Objects 1 and 2, respectively, in which they clearly detach from the background. They are also visible in blue XDSS images, which suggests that reddening is not extreme. Finally, in Figs. 3 and 4 we show these objects in 2MASS  extractions. They are also prominent, suggesting that they are neither field fluctuations
nor a variable absorption effect. The crosses in Figs. 3 and 4 indicate artifacts
on the 2MASS images.
extractions. They are also prominent, suggesting that they are neither field fluctuations
nor a variable absorption effect. The crosses in Figs. 3 and 4 indicate artifacts
on the 2MASS images.
![\begin{figure}
\par\resizebox{8.8cm}{!}{\includegraphics[clip]{H4123_f5.eps}}
\end{figure}](/articles/aa/full/2003/27/aah4123/Timg44.gif) |
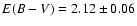
Figure 5:
 (left panel) and
 )
(right panel)
CMDs for Object 1; corresponding East and West offset fields are also shown. We show
a 4 Myr Padova isochrone at
(m-M)0=11.2. In the upper panels, the values )
(right panel)
CMDs for Object 1; corresponding East and West offset fields are also shown. We show
a 4 Myr Padova isochrone at
(m-M)0=11.2. In the upper panels, the values
 , ,
 , ,
 and
and
 have been derived. In the middle panels,
we assumed
AV = 5, 10 and 20.
have been derived. In the middle panels,
we assumed
AV = 5, 10 and 20. |
| Open with DEXTER |
![\begin{figure}
\par\resizebox{8.8cm}{!}{\includegraphics[clip]{H4123_f6.eps}}
\end{figure}](/articles/aa/full/2003/27/aah4123/Timg45.gif) |
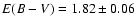
Figure 6:
Same as Fig. 5 for Object 2. Values derived from the
upper panels are
 , ,
 , ,
 and
and
 . .
|
| Open with DEXTER |
![\begin{figure}
\par\resizebox{8.8cm}{!}{\includegraphics[clip]{H4123_f7.eps}}
\end{figure}](/articles/aa/full/2003/27/aah4123/Timg46.gif) |
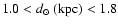
Figure 7:
Radial distribution of surface star density for the two objects. Background
levels are averages of the East and West offset positions and are shown as a
continuous line (Object 1) and dashed line (Object 2). Notice that a magnitude
cutoff (J<15.5) has been applied to the objects and offset fields. |
| Open with DEXTER |
The photometric errors as a function of magnitude are shown in e.g. Soares & Bica (2002)
for the three bands J, H and
which are available in 2MASS (second incremental data release
at http://www.ipac.caltech.edu/2mass/releases/second/). From their Fig. 5, one can
see that errors become important for stars fainter than 13.5 ()
and 15 (J), while H has an intermediate behaviour.
For Object 1 we made circular extractions centered on the Sect. 1 coordinates with
2.0 radius, while for Object 2 we used a 2.5 radius. Comparison fields have been
extracted with the same radii as those used for the objects at East and West of
both objects, with center to center distances of 5.0
and 6.0,
respectively
for Object 1 and Object 2. Extractions have been performed using the VizieR tool at
http://vizier.u-strasbg.fr/viz-bin/VizieR? -
radius, while for Object 2 we used a 2.5 radius. Comparison fields have been
extracted with the same radii as those used for the objects at East and West of
both objects, with center to center distances of 5.0
and 6.0,
respectively
for Object 1 and Object 2. Extractions have been performed using the VizieR tool at
http://vizier.u-strasbg.fr/viz-bin/VizieR? -
 .
The results are shown in Figs. 5 and 6, respectively for Objects 1 and 2. The top panel of each figure
deals with the object extraction, while the East and West offset fields are in the
middle and bottom panels, respectively. Left panels show
and
right panels
)
CMDs.
.
The results are shown in Figs. 5 and 6, respectively for Objects 1 and 2. The top panel of each figure
deals with the object extraction, while the East and West offset fields are in the
middle and bottom panels, respectively. Left panels show
and
right panels
)
CMDs.
In both cases a prominent main sequence (MS) in the CMDs of the objects stands out as
compared to those of the adjacent fields.
Spectroscopic and optical photometric data are available for several stars in the
area of each cluster candidate. Considering Schulte's (1958) and Massey & Thompson's
(1995) stars, designated respectively by S and MT, the stars S 8A = MT 465, S 8B = MT 462,
S 8C = MT 483, S 8D = MT 473, MT 441, MT 507 and MT 457 are in the area of
Object 2. In the area of Object 1, there occur the stars S 9 = MT 431,
MT 417, MT 455, MT 477 and MT 488.
Massey & Thompson (1991) condensed previous spectral type determinations
(Schulte 1958; Hutchings 1981; Walborn 1973) and their own.
In Object 2, S 8A, S 8B, S 8C and MT 457 are evolved O stars. S 8D
is an O8V, and MT 507 is an O8.5V.
In Object 1, S 9 and MT 417 appear to be evolved O stars while
MT 455 is an O8V. We remark the high concentrations of O stars in these
small areas, which might be signatures of open clusters. Concerning
the recent infrared spectral classifications by Comerón et al. (2002),
only one star (B19) is in the area of the present objects. This star is the same as S 9
in the optical papers above. Its classification as emission-line star in the infrared
is consistent with its evolved O star nature.
Figure 7 shows the radial distribution of star density in and around the cluster
candidates. Before counting stars, we applied a cutoff (J<15.5) to the objects
and offset fields to avoid undersampling, i.e. to avoid spatial variations in
the number of faint stars which are numerous, affected by large errors, and may
include spurious detections, in the area of the objects. Colour filters have
not been applied, since tests revealed them to be unnecessary. For the objects
we used concentric annuli with a step of 0.5
in radius up to 5
in radius. In the region 3.5-4.0,
both clusters show up in the
respective profiles, thus it is not useful to measure annuli for
 since the objects form a projected pair nearly at that distance, and contamination
would result from the companion.
since the objects form a projected pair nearly at that distance, and contamination
would result from the companion.
We also show the background levels which are the average of the East and West offset
fields of each object. Object 1 presents a prominent core of radius
 surrounded by a halo extending at least up to radius 2.
Object 2 has a deficiency of stars near the center, as can also be seen in
Fig. 2, but beyond this radius it presents significant star excesses over the
background. Besides, its CMD (Fig. 6) presents a MS which suggests its
nature as a cluster. The central deficiency might in part be accounted for
by faint star images blended to the several bright ones near the object
center. The limiting radius appears to be
 .
.
Since spectroscopic data for member stars are available, we use them
to derive accurate distance values. Following Sect. 2.1,
we restrict to the MS stars, since evolved early-type stars vary
fast their luminosity. In Object 1 we have the O8V star MT 455,
while in Object 2 there occur the O8V star S 8D and the O8.5V
star MT 507. We adopted as intrinsic magnitudes and colours those
of Binney & Merrifield (1998). We remind that the latter set
employs the K filter, while our observations correspond to the
2MASS
filter. We will assume their equivalence, since magnitudes
in both filters may differ by 0.02 (Girardi 2003 - private
communication).
Table 1:
Optical and infrared parameters for the MS stars in Objects 1 and 2.
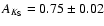
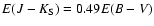
Since the total-to-selective absorption (RV) increases for star-forming
regions (e.g. Vrba et al. 1991), we test RV=3.2 and 3.6 to compute distances.
Adopting
 for J and
H from Schlegel et al. (1998) and the ratio
for J and
H from Schlegel et al. (1998) and the ratio
 from Dutra
et al. (2002), the following relations can be derived:
AJ = 0.893 RV E(J-H)and
from Dutra
et al. (2002), the following relations can be derived:
AJ = 0.893 RV E(J-H)and
 .
.
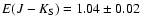
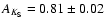
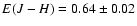
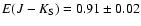
Table 1 summarizes the computations for the above object stars. The data for
the stars in the optical are from Massey & Thompson (1991) and in the infrared
from 2MASS.
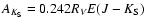
Distances derived from optical photometry are very dependent on the assumed RV.
In the infrared the resulting distance values are more constrained, indicating that
the actual RV is 3.2 (Table 1). In fact, RV=3.2 gives the most
consistent results between the different distance estimates.
Considering the absolute distance moduli and distances
calculated with RV=3.2, S 8D gives (
 and
and
 kpc,
MT 507 gives
kpc,
MT 507 gives
 and
and
 kpc, and finally,
MT 455 gives (
kpc, and finally,
MT 455 gives (
 and
and
 kpc. The two
stars in Object 2 give
kpc. The two
stars in Object 2 give
 and
and
 kpc.
Uncertainties correspond to different estimates based on RV=3.2.
The above values and uncertainties are consistent with
(m-M)0=11.2 and
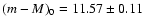
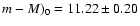
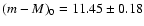
kpc by Massey & Thompson (1991) for Cyg OB2.
kpc.
Uncertainties correspond to different estimates based on RV=3.2.
The above values and uncertainties are consistent with
(m-M)0=11.2 and
kpc by Massey & Thompson (1991) for Cyg OB2.
We conclude that both objects are part of Cyg OB2, and we will assume the
Cyg OB2 distance value for both objects, since it is based on a large number
of stars.
The large number of evolved and MS O stars identified spectroscopically (Sect. 2.2)
in the present two objects constrains their age to 1-4 Myr, likewise the age
range adopted for the association itself (Massey et al. 1995).
In order to derive parameters for Objects 1 and 2, we use solar metallicity Padova
isochrones from Girardi et al. (2002). Taking into account the age range obtained in
Sect. 3.2, we adopted the youngest available solar metallicity isochrone in the Padova
set, that of 4 Myr. For reddening and absorption transformations we
use RV = 3.2 according to Sect. 3.1, and the relations
AJ = 0.276 AV and
 AV (Sect. 3.1). Finally, the relations
E(J-H) = 0.33E(B-V) and
AV (Sect. 3.1). Finally, the relations
E(J-H) = 0.33E(B-V) and
 can be therefrom derived.
Accordingly, we adopt an absolute distance modulus
(m-M)0 = 11.2 (Sect. 3.1) for both
objects and derive for Object 1
,
,
and
,
while for Object 2 we find
,
,
and
.
can be therefrom derived.
Accordingly, we adopt an absolute distance modulus
(m-M)0 = 11.2 (Sect. 3.1) for both
objects and derive for Object 1
,
,
and
,
while for Object 2 we find
,
,
and
.
We show in Figs. 5 and 6 (top panels) Padova isochrone fittings with the above parameters to the two cluster candidates, respectively. The agreement between isochrone and the stellar distributions of the objects favours them as open clusters. Notice in Figs. 5 and 6
the somewhat poorer fits for
 )
as compared to that for (J-H). The nominal errors
for
)
as compared to that for (J-H). The nominal errors
for
 above are based on the reddening transformations from the value derived
for E(J-H), and appear to be larger when obtained directly from the respective
diagram.
above are based on the reddening transformations from the value derived
for E(J-H), and appear to be larger when obtained directly from the respective
diagram.
A fundamental issue is whether the present structures might be absorption windows
in a more reddened region. In addition to the fit of a 4 Myr Padova isochrone
with the object parameters above to both CMDs (top panels of Figs. 5 and 6), we
test this hypothesis by reddening the 4 Myr isochrone by three different values:
AV=5, 10 and 20 (middle panels). For Objects 1 and 2, there does not appear
to be star sequences justifying this hypothesis.
A simple cluster mass comparison can be made by taking into account the number
of massive stars and assuming similar mass functions with respect to a
reference cluster. According to Sect. 2.1, Object 1 has 3 massive stars (OV
or evolved O stars), while Object 2 has 6. We make a comparison with the
Trapezium cluster (Prosser et al. 1994) and NGC 3603 (Moffat 1983; Melnick
et al. 1989). The Trapezium has 2 massive stars, while NGC 3603 has 14,
including two WR stars. Accordingly, Object 1 would have a mass intermediate
between the two reference clusters, while Object 2 would be somewhat more
massive than the Trapezium cluster.
![\begin{figure}
\par\resizebox{8.8cm}{!}{\includegraphics[clip]{H4123_f8.eps}}\end{figure}](/articles/aa/full/2003/27/aah4123/Timg70.gif) |
Figure 8:
Luminosity functions for Objects 1 and 2 and offset fields, both
for J and .
Continuous line is object area, dotted line is the offset
field; their difference is shown as the shaded area. |
| Open with DEXTER |
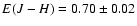
Figure 8 depicts the luminosity functions in both J and
filters (shaded
area) built as the difference of the number of stars in a given magnitude bin
between object (continuous line) and offset field (dashed line). These luminosity
functions are built after applying a cutoff (J<15.5) to the objects and offset
fields. The background-subtracted luminosity function of Object 1
increases up to the limit in J but turns over for the two last magnitude
bins in .
Object 2 has an increasing function up to J=13.5 and
 .
.
In order to infer on the low-mass behaviour, we compare the luminosity functions
for both J and
filters with that of a reference cluster such as NGC 6910.
Delgado & Alfaro (2000) place NGC 6910 at the distance to Cyg OB2, but other
studies place it closer, e.g. WEBDA (Mermilliod 1996 - http://obswww.unige.ch/webda).
However, this distance uncertainty affects little the conclusions below.
These studies give
 ,
which converts to AV=3.2, AJ=0.9 and
,
which converts to AV=3.2, AJ=0.9 and
 .
We adopted the distance of Delgado & Alfaro (2000) and applied
the above absorptions to the NGC 6910 data.
.
We adopted the distance of Delgado & Alfaro (2000) and applied
the above absorptions to the NGC 6910 data.
![\begin{figure}
\par\resizebox{8.8cm}{!}{\includegraphics[clip]{H4123_f9.eps}}
\end{figure}](/articles/aa/full/2003/27/aah4123/Timg74.gif) |
Figure 9:
Absolute luminosity functions: comparison of Object 1 (dashed line) and
Object 2 (continuous line)
with NGC 6910 (dotted line). Spectral types of MS stars are indicated, according
to Binney & Merrifield (1998). |
| Open with DEXTER |
Stars in the direction of NGC 6910 have been extracted within a radius of 6.0
centered on J2000.0

 ,
including two offset fields of equal dimensions with centers at 17
at South and
North away from the cluster. The same magnitude cutoff (J<15.5) has been applied
to NGC 6910 and its offset fields in order to build the 2MASS luminosity function.
,
including two offset fields of equal dimensions with centers at 17
at South and
North away from the cluster. The same magnitude cutoff (J<15.5) has been applied
to NGC 6910 and its offset fields in order to build the 2MASS luminosity function.
The J and
luminosity functions of Objects 1 and 2 have been dereddened and
brought to absolute magnitudes, and then compared to that of NGC 6910 in Fig. 9,
in which we also indicate the loci of MS stars, according to Binney & Merrifield
(1998).
The three luminosity functions are similar from high-mass down to A0 stars. The turnovers in the luminosity functions of Objects 1 and 2, with respect
to that of NGC 6910, may be due to crowding and completeness effects, since both
objects span areas 6-9 times smaller than that of NGC 6910 (angular diameter 12).
Alternatively, the turnovers might be caused by an unusual luminosity function
characterizing an aggregate of massive and intermediate-mass stars.
In order to verify the existence of other uncatalogued similar objects in the
area of Cyg OB2, we carried out a systematic visual inspection of a region
encompassing Cyg OB2 (square area in Fig. 10). We used the All-Sky Release of the 2MASS Atlas and examined 312
images of
 which are those least affected by reddening. Dutra & Bica (2000)
carried out a similarly systematic survey encompassing the Galactic center. In
case of possible targets, we also examined the J and H images.
which are those least affected by reddening. Dutra & Bica (2000)
carried out a similarly systematic survey encompassing the Galactic center. In
case of possible targets, we also examined the J and H images.
We retrieved most of the catalogued
objects in the area (Fig. 10) as well as a new object which is located outside
Cyg OB2, which we refer to as Object 3. This object does not appear in optical
images, indicating high reddening.
![\begin{figure}
\par\resizebox{8.8cm}{!}{\includegraphics[clip]{H4123_f10.eps}}
\end{figure}](/articles/aa/full/2003/27/aah4123/Timg78.gif) |
Figure 10:
Angular distribution of the new and previously catalogued
objects in the Cyg OB2 area. Large circle is Cyg OB2; filled circles are
infrared clusters or stellar groups; open circles are optical open clusters
or stellar groups; Objects 1, 2 and 3 are indicated by crosses. Square
represents the region surveyed with 2MASS. We only show objects within the
square or close to its borders. |
| Open with DEXTER |
We show in Fig. 11 a
image of Object 3, where one can see a concentration
of stars with a diameter of
.
Stars have been extracted inside
a radius of 1.2centered at J2000.0

 ,
with two offset fields of equal radius centered at 4
away to the North and South. The CMDs of Object 3 and offset fields
are given in Fig. 12. The object appears to be a physical system, with
a tight sequence of stars in
,
with two offset fields of equal radius centered at 4
away to the North and South. The CMDs of Object 3 and offset fields
are given in Fig. 12. The object appears to be a physical system, with
a tight sequence of stars in
 (
(
 )
resembling a giant
branch. However, it cannot be excluded a very reddened younger cluster.
In order to confirm the physical nature of Object 3, deeper photometry
is necessary to test the possibility of an intermediate age turnoff.
)
resembling a giant
branch. However, it cannot be excluded a very reddened younger cluster.
In order to confirm the physical nature of Object 3, deeper photometry
is necessary to test the possibility of an intermediate age turnoff.
![\begin{figure}
\par {\includegraphics[width=8.6cm,clip]{H4123_f12.eps} }
\end{figure}](/articles/aa/full/2003/27/aah4123/Timg84.gif) |
Figure 12:
 )
CMDs of Object 3 and North and South
offset fields. Extraction radius is 1.2
for object and fields. )
CMDs of Object 3 and North and South
offset fields. Extraction radius is 1.2
for object and fields. |
| Open with DEXTER |
Object 3 is indicated in Fig. 10 together with Objects 1 and 2 and
all previously reported objects in the area.
Several embedded clusters or stellar groups have been reported in the
surroundings of Cyg OB2, as can be seen in the recent catalogue by
Bica et al. (2003) which is basically complete to mid 2002. We also
included the new objects by Le Duigou & Knödlseder (2002), which are
indicated by LK in Fig. 10. The notation DB01- indicates objects from Dutra
& Bica (2001) while the remaining notations refer to clusters or stellar groups
embedded in their radio nebulae. Also included are optical open clusters as
catalogued e.g. in Alter et al. (1970). The Cyg OB2 area ( diameter)
is delimited by the circle and the objects projected inside it might be related
to itself, to the general field of Cygnus X, or to the Perseus or Outer
Arms in the background. The embedded cluster in G 80.35+0.72 (ECX 6-27
or 18P61), projected close to the nucleus of Cyg OB2, appears to be a
background cluster in the Outer Arm (Comerón & Torra 2001). DR 7 (ECX6-18)
might be in the Perseus Arm (Comerón & Torra 2001) or in Cygnus X (Dutra
& Bica 2001). DR 15 (IRAS 20306+4005, ECX6-25) is an embedded cluster probably
in Cygnus X (Comerón & Torra 2001), while DR 18 is a loose star-forming region
in Cygnus X (Comerón & Torra 1999). DR 11 (ECX6-21) encloses a stellar group
in Cygnus X (Comerón & Torra 2001). The optical object Do 44 is a loose
concentration of stars near the edge of Cyg OB2; it is probably part of Cyg OB2
but does not look like an open cluster. Its Trumpler classification is IV2p,
hardly discernible from the background. All these objects assigned to Cygnus X
could be related to Cyg OB2, however, available distances are not so precisely
determined. With respect to the present two objects (Sect. 3), they are projected
right at the center of Cyg OB2 and consequently more probably related to it, in
addition to the fact that a series of massive stars attributed to Cyg OB2
(Sect. 2.2) are part of them.
diameter)
is delimited by the circle and the objects projected inside it might be related
to itself, to the general field of Cygnus X, or to the Perseus or Outer
Arms in the background. The embedded cluster in G 80.35+0.72 (ECX 6-27
or 18P61), projected close to the nucleus of Cyg OB2, appears to be a
background cluster in the Outer Arm (Comerón & Torra 2001). DR 7 (ECX6-18)
might be in the Perseus Arm (Comerón & Torra 2001) or in Cygnus X (Dutra
& Bica 2001). DR 15 (IRAS 20306+4005, ECX6-25) is an embedded cluster probably
in Cygnus X (Comerón & Torra 2001), while DR 18 is a loose star-forming region
in Cygnus X (Comerón & Torra 1999). DR 11 (ECX6-21) encloses a stellar group
in Cygnus X (Comerón & Torra 2001). The optical object Do 44 is a loose
concentration of stars near the edge of Cyg OB2; it is probably part of Cyg OB2
but does not look like an open cluster. Its Trumpler classification is IV2p,
hardly discernible from the background. All these objects assigned to Cygnus X
could be related to Cyg OB2, however, available distances are not so precisely
determined. With respect to the present two objects (Sect. 3), they are projected
right at the center of Cyg OB2 and consequently more probably related to it, in
addition to the fact that a series of massive stars attributed to Cyg OB2
(Sect. 2.2) are part of them.
We conclude from this survey that no other open cluster candidate
comparable to Objects 1 and 2 are projected on or located in Cyg OB2.
The analysis by Knödlseder (2000) revealed a spherically symmetric association of
in diameter with a half-light radius of 13,
corresponding to
 pc at an assumed distance of 1.7 kpc. In the present study we find for both objects a compatible
distance of
pc at an assumed distance of 1.7 kpc. In the present study we find for both objects a compatible
distance of  kpc. We derive for Object 1
 and for Object 2
 ,
thus they belong to the less reddened parts of the association. The
Object 1 position basically coincides with the Cyg OB2 center, as derived by Knödlseder
(2000). Objects 1 and 2, which are at a projected separation of 2.3 pc, are both located within
the Cyg OB2 core radius. They seem to be part of the very nucleus of the association.
,
thus they belong to the less reddened parts of the association. The
Object 1 position basically coincides with the Cyg OB2 center, as derived by Knödlseder
(2000). Objects 1 and 2, which are at a projected separation of 2.3 pc, are both located within
the Cyg OB2 core radius. They seem to be part of the very nucleus of the association.
Arguing in favour of their nature as open clusters are (i) the CMDs which
are well-defined and different from the field sequences, (ii) the star
density profiles indicating important excesses over the background and (iii)
the background-subtracted luminosity functions are normal down to A0 stars (completeness
uncertainties do not allow inferences on lower masses). Deeper and higher angular
resolution photometry is crucial to clarify these issues. However, even assuming
that their luminosity functions have a cutoff near A0, the two objects would still
be very interesting aggregates of high and intermediate-mass stars, in a region
where low-mass star formation would have been inhibited. Their angular diameters
of 4
and 5,
at a distance of 1.8 kpc, convert to linear diameters of 2.1 and
2.6 pc, respectively, comparable to those of infrared embedded clusters (Bica et al.
2003).
We optically detected two new open cluster candidates located in Cygnus while inspecting
the structure of the association Cyg OB2 with Digitized Sky Survey images. Fundamental
parameters for the objects have been derived using the 2MASS second incremental release
catalogue. Both objects are young (
 Myr) and appear to be at the same distance
to the Sun (
Myr) and appear to be at the same distance
to the Sun (
 kpc). Object 1 is more absorbed (
 )
than
Object 2 (
). Both objects are closely projected and seem to form a physical
pair in the association core, likewise Car OB1 with Tr 14/Tr 16. The luminosity functions
are normal down to A0 stars, and deeper photometry is necessary to reach lower-mass
stars and verify whether they are typical open clusters or interesting aggregates of
high and intermediate-mass stars. In case of normal luminosity functions throughout,
their masses would be intermediate between those of Trapezium and NGC 3603. As a
result of the inspection of 312
images of the region, another uncatalogued object
was found with CMD morphology suggesting an intermediate-age cluster, and deeper
photometry is necessary to verify that possibility.
)
than
Object 2 (
). Both objects are closely projected and seem to form a physical
pair in the association core, likewise Car OB1 with Tr 14/Tr 16. The luminosity functions
are normal down to A0 stars, and deeper photometry is necessary to reach lower-mass
stars and verify whether they are typical open clusters or interesting aggregates of
high and intermediate-mass stars. In case of normal luminosity functions throughout,
their masses would be intermediate between those of Trapezium and NGC 3603. As a
result of the inspection of 312
images of the region, another uncatalogued object
was found with CMD morphology suggesting an intermediate-age cluster, and deeper
photometry is necessary to verify that possibility.
Acknowledgements
We thank the referee Dr. R. D. Jeffries for important remarks.
This publication makes use of data products from the Two Micron All Sky Survey, which is a joint
project of the University of Massachusetts and the Infrared Processing and Analysis Center/California
Institute of Technology, funded by the National Aeronautics and Space Administration and the National
Science Foundation. We employed catalogues from CDS/Simbad (Strasbourg) and Digitized Sky Survey
images from the Space Telescope Science Institute (U.S. Government grant NAG W-2166) obtained using
the extraction tool from CADC (Canada). We also made use of the WEBDA open cluster database. We
acknowledge support from the Brazilian Institutions CNPq and FAPESP. CMD acknowledges FAPESP for
a post-doc fellowship (Proc. 00/11864-6).
- Alter, G., Ruprecht, J., & Vanysek, V. 1970, in Catalogue of star
clusters and associations + supplements, 2nd ed. (Budapest: Akad. Kiado)
In the text
- Bica, E., Dutra, C. M., & Barbuy, B. 2003, A&A, 397, 177
In the text
NASA ADS
- Binney, J., & Merrifield, M. 1998, in Galactic Astronomy (Princeton,
NJ: Princeton University Press), Princeton series in astrophysics, QB857.B522
In the text
- Comerón, F., & Torra, J. 1999, A&A, 349, 605
In the text
NASA ADS
- Comerón, F., & Torra, J. 2001, A&A, 375, 539
In the text
NASA ADS
- Comerón, F., Pasquali, A., Rodighiero, G., et al. 2002, A&A, 389, 874
In the text
NASA ADS
- Delgado, A. J., & Alfaro, E. J. 2000, AJ, 119, 1848
In the text
NASA ADS
- Dias, W. S., Alessi, B. S., Moitinho, A., & Lépine, J. R. D. 2002, A&A, 389, 871
In the text
NASA ADS
- Dickel, H. R., Wendker, H. J., & Bieritz, J. H. 1969, A&A, 1, 270
In the text
NASA ADS
- Dutra, C. M., Santiago, B. X., & Bica, E. 2002, A&A, 381, 219
In the text
NASA ADS
- Dutra, C. M., & Bica, E. 2000, A&A, 359, L9
In the text
NASA ADS
- Dutra, C. M., & Bica, E. 2001, A&A, 376, 434
In the text
NASA ADS
- Girardi, L., Bertelli, G., Bressan, A., et al. 2002, A&A, 391, 195
In the text
NASA ADS
- Humphreys, R. M. 1978, ApJS, 38, 309
In the text
NASA ADS
- Hutchings, J. B. 1981, PASP, 93, 50
In the text
NASA ADS
- Knödlseder, J. 2000, A&A, 360, 539
In the text
NASA ADS
- Le Duigou, J.-M., & Knödlseder, J. 2002, A&A, 392, 869
In the text
NASA ADS
- Lyngå, G. 1987, in Computer based catalogue of open cluster data, 5th ed. (Strasbourg: CDS)
In the text
- Massey, P., Johnson, K. E., & DeGioia-Eastwood, K. 1995, ApJ, 454, 151
In the text
NASA ADS
- Massey, P., & Thompson, A. B. 1991, AJ, 101, 1408
In the text
NASA ADS
- Melnick, J., Tapia, M., & Terlevich, R. 1989, A&A, 213, 89
In the text
NASA ADS
- Mermilliod, J. C. 1996, in The origins, evolution, and destinies of binary stars in clusters, ASP Conf. Ser., 90, 475
In the text
- Moffat, A. F. J. 1983, A&A, 124, 273
In the text
NASA ADS
- Odenwald, S. F., & Schwartz, P. R. 1993, ApJ, 405, 706
In the text
NASA ADS
- Prosser, C. F., Stauffer, J. R., Hartmann, L., et al. 1994, ApJ, 421, 517
In the text
NASA ADS
- Schlegel, D. J., Finkbeiner, D. P., & Davis, M. 1998, ApJ, 500, 525
In the text
NASA ADS
- Schulte, D. H. 1958, ApJ, 128, 41
In the text
NASA ADS
- Skrutskie, M., Schneider, S. E., Stiening, R., et al. 1997, in The Impact of Large Scale Near-IR Sky Surveys, ed. F. Garzon, N. Epchtein, A. Omont, B. Burton, & P. Persi (The Netherlands: Kluwer), 210, 187
In the text
- Soares, J. B., & Bica, E. 2002, A&A, 388, 172
In the text
NASA ADS
- Torres-DodGen, A. V., Carroll, M., & Tapia, M. 1991, MNRAS, 249, 1
In the text
NASA ADS
- Vrba, F. J., Coyne, G. V., & Tapia, S. 1993, AJ, 105, 1010
In the text
NASA ADS
- Walborn, N. R. 1973, ApJ, 180, L35
In the text
NASA ADS
- Wendker, H. J. 1970, A&A, 4, 378
In the text
NASA ADS
Copyright ESO 2003
![\begin{figure}
\par\resizebox{8.8cm}{!}{\includegraphics[clip]{H4123_f1.ps}}
\end{figure}](/articles/aa/full/2003/27/aah4123/img40.gif)
![\begin{figure}
\par\resizebox{8.8cm}{!}{\includegraphics[clip]{H4123_f2.ps}}
\end{figure}](/articles/aa/full/2003/27/aah4123/img41.gif)
![\begin{figure}
\par\resizebox{8.8cm}{!}{\includegraphics[clip]{H4123_f3.ps}}
\end{figure}](/articles/aa/full/2003/27/aah4123/img42.gif)
![\begin{figure}
\par\resizebox{8.8cm}{!}{\includegraphics[clip]{H4123_f4.ps}}
\end{figure}](/articles/aa/full/2003/27/aah4123/img43.gif)
![\begin{figure}
\par\resizebox{8.8cm}{!}{\includegraphics[clip]{H4123_f5.eps}}
\end{figure}](/articles/aa/full/2003/27/aah4123/img44.gif)
![\begin{figure}
\par\resizebox{8.8cm}{!}{\includegraphics[clip]{H4123_f6.eps}}
\end{figure}](/articles/aa/full/2003/27/aah4123/img45.gif)
![\begin{figure}
\par\resizebox{8.8cm}{!}{\includegraphics[clip]{H4123_f7.eps}}
\end{figure}](/articles/aa/full/2003/27/aah4123/img46.gif)
![\begin{figure}
\par\resizebox{8.8cm}{!}{\includegraphics[clip]{H4123_f8.eps}}\end{figure}](/articles/aa/full/2003/27/aah4123/img70.gif)
![\begin{figure}
\par\resizebox{8.8cm}{!}{\includegraphics[clip]{H4123_f9.eps}}
\end{figure}](/articles/aa/full/2003/27/aah4123/img74.gif)
![\begin{figure}
\par\resizebox{8.8cm}{!}{\includegraphics[clip]{H4123_f10.eps}}
\end{figure}](/articles/aa/full/2003/27/aah4123/img78.gif)
![\begin{figure}
\par {\includegraphics[width=8.7cm,clip]{H4123_f11.ps} }\end{figure}](/articles/aa/full/2003/27/aah4123/img83.gif)
![\begin{figure}
\par {\includegraphics[width=8.6cm,clip]{H4123_f12.eps} }
\end{figure}](/articles/aa/full/2003/27/aah4123/img84.gif)