A&A 405, 285-290 (2003)
DOI: 10.1051/0004-6361:20030674
P. Reig1 - M. Ribó2 - J. M. Paredes2,![]() - J. Martí3
- J. Martí3
1 - G.A.C.E., Institut de Ciències dels Materials, Universitat de Valencia, 46071 Paterna-Valencia, Spain
2 - Departament d'Astronomia i Meteorologia, Universitat de Barcelona, Av. Diagonal 647, 08028 Barcelona, Spain
3 - Departamento de Física, Escuela Politécnica Superior, Universidad de Jaén, Virgen de la Cabeza 2, 23071 Jaén, Spain
Received 14 February 2003 / Accepted 16 April 2003
Abstract
We report on the results of the spectral and timing analysis of a BeppoSAX
observation of the microquasar system LS 5039/RX J1826.2-1450. The source was found in a low-flux state with ![]() (1-10 keV) =
(1-10 keV) =
![]() erg cm-2 s-1, which represents almost one order of magnitude
lower than a previous RXTE observation 2.5 years before. The 0.1-10 keV
spectrum is described by an absorbed power-law continuum with
photon-number spectral index
erg cm-2 s-1, which represents almost one order of magnitude
lower than a previous RXTE observation 2.5 years before. The 0.1-10 keV
spectrum is described by an absorbed power-law continuum with
photon-number spectral index
![]() and hydrogen column
density of
and hydrogen column
density of
![]() cm-2.
According to the orbital parameters of the system, the BeppoSAX
observation covers the time of an X-ray eclipse should one occur.
However, the 1.6-10 keV light curve does not show evidence of such an
event, which allows us to give an upper limit to the inclination of the
system. The low X-ray flux detected during this observation is interpreted
as a decrease in the mass accretion rate onto the compact object due to a
decrease in the mass-loss rate from the primary.
cm-2.
According to the orbital parameters of the system, the BeppoSAX
observation covers the time of an X-ray eclipse should one occur.
However, the 1.6-10 keV light curve does not show evidence of such an
event, which allows us to give an upper limit to the inclination of the
system. The low X-ray flux detected during this observation is interpreted
as a decrease in the mass accretion rate onto the compact object due to a
decrease in the mass-loss rate from the primary.
Key words: stars: individual: LS 5039, RX J1826.2-1450,
3EG J1824-1514 - X-rays: stars - stars: variables: general -
radio continuum: stars
LS 5039/RX J1826.2-1450 was first identified as a new massive X-ray binary by Motch et al.
(1997). Interest in this source has grown significantly because it
has turned out to be a source of persistent radio-emitting relativistic jets,
and because it is believed to be physically associated with the ![]() -ray
source 3EG J1824-1514 (Paredes et al. 2000,
2002).
-ray
source 3EG J1824-1514 (Paredes et al. 2000,
2002).
The first radio detection was reported by Martí et al. (1998) using the Very Large Array, but the discovery of radio jets was only possible when the source was observed at milliarcsecond scales with the Very Long Baseline Array (Paredes et al. 2000). The radio emission is persistent, non-thermal and variable, but no strong radio outbursts or periodic variability have been detected (Ribó et al. 1999, hereafter R99; Ribó 2002).
In the optical band LS 5039/RX J1826.2-1450 appears as a bright V=11.2, O6.5V((f)) star
showing little variability on timescales of months to years (Clark et al.
2001). Variations of ![]() 0.4 mag have been reported in the
infrared (H and K bands) but no obvious mechanisms for such variability
have been proposed (Clark et al. 2001). Recent studies show that
LS 5039 is a runaway system moving away from the Galactic plane with a total
systemic velocity of
0.4 mag have been reported in the
infrared (H and K bands) but no obvious mechanisms for such variability
have been proposed (Clark et al. 2001). Recent studies show that
LS 5039 is a runaway system moving away from the Galactic plane with a total
systemic velocity of ![]() 150 km s-1 and a component perpendicular to
the Galactic plane larger than 100 km s-1 (Ribó et al. 2002;
McSwain & Gies 2002). The orbit of LS 5039/RX J1826.2-1450 was first studied by
McSwain et al. (2001), who found that LS 5039/RX J1826.2-1450 is a short-period,
150 km s-1 and a component perpendicular to
the Galactic plane larger than 100 km s-1 (Ribó et al. 2002;
McSwain & Gies 2002). The orbit of LS 5039/RX J1826.2-1450 was first studied by
McSwain et al. (2001), who found that LS 5039/RX J1826.2-1450 is a short-period,
![]() day and highly eccentric,
day and highly eccentric,
![]() ,
system.
Spectroscopic observations carried out in July 2002 by Casares et al.
(2003) seem to confirm the orbital period of the system, but
neither confirm nor reject the proposed eccentricity.
,
system.
Spectroscopic observations carried out in July 2002 by Casares et al.
(2003) seem to confirm the orbital period of the system, but
neither confirm nor reject the proposed eccentricity.
![\begin{figure}
\par\includegraphics[width=8.8cm,clip]{3610f1.eps}
\end{figure}](/articles/aa/full/2003/25/aa3610/img13.gif) |
Figure 1:
MECS background subtracted light curves of RX J1826.2-1450
in different energy ranges. Each point represents 60 min. Time zero
corresponds to JD 2 451 825.75. The expected time of periastron (P) and
inferior conjunction (IC) of the primary are indicated in the top panel,
where the error bars represent the uncertainty in the zero point of the
ephemeris. The time difference between these two points is
|
| Open with DEXTER | |
In the X-rays LS 5039/RX J1826.2-1450 has been studied by R99 using RXTE data. The X-ray timing analysis indicates the absence of pulsed or periodic emission on time scales of 0.02-2000 s. The source spectrum is well represented by a power-law model, plus a Gaussian component describing a strong iron line at 6.6 keV. Significant emission is seen up to 30 keV, and no exponential cut-off at high energy is required. The X-ray luminosity has been shown to be compatible with accretion from the stellar wind of the optical companion (McSwain & Gies 2002).
One of the open questions that remains to be solved is the nature of the
compact object of the system as no conclusive data exists. The absence of
X-ray pulsations and exponential cut-off at ![]() 30 keV and the persistent
non-thermal emission favours the black-hole classification (R99). On the other
hand, the value of the mass function of the system
30 keV and the persistent
non-thermal emission favours the black-hole classification (R99). On the other
hand, the value of the mass function of the system
![]() (McSwain et al. 2001) and the characteristics of its accretion
mechanism (McSwain & Gies 2002) appear to be more consistent with
a neutron star companion.
(McSwain et al. 2001) and the characteristics of its accretion
mechanism (McSwain & Gies 2002) appear to be more consistent with
a neutron star companion.
In this work we present an analysis of the X-ray timing and spectroscopic
properties of RX J1826.2-1450 using the narrow field instruments on board the BeppoSAX
satellite. This observation permits us to derive a more accurate value of the
absorption to the source and study its long-term X-ray variability. We also
present optical spectroscopic observations around the H![]() line carried
out at the Skinakas Observatory.
line carried
out at the Skinakas Observatory.
![\begin{figure}
\par\includegraphics[width=8.8cm,clip]{3610f2.eps}
\end{figure}](/articles/aa/full/2003/25/aa3610/img15.gif) |
Figure 2: LECS energy spectrum of RX J1826.2-1450 and the best-fit model displayed in Table 1. |
| Open with DEXTER | |
LS 5039/RX J1826.2-1450 was observed by BeppoSAX on October 8, 2000 (JD 2451825.79-2451826.71)
for about 80 ks. BeppoSAX (Boella et al. 1997a) carried four
narrow field instruments (LECS, MECS, HPGSPC and PDS) and a wide field camera (WFC). Here we report on the results from the lower energy detectors: the
Low-Energy (LECS) and Medium-Energy (MECS) Concentrator Spectrometers. They
consisted of a set of four and three X-ray concentrators respectively together
with imaging gas scintillation proportional counter detectors located at the
focal planes. In the LECS (Parmar et al. 1997), one of these
detectors was sensitive to X-rays in the energy range 0.1-10 keV, while the
other three covered an energy range of 1.3-10 keV. The MECS (Boella et al.
1997b) operated in the energy range 1.6-10 keV. Each detector unit
provided a total collecting (geometrical) area of ![]() 124 cm2, an energy
resolution of <8.8% at 6 keV and a maximum time resolution of 16
124 cm2, an energy
resolution of <8.8% at 6 keV and a maximum time resolution of 16 ![]() s.
Note that one of the MECS became inoperative on May 9, 1997 due to a fault in
the unit's gas cell high voltage supply.
s.
Note that one of the MECS became inoperative on May 9, 1997 due to a fault in
the unit's gas cell high voltage supply.
Light curves and spectra were extracted from circular regions with a radius of 4![]() for both the LECS and the MECS instruments. We selected two
source-free regions (of radius 4
for both the LECS and the MECS instruments. We selected two
source-free regions (of radius 4![]() each) in the field of view, and
obtained a mean light curve in order to account for the instrumental
background. For the spectral analysis, the background was obtained from a
blank field using a region similar in size and position to the source
extraction region.
each) in the field of view, and
obtained a mean light curve in order to account for the instrumental
background. For the spectral analysis, the background was obtained from a
blank field using a region similar in size and position to the source
extraction region.
![\begin{figure}
\par\includegraphics[width=8.8cm,clip]{3610f3.eps}
\end{figure}](/articles/aa/full/2003/25/aa3610/img18.gif) |
Figure 3: MECS energy spectrum of RX J1826.2-1450 and the best-fit model displayed in Table 1. |
| Open with DEXTER | |
The X-ray intensity in the energy range 1.6-10 keV decreased with time from a
value of ![]() 0.06 MECS count s-1 at the beginning of the observation to
0.06 MECS count s-1 at the beginning of the observation to
![]() 0.03 MECS count s-1 at the end (Fig. 1). A fit to a constant
gave an unacceptable reduced
0.03 MECS count s-1 at the end (Fig. 1). A fit to a constant
gave an unacceptable reduced ![]() (>2). However, adding a linear term
with negative slope we obtained a reduced
(>2). However, adding a linear term
with negative slope we obtained a reduced
![]() .
An F-test gave a
probability of less than 0.7% that this improvement in the quality of the fit
could occur by chance. The flux variability occurs at higher energies. Below
.
An F-test gave a
probability of less than 0.7% that this improvement in the quality of the fit
could occur by chance. The flux variability occurs at higher energies. Below
![]() 3 keV the flux remains fairly constant (Fig. 1).
3 keV the flux remains fairly constant (Fig. 1).
Acceptable fits of the X-ray energy spectra were obtained with an absorbed
power-law model for both LECS (Fig. 2) and MECS
(Fig. 3). Table 1 shows the best-fit spectral
parameters. The power law was modified by a low-energy absorption
component of the form
![]() ,
where
,
where ![]() is the
equivalent hydrogen column density and
is the
equivalent hydrogen column density and ![]() the photoelectric
cross-section of Morrison & McCammon (1983). The power-law index
and the hydrogen column density have values of
the photoelectric
cross-section of Morrison & McCammon (1983). The power-law index
and the hydrogen column density have values of ![]() 1.8 and
1.8 and
![]()
![]() cm-2, respectively (see discussion in
Sect. 3.1). The LECS (0.1-5 keV) and MECS (1.6-10 keV)
absorbed X-ray luminosity was
cm-2, respectively (see discussion in
Sect. 3.1). The LECS (0.1-5 keV) and MECS (1.6-10 keV)
absorbed X-ray luminosity was
![]() erg s-1 and
erg s-1 and
![]() erg s-1, respectively, assuming a distance of 2.9 kpc
(Ribó et al. 2002).
erg s-1, respectively, assuming a distance of 2.9 kpc
(Ribó et al. 2002).
Optical spectroscopic observations were made with the 1.3 m telescope of the
Skinakas Observatory in Crete (Greece) on the night of July 26, 1999 and
September 10, 2002. The instrumental set-up consisted of a
![]() ISA
SITe CCD and a 1302 l mm-1 grating, giving a dispersion of
ISA
SITe CCD and a 1302 l mm-1 grating, giving a dispersion of ![]() 1 Å/pixel. The reduction of the spectra was made using the STARLINK Figaro package (Shortridge et al. 2001), while their analysis
was performed using the STARLINK Dipso package (Howarth et al.
1998).
1 Å/pixel. The reduction of the spectra was made using the STARLINK Figaro package (Shortridge et al. 2001), while their analysis
was performed using the STARLINK Dipso package (Howarth et al.
1998).
The wavelength coverage of the observations included the H![]() line
(
line
(
![]() Å). The strength of the stellar wind emission in H
Å). The strength of the stellar wind emission in H![]() provides information about the mass-loss rate in O-type stars (Puls et al.
1996 and references therein). The measurement of the equivalent width
of the H
provides information about the mass-loss rate in O-type stars (Puls et al.
1996 and references therein). The measurement of the equivalent width
of the H![]() line (EW(H
line (EW(H![]() )) in LS 5039 is hampered by the presence of
other stellar lines, especially He II
)) in LS 5039 is hampered by the presence of
other stellar lines, especially He II ![]() 6527. Nevertheless, when
the emission is low the main factor contributing to the uncertainty in the
equivalent width is the difficulty in obtaining the intensity of the
continuum. In Table 2 we give the values of EW(H
6527. Nevertheless, when
the emission is low the main factor contributing to the uncertainty in the
equivalent width is the difficulty in obtaining the intensity of the
continuum. In Table 2 we give the values of EW(H![]() )
as
contemporaneous as possible with the X-ray measurements.
)
as
contemporaneous as possible with the X-ray measurements.
The RXTE observation reported by R99 was not able to provide a reliable value
of the absorption to the source due to the insensitivity of the detectors to
X-rays below 2.5 keV, where most of the interstellar absorption of X-ray
photons takes place. The sensitivity of the BeppoSAX narrow field instruments
to X-rays below 2 keV, especially LECS, allows us to derive a more accurate
value of the hydrogen column density,
![]() cm-2. Assuming
E(B-V)=AV/3.1 (Rieke & Lebofsky
1985) the X-ray absorption can be converted into optical extinction
by means of the empirical relations of Predehl & Schmitt (1995),
to obtain
E(B-V)=1.8+0.7-0.5, or those of Ryter et al.
(1975) and Gorenstein (1975), to obtain
E(B-V)=1.5+0.6-0.4. These values of E(B-V) are considerably higher
than the unreliable value of
cm-2. Assuming
E(B-V)=AV/3.1 (Rieke & Lebofsky
1985) the X-ray absorption can be converted into optical extinction
by means of the empirical relations of Predehl & Schmitt (1995),
to obtain
E(B-V)=1.8+0.7-0.5, or those of Ryter et al.
(1975) and Gorenstein (1975), to obtain
E(B-V)=1.5+0.6-0.4. These values of E(B-V) are considerably higher
than the unreliable value of
![]() derived from the PCA/RXTE
observation (R99).
derived from the PCA/RXTE
observation (R99).
On the other hand, optical photometry of LS 5039 can be found in Drilling
(1991) and Lahulla & Hilton (1992) who gave a value
for the colour
![]() and Clark et al. (2001), who
reported
and Clark et al. (2001), who
reported
![]() .
Using the average of these values and assuming
an intrinsic colour index of
.
Using the average of these values and assuming
an intrinsic colour index of
![]() for an O6.5V star (Lejeune
& Scharer 2001) we obtain a colour excess of
for an O6.5V star (Lejeune
& Scharer 2001) we obtain a colour excess of
![]() .
The extinction obtained from the BeppoSAX observation is somehow higher
than (although statistically consistent with) that derived from the optical
observations. One explanation for this difference might be the fact that
the hydrogen column density is more sensitive to absorption by both
interstellar and intrinsic (i.e. in the vicinity of the X-ray source) matter,
while the optical indicators would mainly account for the interstellar
absorption. The presence of significant amounts of cold matter in the
surroundings of the system is supported by the detection of the relatively
strong iron (equivalent width of
.
The extinction obtained from the BeppoSAX observation is somehow higher
than (although statistically consistent with) that derived from the optical
observations. One explanation for this difference might be the fact that
the hydrogen column density is more sensitive to absorption by both
interstellar and intrinsic (i.e. in the vicinity of the X-ray source) matter,
while the optical indicators would mainly account for the interstellar
absorption. The presence of significant amounts of cold matter in the
surroundings of the system is supported by the detection of the relatively
strong iron (equivalent width of
![]() keV) emission line at 6.6 keV
in the 3-30 keV X-ray spectrum of LS 5039/RX J1826.2-1450 (R99). Unfortunately, due to limited
signal-to-noise ratio no line is detected in the BeppoSAX data.
keV) emission line at 6.6 keV
in the 3-30 keV X-ray spectrum of LS 5039/RX J1826.2-1450 (R99). Unfortunately, due to limited
signal-to-noise ratio no line is detected in the BeppoSAX data.
Table 1: Spectral fit results for the absorbed power-law model. Uncertainties are given 68% confidence for one parameter of interest.
Using the ephemeris of McSwain et al. (2001), the BeppoSAX
observation covers the orbital phase from 0.89 to 0.11. Note that this
observation took place just four days after the periastron date used by
these authors in their ephemeris, i.e., JD 2 451
![]() .
Consequently, our determination of the orbital phase is not strongly
affected by the lack of accuracy in the value of the orbital period
(
.
Consequently, our determination of the orbital phase is not strongly
affected by the lack of accuracy in the value of the orbital period
(
![]() days). Hence, periastron took place on
JD 2 451
days). Hence, periastron took place on
JD 2 451
![]() ,
or at
,
or at
![]() s in Fig. 1.
The epoch of inferior conjunction of the optical star, which would
correspond to the time of an X-ray eclipse, is 0.25 days after periastron
or at orbital phase 0.06 (McSwain et al. 2001), which
corresponds to JD 2 451
s in Fig. 1.
The epoch of inferior conjunction of the optical star, which would
correspond to the time of an X-ray eclipse, is 0.25 days after periastron
or at orbital phase 0.06 (McSwain et al. 2001), which
corresponds to JD 2 451
![]() ,
or to
,
or to
![]() s in
Fig. 1. The duration of a possible eclipse would last less than 0.2 days (
s in
Fig. 1. The duration of a possible eclipse would last less than 0.2 days (
![]() s) for
s) for
![]() ,
,
![]() and
and
![]() (shorter for a lower inclination and an eventual lower
mass for the primary) and hence it should have been detected by BeppoSAX.
(shorter for a lower inclination and an eventual lower
mass for the primary) and hence it should have been detected by BeppoSAX.
Although the light curve does not show statistical significant evidence for an eclipse, the variability increases between periastron and inferior conjunction, possibly indicating some kind of distortion of the stellar wind when the compact star finds itself at minimum distance from the primary. There is also a trend for the count rate to decrease as the source approaches inferior conjunction. This trend is detected at energies above 3 keV, but not at lower energies, contrary to what would be expected if this was due to a change in absorption, as it happens in Cygnus X-1 (Wen et al. 1999). Therefore, this decrease in the hard X-ray flux during the BeppoSAX observation is probably intrinsic, and may reflect changes in the accretion rate due to orbital motion.
The lack of eclipses allows us to set an upper limit on the inclination of the
system i. This implies, in the case of a spherical companion (no
photometric ellipsoidal modulation has been found to date), that
![]() ,
where
,
where
![]() is the radius of the optical companion an r is its distance to the compact object at inferior conjunction (phase 0.06). Assuming a mass of 40
is the radius of the optical companion an r is its distance to the compact object at inferior conjunction (phase 0.06). Assuming a mass of 40 ![]() and a radius of 10
and a radius of 10
![]() for an O6.5V
star (Howarth & Prinja 1989), the canonical mass for a neutron
star (1.4
for an O6.5V
star (Howarth & Prinja 1989), the canonical mass for a neutron
star (1.4 ![]() )
and the orbital parameters of McSwain et al.
(2001),
)
and the orbital parameters of McSwain et al.
(2001),
![]() and
and
![]() days, we
obtain an upper limit for the inclination of the system of
days, we
obtain an upper limit for the inclination of the system of
![]() ,
where the upper and lower values correspond to the range of eccentricities
given above. This inclination is consistent with the one, if, derived
from the mass function,
,
where the upper and lower values correspond to the range of eccentricities
given above. This inclination is consistent with the one, if, derived
from the mass function,
![]() (McSwain et al.
2001), for the same parameters, namely,
(McSwain et al.
2001), for the same parameters, namely,
![]() .
.
Note that OB stars in X-ray binary systems may be less massive than the
corresponding field stars of the same spectral type (Kaper 2001). A
decrease of the mass of the optical companion by about 10% reduces if to
![]() ,
while the upper limit hardly changes. On the other hand, assuming
,
while the upper limit hardly changes. On the other hand, assuming
![]() and the above mentioned orbital parameters Ribó et al.
(2002) derived an upper limit for the mass of the compact object of 9
and the above mentioned orbital parameters Ribó et al.
(2002) derived an upper limit for the mass of the compact object of 9 ![]() (in order to avoid breackup speed of the primary once
(in order to avoid breackup speed of the primary once
![]() is known). For a
is known). For a
![]() black-hole companion a similar analysis yields
black-hole companion a similar analysis yields
![]() and
and
![]() .
Similar values are obtained if we decrease
the mass of the optical companion by about 10%. In either case, the lack of
X-ray eclipses constrains the inclination of the system to values smaller than 70
.
Similar values are obtained if we decrease
the mass of the optical companion by about 10%. In either case, the lack of
X-ray eclipses constrains the inclination of the system to values smaller than 70![]() ,
which is clearly compatible with those found using the mass function
of the system.
,
which is clearly compatible with those found using the mass function
of the system.
Table 2:
X-ray flux and H![]() equivalent width measurements of LS 5039.
Errors in EW(H
equivalent width measurements of LS 5039.
Errors in EW(H![]() )
are
)
are
![]() 10%.
10%.
In order to study the long-term X-ray variability of LS 5039/RX J1826.2-1450 we obtained the
X-ray luminosity in the same energy ranges as given in previous missions. The
value of the ROSAT 1996 October 0.1-2.4 keV (Motch et al. 1997) and
the RXTE 1998 February 3-30 keV (R99) X-ray luminosities are 7.1 ![]() 1033 erg s-1 and
1033 erg s-1 and
![]() erg s-1, respectively.
The 0.1-2.4 keV X-ray luminosity obtained with LECS is
erg s-1, respectively.
The 0.1-2.4 keV X-ray luminosity obtained with LECS is
![]() erg s-1 and that obtained with MECS in the energy range 3-30 keV is
erg s-1 and that obtained with MECS in the energy range 3-30 keV is
![]() erg s-1 (derived assuming the model given in
Table 1). This observation took place in 2000 October. All values
are for an assumed distance of 2.9 kpc (Ribó et al. 2002). Clearly
the source was in a low-flux state during the BeppoSAX observation (about one
order of magnitude fainter) when compared to the epoch of the ROSAT and RXTE
observations. As explained above this low flux, however, cannot be accounted
for by invoking a partial X-ray eclipse. We have also inspected archival X-ray
data and found an ASCA observation of LS 5039/RX J1826.2-1450 made on 1999 October 4. We have
obtained the X-ray flux in the energy range 0.3-10 keV, shown in
Table 2, which is between the RXTE and BeppoSAX measurements. In
addition, a similar X-ray flux has been recently detected with CHANDRA
(Miller, private communication), and is also reported in Table 2.
erg s-1 (derived assuming the model given in
Table 1). This observation took place in 2000 October. All values
are for an assumed distance of 2.9 kpc (Ribó et al. 2002). Clearly
the source was in a low-flux state during the BeppoSAX observation (about one
order of magnitude fainter) when compared to the epoch of the ROSAT and RXTE
observations. As explained above this low flux, however, cannot be accounted
for by invoking a partial X-ray eclipse. We have also inspected archival X-ray
data and found an ASCA observation of LS 5039/RX J1826.2-1450 made on 1999 October 4. We have
obtained the X-ray flux in the energy range 0.3-10 keV, shown in
Table 2, which is between the RXTE and BeppoSAX measurements. In
addition, a similar X-ray flux has been recently detected with CHANDRA
(Miller, private communication), and is also reported in Table 2.
We also studied the long-term optical variability of the primary by
measuring the strength of the H![]() line. Table 2 shows the
values of the H
line. Table 2 shows the
values of the H![]() equivalent width together with the X-ray flux from
the missions that have observed LS 5039/RX J1826.2-1450. The H
equivalent width together with the X-ray flux from
the missions that have observed LS 5039/RX J1826.2-1450. The H![]() emission was weakest
during the BeppoSAX observation in October 2000 and strongest a few months
after the RXTE pointing in February 1998, when the X-ray emission was also
strong (since the line is in absorption, the smaller EW(H
emission was weakest
during the BeppoSAX observation in October 2000 and strongest a few months
after the RXTE pointing in February 1998, when the X-ray emission was also
strong (since the line is in absorption, the smaller EW(H![]() )
the
stronger the emission). Moreover, very similar EW(H
)
the
stronger the emission). Moreover, very similar EW(H![]() )
are found
contemporaneous to the ASCA and CHANDRA observations, as the detected
X-ray fluxes are, and also between the EW(H
)
are found
contemporaneous to the ASCA and CHANDRA observations, as the detected
X-ray fluxes are, and also between the EW(H![]() )
measurements
contemporaneous to the RXTE and BeppoSAX observations. Hence, there is a
trend in the sense that the lower the emission in H
)
measurements
contemporaneous to the RXTE and BeppoSAX observations. Hence, there is a
trend in the sense that the lower the emission in H![]() ,
the lower the
observed X-ray flux. All these results suggest that a decrease in the
mass-loss rate from the primary induces a decrease in the emitted X-ray
flux of the binary system. In this context, we propose that changes in the
mass-loss rate from the primary, reflected in the change of
EW(H
,
the lower the
observed X-ray flux. All these results suggest that a decrease in the
mass-loss rate from the primary induces a decrease in the emitted X-ray
flux of the binary system. In this context, we propose that changes in the
mass-loss rate from the primary, reflected in the change of
EW(H![]() ), can account for a change in the mass accretion rate onto
the compact object, and hence explain the detected changes in X-ray
luminosity.
), can account for a change in the mass accretion rate onto
the compact object, and hence explain the detected changes in X-ray
luminosity.
On the other hand, since this binary system has a high eccentricity, we cannot rule out a priori that the detected variations in the X-ray flux are not due to orbital variability. If the mass transfer in LS 5039/RX J1826.2-1450 occurs via the strong stellar wind of the optical primary then, given the high eccentricity of the system, some variations in the X-ray luminosity with the orbital phase should be expected. The fraction of the stellar wind captured by the compact object depends on its velocity relative to the wind. Also, variations in the density of the wind may produce changes in the amount of absorption material throughout the orbit giving rise to the X-ray flux variations. Orbital flux variations have been seen in many high-mass X-ray binaries powered by stellar wind accretion: 4U 1700-37 (Haberl & Day 1992), GX 301-2 (Haberl 1991), Vela X-1 (Haberl & White 1990), 4U 1907+09 (Marshall & Ricketts 1980). With its small orbit and early-type optical primary LS 5039/RX J1826.2-1450 is expected to share many similarities with these systems.
However, a purely Bondi-Hoyle accretion model (Bondi 1952) does
not reproduce the observations. Figure 4 shows the expected
variability of the X-ray luminosity in LS 5039/RX J1826.2-1450 using a spherically symmetrical
Bondi-Hoyle accretion model. For each orbital phase and using the formulae
given in the Appendix, we computed the binary separation, the orbital and wind
velocities, the relative velocity, the wind density, the accretion rate and
finally the X-ray luminosity. We note that this is a bolometric unabsorbed
X-ray luminosity, to be compared to the much lower observed luminosity in the
range 1.6-10 keV (top panel of Fig. 1). Although this discrepancy
could also be caused by the lack of precise knowledge of the parameter values
used in the model, there are two strong arguments against this model. First,
we should expect a variation in flux of at least a factor of 2 within the
phase interval of the BeppoSAX observations as follows: starting with a
gradual rise, peaking smoothly around phase 0.02 (![]()
![]() s in
Fig. 1) and ending with a gradual decrease. Second, since the BeppoSAX
observation took place during periastron the X-ray luminosity should be the
largest, contrary to what it is observed (see Table 2).
s in
Fig. 1) and ending with a gradual decrease. Second, since the BeppoSAX
observation took place during periastron the X-ray luminosity should be the
largest, contrary to what it is observed (see Table 2).
Although it is clear that detailed observations covering a full orbital period
are needed in order to better study and model the orbital X-ray variability of LS 5039, it seems unlikely that it can be responsible for the
variations of one order of magnitude quoted in Table 2. Therefore, we
conclude that this variability may be due to changes in the stellar wind
mass-loss rate on longer timescales.
![\begin{figure}
\par\includegraphics[width=8.8cm,clip]{3610f4.eps}\end{figure}](/articles/aa/full/2003/25/aa3610/img76.gif) |
Figure 4:
Expected variability of the X-ray luminosity in LS 5039
due to the significantly eccentric orbit of the compact companion around
the O6.5V((f)) star with a period
|
| Open with DEXTER | |
The main conclusions of the analysis of our BeppoSAX observation of the microquasar LS 5039/RX J1826.2-1450 can be summarized as follows:
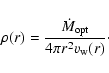
An order of magnitude estimate of the orbital X-ray variability can be
obtained using the Bondi-Hoyle accretion model. The accretion luminosity is
then computed by means of the simple formula:
![$\displaystyle {v_{\rm rel}^2(r) = \left[\frac{n a^2}{r} \sin{E} + v_{\rm w}(r) \cos{V} \right]^2 }$](/articles/aa/full/2003/25/aa3610/img97.gif) | |||
![$\displaystyle {~~~~~~~~~}+\left[ \frac{n a^ 2 \sqrt{1-e^2}}{r} \cos{E} - v_{\rm w}(r) \sin{V} \right]^2,$](/articles/aa/full/2003/25/aa3610/img98.gif) |
(5) | ||
Acknowledgements
We are grateful to J. Miller for permission to include in this paper unpublished results from his CHANDRA observation. We are also grateful for useful comments and suggestions from the anonymous referee. P.R. is a researcher of the programme Ramón y Cajal funded by the University of Valencia and Spanish Ministery of Science and Technology. M.R., J.M.P. and J.M. acknowledge partial support by DGI of the Ministerio de Ciencia y Tecnología (Spain) under grant AYA2001-3092, as well as partial support by the European Regional Development Fund (ERDF/FEDER). During this work, M.R. has been supported by a fellowship from CIRIT (Generalitat de Catalunya, ref. 1999 FI 00199). J.M. has been aided in this work by an Henri Chrétien International Research Grant administered by the American Astronomical Society, and has been partially supported by the Plan Andaluz de Investigación of the Junta de Andalucía (ref. FQM322). Skinakas Observatory is a collaborative project of the University of Crete, the Foundation for Research and Technology-Hellas and the Max-Planck-Institut für Extraterrestrische Physik.

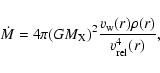
![\begin{displaymath}v_{\rm w}(r) = v_{\infty} \left[1- \frac{R_{\rm opt}}{r}\right]^{\beta}\cdot
\end{displaymath}](/articles/aa/full/2003/25/aa3610/img91.gif)