A&A 404, 677-687 (2003)
DOI: 10.1051/0004-6361:20030507
High resolution spectroscopy of HD 207538 from Far-UV (FUSE) to Visible (SARG-TNG)
A global picture of the stellar and interstellar features modeled
G. Catanzaro1 - M. K. André2
- F. Leone1 - P. Sonnentrucker3
1 - INAF - Catania Astrophysical Observatory,
Via S. Sofia 78, 95123 Catania, Italy
2 -
Institut d'Astrophysique de Paris, CNRS, 98bis boulevard Arago, 75014 Paris, France
3 -
The Johns Hopkins University, Center for Astrophysical Sciences, 3400 N. Charles St.,
Baltimore, MD 21218-2695, USA
Received 20 December 2002 / Accepted 31 March 2003
Abstract
We present a detailed study of the suspected Chemically Peculiar star HD 207538 based on high resolution
spectroscopy in the far Ultraviolet (1000-3350 Å) and visible (4600-7000 Å) ranges.
The stellar abundance synthesis analysis was performed by using Kurucz's codes ATLAS9 and SYNTHE
to compute the atmospheric model and the synthetic spectrum respectively.
Observations were obtained with the Far Ultraviolet Spectroscopic
Explorer, the International Ultraviolet Explorer satellites whereas the
optical spectrum was collected with the ground-based Telescopio Nazionale Galileo telescope.
With our analysis we refine the value of the rotational velocity to
 km s-1 and the microturbulence velocity to
 km s-1. The stellar abundances
inferred in this study show that C, N, O, Al, Si, P, S and Mn are compatible with the standard solar abundances,
within the experimental errors. On the other hand, Fe, Ni and Zn are definitively
underabundant. We also show that the helium content is comparable to the typical abundance of B-type stars.
km s-1. The stellar abundances
inferred in this study show that C, N, O, Al, Si, P, S and Mn are compatible with the standard solar abundances,
within the experimental errors. On the other hand, Fe, Ni and Zn are definitively
underabundant. We also show that the helium content is comparable to the typical abundance of B-type stars.
Because this spectrum is rich in stellar and interstellar features, we computed
simultaneously a synthetic spectrum of the stellar and interstellar lines in order to
disentangle the different absorption contributions. We thus also determined the column densities of
several interstellar elements (Fe II, N I, P II, H I,
H2, HD, CO, Cl I and Ar I) present in the gas in front of the star.
Although several components are present along this sightline, our results suggest the presence of some
translucent interstellar gas among the diffuse components.
With this work, we demonstrate that it is possible to perform a stellar spectroscopic analysis
from the far-UV to visible spectral range, with consistent results in both ranges within errors, based on one
single atmosphere model.
Key words: stars: individual: HD 207538 - stars: abundances - stars: atmospheres
- ultraviolet: stars - ISM: abundances - ISM: lines and bands
The most commonly used code to compute stellar atmosphere models is ATLAS (Kurucz 1993).
These models correctly reproduce the observed flux distribution from the UV to the visible range
and match the Balmer line profiles not only for solar composition stars (Castelli & Kurucz 1994)
but also for magnetic Chemically Peculiar (CP) stars (Leone & Manfrè 1996).
Recently ATLAS models have been also used to interpret the far-UV spectrum of stars.
However, several authors (i.e. Chavez et al. 1995; Buss et al. 1995; Morales et al. 2001; Frémat et al. 2002) concluded that the Kurucz LTE atmospheric models fail
in reproducing the temperature distribution of the outermost layers. In particular, these models seem to
underestimate the stellar fluxes between Ly and Ly
 .
Dixon & Hurwitz (1998) noted this
behavior in their model and suggested that these discrepancies may be due to abundance anomalies or non-LTE
effects.
.
Dixon & Hurwitz (1998) noted this
behavior in their model and suggested that these discrepancies may be due to abundance anomalies or non-LTE
effects.
Within our program dedicated to the study of CP stars carried out with high resolution spectroscopy,
we have observed the suspected CP star HD 207538 (Renson 1991).
This star was also observed with the International Ultraviolet Explorer (IUE) and the Far
Ultraviolet Spectroscopic Explorer (FUSE) satellites. By combining these archive far-UV data with our
optical spectra, we test the capability of Kurucz LTE codes to model the observed spectra of
HD 207538 from the far-UV to visible range with a single set of atmosphere stellar parameters.
In the spectral range covered by FUSE, (912-1188 Å), the contamination
due to the interstellar lines is important. We thus also performed a detailed study of the interstellar
medium in order to obtain a global synthetic model in the far-UV combining both stellar and interstellar models.
In Sect. 2, we summarize the results obtained prior to this work on the CP star HD 207538. Section 3 describes
the observations and data reductions. The results of the stellar and interstellar analyses are given in
Sects. 4 and 5, respectively. Our concluding remarks are given in Sect. 6.
HD 207538 is a B0V star belonging to the Cep OB2 association at
 pc from the Sun
(De Zeeuw et al. 1999). Recent studies on the chemical abundances of metals in OB
star members of Cep OB2 led Daflon et al. (1999, 2001) to conclude that
the chemical composition in the association is homogeneous and underabundant with respect to
the Sun by roughly 0.3 dex. In the specific case of HD 207538, they also concluded that the N,
O and Si abundances are similar to the solar values.
pc from the Sun
(De Zeeuw et al. 1999). Recent studies on the chemical abundances of metals in OB
star members of Cep OB2 led Daflon et al. (1999, 2001) to conclude that
the chemical composition in the association is homogeneous and underabundant with respect to
the Sun by roughly 0.3 dex. In the specific case of HD 207538, they also concluded that the N,
O and Si abundances are similar to the solar values.
HD 207538 is reported in the General Catalogue of Ap and Am stars (Renson 1991)
as a CP candidate star with helium overabundance.
The main observational characteristics of CP stars are the spectral, photometric and magnetic
variations with a common period. According to the Oblique Rotator Model (Stibbs 1950)
this period is simply the rotational period and variations are due to the non-homogeneous distribution
of elements on the stellar surface.
The helium peculiar stars are known to show not only spectral variability but also photometric
variability (Peterson 1966). However, Vetö et al. (1980) found that HD 207538
shows no periodic light variability. Our own investigation of the Hipparcos photometric data (spanning 1132 days),
using the Phase Dispersion Method (Stellingwerf 1978) as coded in the NOAO/IRAF package, does not
indicate any evidence of variability either. Therefore, the peculiar nature of this star is not yet firmly
established photometrically.
The spectra analyzed in this paper have been acquired with the following instruments depending
on the wavelength range.
On August 10, 2000, we obtained an echelle spectrum of HD 207538 with the high resolution spectrograph
(SARG) (Gratton et al. 2003) and the 3.55m Telescopio Nazionale Galileo (TNG)
at the Observatorio del Roque de los Muchachos (La Palma, Spain).
Covering the region from 4600 to 7000 Å, our stellar spectrum calibrated in wavelength
and normalized in flux, was obtained using standard reduction procedures for spectroscopic observations
within the IRAF package. The calibration lamp lines show that the achieved
resolving power is R=115 000 and the S/N ratio is between 60 and 100.
Equivalent widths have been measured with a Gaussian fit of each line using standard IRAF routines.
As the main source of errors on the equivalent width measurements is the uncertain position
of the continuum, we estimated the error to be equal to half the area of a box as wide as the line
and with a height equal to rms of the continuum.
In order to check the possible spectral variability, on October 19, 2002, we obtained a second
spectrum of HD 207538 with the 91 cm telescope equipped with the REOSC echelle spectrograph of
the Catania Astrophysical Observatory. The region covered by our spectrum is 4820-5670 Å at
R=13 000 resolution. Data reduction was also performed by means of IRAF package, and the final
normalized spectrum shows that the S/N ratio was between 100-150.
3.2 IUE spectral range (
 1150-3350 Å)
The IUE spectra of HD 207538 processed with the NEWSIPS reduction method have been taken from the
INES Final Archive data. The images consist of four high dispersion spectra, two of which have been
obtained with the Short-Wavelength Prime (SWP: 1150-2000 Å) while the two others have been
obtained with the Long-Wavelength Redundant (LWR: 1850-3000 Å) cameras (see Table 1 and
Nichols & Linsky 1996).
After an accurate check of the flux constancy, we manually coadded all these observations obtaining
a unique spectrum which covers the 1150-3350 Å interval. The resulting S/N ratio was about 20. No evidence
of the flux variability characterizing CP stars (Leckrone 1974) was found.
Table 1:
Journal of observations concerning the IUE spectra used in this study.
![\begin{figure}
\par\includegraphics[width=8.9cm,height=8.5cm]{H4193F1.ps}
\end{figure}](/articles/aa/full/2003/23/aah4193/Timg15.gif) |
Figure 1:
Observed (thick line) and computed (thin line, R = 100) flux distribution
of HD 207538. The ATLAS9 atmosphere model
has been computed assuming
 K, K,
 ,
solar metal opacity and
microturbulence velocity equal to 8.0 km s-1. Because of the presence of large absorption
due to the interstellar medium, FUSE data are averaged within 2 Å-width bands centered
at the highest values of the flux distribution in order to visualize the differences between the
observed and computed spectra (filled squares). The extinction bump at ,
solar metal opacity and
microturbulence velocity equal to 8.0 km s-1. Because of the presence of large absorption
due to the interstellar medium, FUSE data are averaged within 2 Å-width bands centered
at the highest values of the flux distribution in order to visualize the differences between the
observed and computed spectra (filled squares). The extinction bump at  2175 Å is clearly
visible on this plot. 2175 Å is clearly
visible on this plot. |
| Open with DEXTER |
The FUSE satellite and the spectrograph
mounted on board were described by Moos et al. (2000) and Sahnow et al. (2000).
HD 207538 was observed in time-tag mode on 8th December 1999. This early-type star, shining through
interstellar clouds with a total reddening
E(B-V)= 0.64 and a total extinction
Av=1.43
(Snow et al. 2002), is bright enough to allow a good S/N ratio. The foreground dust and gas show
large column densities of many atomic and molecular species. The FUSE spectra were extracted from 4
sub-exposures totalizing 7736 s using the large aperture (LWRS) with the CALFUSE (Version 1.8.4) standard
reduction pipeline which provided us with flux and wavelength calibrated spectra.
The processing steps included data screening, thermal drift correction, geometric distortion correction,
Doppler correction to heliocentric wavelength, dead time correction and wavelength calibration. The resolving
power was R=15 000. These spectra were then coadded and binned over 4 pixels (less than one
resolution element), using both exposure time and error weighting, to obtain a S/N ratio of 15
per resolution element. Strong interstellar extinction and misalignment of
the SiC channels prevented us, however, from using data shortward of 1000 Å.
Usually, spectral synthesis is performed assuming a pre-computed atmosphere model whose parameters are
often fixed from photometric indices. In a previous paper (Leone & Manfrè 1996), we have
discussed the importance of consistency between the parameters adopted for computing the atmosphere
model and the determined parameters. As to CP stars, a correct metal opacity is fundamental in determining
the stellar effective temperature and gravity.
In the case of a hot star, like HD 207538, particular attention has to be payed to the microturbulence.
Large values for this velocity can significantly
desaturate metal lines and increase the metal opacity
with respect to a more static atmosphere.
Several steps are necessary to determine the stellar parameters such as the effective temperature,
gravity, abundances and microturbulence. In our analysis, following the method described in
Leone & Manfrè (1996), we have used an iterative process to determine the stellar parameters.
To compute the stellar atmosphere model of HD 207538, we used version 9 of ATLAS (Kurucz 1993).
This code includes the metal opacity by means of distribution functions that are tabulated for multiples of the
solar metallicity and for various microturbulent velocities. So that, metal opacity scale and microturbulence
velocity adopted to compute the atmosphere model have to be consistent with the derived abundances, measured
microturbulence, effective temperature and gravity.
Prior to the model calculation with ATLAS9, the atmosphere is divided up in a number of layers
starting from a fixed Rosseland optical depth. Because of the very large spectral range we intend to model,
a check that all identified spectral lines, in the far-UV and visible ranges,
are formed within the adopted limits is performed. We chose to divide the atmosphere into the maximum (99) number
of layers from
 to 3.12.
![\begin{figure}
\par\includegraphics[angle=-90,width=16.4cm,clip]{H4193F2.ps}
\end{figure}](/articles/aa/full/2003/23/aah4193/Timg18.gif) |
Figure 2:
Comparison between theoretical (smoothed line) and observed spectra in the visible range
4625-4720 Å (top panel) and
 -5750 (bottom panel). In each
panel we label the identified lines. -5750 (bottom panel). In each
panel we label the identified lines. |
| Open with DEXTER |
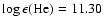
Abundances have been derived by means of WIDTH9 (Kurucz 1993) and the microturbulent velocity determined,
imposing that the oxygen abundance is independent of the equivalent widths measured for seven
O II of the
visible range and three O III of the far UV.
At the end of the iterative procedure, where the UV-Visible flux overall distribution and the H wings
were matched, we found that the effective temperature (
wings
were matched, we found that the effective temperature (
 K) and the gravity
(
)
determined by Daflon et al. (1999) agree and can be
adopted. In contrast we found
K) and the gravity
(
)
determined by Daflon et al. (1999) agree and can be
adopted. In contrast we found
 km s-1,
a microturbulence velocity slightly smaller that the 10 km s-1 fixed by the same authors.
km s-1,
a microturbulence velocity slightly smaller that the 10 km s-1 fixed by the same authors.
Using the adopted effective temperature and gravity we computed the synthetic spectrum that
reproduces the observed UV flux distribution.
The synthetic spectrum was computed with SYNTHE (Kurucz & Avrett 1981) from 1000 to 7000 Å
and converted to absolute flux, by means of the relation
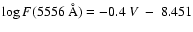 where
V = 7.31 is the magnitude quoted in the SIMBAD database.
where
V = 7.31 is the magnitude quoted in the SIMBAD database.
Dereddening of the observed spectra has been performed following Cardelli et al. (1989)
assuming
E(B-V) = 0.68, a value not far from the 0.64 value given by Snow et al. (2002).
Figure 1 shows the observed and computed spectra. We note that the computed spectrum represents well
the IUE flux distribution and the FUSE spectrum for wavelengths shorter than 1100 Å. However,
the FUSE flux for wavelengths longer than 1100 Å, is larger than the computed one. We found no
combination of effective temperature, gravity and dereddening able to match the overall flux distribution
from 900 to 3350 Å. In particular, the apparent flat flux distribution recorded
by FUSE could not be reproduced.
Differences between the observed and computed spectra are largest around 1150 Å, where they amount
up to 20%. It is tempting to conclude that ATLAS9 models are not able to reproduce FUSE data.
However there are other possible causes that need to be addressed as well:
- the S/N ratio of our spectrum is
 15, so the continuum is determined with an error of about 6%;
- dereddening at the FUSE wavelengths is an extrapolation of a law defined only for wavelengths longer
than 1250 Å;
- absolute calibration flux of FUSE data is based on model-atmosphere predictions of the spectra of
well-studied white-dwarf stars (Sahnow et al. 2000) and is expected to be accurate at the 10% level.
Moreover, we know that the instrument's sensitivity was nearly constant for the first two years of the
mission and that it has later declined by about 10%. So a further few percent uncertainty is expected in the
flux calibration.
A synthetic spectrum covering the observed optical range was calculated with SYNTHE
(Kurucz & Avrett 1981) and convolved with a Gaussian profile to match the instrumental
resolution. To identify spectral lines and to derive abundances we adopted the atomic parameters from the
Kurucz (1993) line list. The rotational velocity has been determined by matching the line profiles
of three unblended O I lines (O I
 ,
4661.643 and 4676.244 Å),
one N III line (4634.126 Å) and one Si IV line (4654.312 Å). The obtained value
,
4661.643 and 4676.244 Å),
one N III line (4634.126 Å) and one Si IV line (4654.312 Å). The obtained value
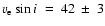 km s-1 is slightly less than the value of 47 km s-1 inferred
by Penny (1996) for HD 207538.
km s-1 is slightly less than the value of 47 km s-1 inferred
by Penny (1996) for HD 207538.
In Fig. 2, we report the comparison between the synthetic and observed spectrum
for the richest spectral regions: the 4625-4720 Å and 5650-5750 Å windows containing a number
of metallic lines due to C, N, O, Si and Al at various stages of ionization.
For comparison with the observations, the theoretical spectra was convolved with the
instrumental profile and the rotational velocity.
With the exception of helium that we will discuss in the next subsection, solar standard abundances
(Grevesse et al. 1996) are sufficient to reproduce all the metalic lines
present in Fig. 2. Errors have been estimated to be 0.2 dex. Adopting the opacity distribution
function for solar abundances to compute the atmosphere model is therefore justified.
![\begin{figure}
\par\includegraphics[width=8.2cm,clip]{H4193F3.ps}
\end{figure}](/articles/aa/full/2003/23/aah4193/Timg27.gif) |
Figure 3:
Helium lines observed (dotted line) in the visible spectrum of HD 207538. For each line
we overplotted the corresponding synthetic profile (solid/red curve). |
| Open with DEXTER |
4.3.1 Helium lines
In our optical spectrum of HD 207538, we identify nine unblended helium lines (two He II and seven He I),
whose measured equivalent widths are listed in Table 2. These lines were previously measured by
Conti & Alschuler (1971 He II4686 Å), Mathys (1989), Grigsby et al.
(1992); other measurements have been carried out by Conti (1973, 1974) for the
He I5876 Å and the He I6678 Å. Within experimental errors, all these
measurements are in agreement with ours.
As reported by Conti (1974), we confirm that the profile of He II5411 Å
is strongly distorted by an asymmetry toward the blue wing of the line. This feature is still visible even
in our low resolution spectrum taken at Catania Astrophysical Observatory.
Profiles of helium lines were computed in the LTE approximation for a variety of He/H ratios with the
adopted model atmosphere by using the program SYNTHE and a consistent ATLAS9 model.
The abundance that best fits the He lines on average is
 (Fig. 3).
The three lines for which we were not able to obtain a good synthetic profile are the He I
5876, 6678 and 7065 Å. The derived helium abundance seems to be larger than the solar
value, however the difficulty in converting the observed equivalent widths of helium lines
to abundances
is a well known problem since the work of Auer & Mihalas (1972). Particularly, Gies & Lambert
(1992) found that in stars with effective temperature larger than 30 000 K, helium appears to be
overabundant with respect to the Sun.
(Fig. 3).
The three lines for which we were not able to obtain a good synthetic profile are the He I
5876, 6678 and 7065 Å. The derived helium abundance seems to be larger than the solar
value, however the difficulty in converting the observed equivalent widths of helium lines
to abundances
is a well known problem since the work of Auer & Mihalas (1972). Particularly, Gies & Lambert
(1992) found that in stars with effective temperature larger than 30 000 K, helium appears to be
overabundant with respect to the Sun.
Table 2:
Equivalent widths of the helium lines measured with the SARG-TNG and at Catania Astrophysical
Observatory (last two columns). We compared our measurements with the B-type stars of similar
effective temperature extracted from Gies & Lambert (1992). All equivalent widths
are expressed in mÅ.
To overcome the difficulties resulting from the spectral modeling, we compared our measurements of equivalent
widths with the values reported by Gies & Lambert (1992) for stars with similar effective temperature
and gravity (Table 2). The equivalent widths we measured for the He I lines are only slightly
larger than those derived by Gies & Lambert (1992) and this discrepancy does not
seem significant enough to conclude that HD 207538 is a helium peculiar star.
The situation of the He II4686 Å line is more complicated
since some kind of erratic
behavior of the equivalent width versus effective temperature has been reported. In any case, the mean value
of the helium abundance calculated by Gies & Lambert in the LTE approximation for these stars is
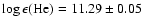 ,
a value consistent with our estimation, within errors.
,
a value consistent with our estimation, within errors.
To verify if spectral variability exists, we measured the equivalent width of the helium lines present in our
two visible spectra. The equivalent widths of these lines obtained with both telescopes were reported in
Table 2. According to our measurements and the quoted
literature studies no helium spectroscopic
variability has been detected, confirming the non peculiar nature of HD 207538.
In an attempt to reproduce the spectrum recorded by IUE, we computed the photospheric spectrum
with the same parameters used for the optical data, after broadening it by the rotational velocity
and by the instrumental resolving power of R=7500, corresponding at 1500 Å to the nominal resolution
 0.2 Å.
In Fig. 4 we show the comparison between the synthetic spectrum and the observations in three intervals.
With a few exceptions, most of the spectral lines are quite well reproduced.
In the IUE range we identified one Ni IV line at 1398.193 Å and two Mn IV lines at
1664.772 Å and 1666.981 Å. The former has been reproduced with an underabundance
of 0.45 dex with respect to the standard value, the latter on the contrary are compatible with a normal abundance.
Noteworthy is the fact that the He II 1640 Å line is well reproduced with the helium abundance
computed in the previous section. Other lines, such as those generated by iron, silicon and zinc, have been modeled
using the photosperic abundances computed for the FUSE spectrum (see next section). As to carbon and aluminum,
we used the abundances computed in the previous section for the SARG-TNG data.
![\begin{figure}
\par\includegraphics[width=8.3cm,clip]{H4193F4.ps}
\end{figure}](/articles/aa/full/2003/23/aah4193/Timg46.gif) |
Figure 4:
Comparison between theoretical and observed spectra in the IUE range selected
(
1380-1670) Å. In each panel we label the identified lines. ISM lines
have been marked with arrows. |
| Open with DEXTER |
A contamination due to interstellar matter is present in these intervals. In Fig. 4 we marked with
arrows the lines we identified using the list of ISM lines that occur in the IUE range published by
St-Louis & Smith (1991).
IUE provides us with further evidence of the absence of variability as no differences exist between the flux
of spectra obtained at different dates (see Sect. 3.2).
To compute the synthetic spectrum in this wavelength region, we used the abundances inferred from
the SARG-TNG data for those elements present in both intervals, and we determined the
abundance for those elements whose lines are not present in the optical region, by matching the profiles
observed in the FUV range.
To take into account the large number of interstellar lines the computed photospheric spectrum
has been multiplied by the ISM model (see next section) and then compared with the observation.
Solar standard abundances were found compatible, within the experimental
errors, with the line profiles observed for CNO elements and for Si III, Si IV, P IV, P V
and S IV. On the other hand, underabundances were estimated for iron and zinc. Standard abundances predict
the presence of a Cl IV line at 1123.785 Å, not observed in our data. In Figs. 7
and 8 we show the comparison between the synthetic and the observed spectrum.
Inferred abundances are reported in Table 3 where they are compared with those calculated by
Daflon et al. (1999), Gies & Lambert (1992) and the Sun (Grevesse et al. 1996).
Departures from LTE can affect the inferred chemical abundances. The magnitude of non-LTE corrections
has been investigated by Daflon et al. (1999) for a sample of stars in Cep OB2 association.
They found that these corrections are generally of the order of 0.1 dex or even smaller. In particular,
for carbon and oxygen they found the corrections are negligible.
Table 3:
Abundances derived for HD 207538 expressed in the usual
form
 (El) compared
with those estimated by Daflon et al. (1999) (Col. 3),
by Gies & Lambert (1992)
(Col. 4) and the Sun (Grevesse et al. 1996, Col. 5).
Errors have been estimated to be
0.2 dex.
(El) compared
with those estimated by Daflon et al. (1999) (Col. 3),
by Gies & Lambert (1992)
(Col. 4) and the Sun (Grevesse et al. 1996, Col. 5).
Errors have been estimated to be
0.2 dex.
5 Interstellar spectrum analysis
The ISM analysis was conducted with the profile fitting software OWENS described in
Hébrard et al. (2002). This software allows us to perform multiple fits simultaneously
combining several spectral windows and several species. By combining different species
with different masses, this procedure makes it possible to have a good handle on the
interstellar thermal and turbulent broadenings along the sightline. With the help of the stellar model, we
first selected in the spectrum the ISM absorption lines which were not blended with any known stellar
features. The f-values used for FeII are the revised from Howk et al. (2000) and, for all the
other atomic species, the f-values are from Morton (1991) and Welty (1999). We adopt
wavelengths, oscillator strengths, and damping constants for the molecular hydrogen transitions from
Abgrall et al. (1993) for the Lyman system and from Abgrall et al. (1993) for the
Werner system.
![\begin{figure}
\par\includegraphics[width=7.8cm,clip]{H4193F5.ps}
\end{figure}](/articles/aa/full/2003/23/aah4193/Timg52.gif) |
Figure 5:
Fits of the Na I absorption lines. Three components are detected, the central components represents
more that 99% of the total column density:
 cm-2. cm-2. |
| Open with DEXTER |
A detailed interstellar velocity structure was inferred from visible Na I data at high resolution
(
 000). Fits to the Na I line profiles indicate at least 3 components as shown in
Fig. 5. The two weaker components are clearly separated at the resolution of the instrument and
centered at -14 km s-1 and -19 km s-1 relative to the dominant component with respective
Doppler broadenings (or b-values) of 3 and 2 km s-1. The total column density for these two
components is of the order of a few times 1012 cm-2 which represents only 1% of the total
Na I column. The strong
saturation of the dominant Na I component and the low resolution of the FUSE data do not
allow us to determine its velocity structure unambiguously. High-resolution data are required to accurately
determine the total number of components present along the sightline.
000). Fits to the Na I line profiles indicate at least 3 components as shown in
Fig. 5. The two weaker components are clearly separated at the resolution of the instrument and
centered at -14 km s-1 and -19 km s-1 relative to the dominant component with respective
Doppler broadenings (or b-values) of 3 and 2 km s-1. The total column density for these two
components is of the order of a few times 1012 cm-2 which represents only 1% of the total
Na I column. The strong
saturation of the dominant Na I component and the low resolution of the FUSE data do not
allow us to determine its velocity structure unambiguously. High-resolution data are required to accurately
determine the total number of components present along the sightline.
Lacour et al. (2003) reported four CH components along this sightline coinciding with the core
of the strong Na I absorption. Additional components are however necessary to fit the Na I
profile. Subsequently, in order to account for potential saturation effects due to narrow components we
considered a total of 6 components in our velocity structure: 4 components associated with the CH absorptions
and 2 additional atomic components as seen in the Na I profile. Note however that other hidden atomic
components might still be present in the core of the Na I escaping detection due to insufficient resolution.
We performed a six-component profile fitting for the atomic species seen in absorption:
Fe II, P II, O I, N I, and Ar I. Because most of these
atomic lines are saturated and because of the moderate resolution of the FUSE
spectrograph ( 20 km s-1), it is not possible to retrieve the information on
the velocity structure from the FUSE data itself.
Thus, the velocities of each component
are constrained as described in the previous subsection
and are not free parameters in the fit.
In particular, the relative ratios of the four stronger components were fixed to values
derived from the high-resolution CH absorption line profiles.
The fitting was performed simultaneously over 22 spectral FUSE windows.
Results are shown in Fig. 6 and Table 4.
20 km s-1), it is not possible to retrieve the information on
the velocity structure from the FUSE data itself.
Thus, the velocities of each component
are constrained as described in the previous subsection
and are not free parameters in the fit.
In particular, the relative ratios of the four stronger components were fixed to values
derived from the high-resolution CH absorption line profiles.
The fitting was performed simultaneously over 22 spectral FUSE windows.
Results are shown in Fig. 6 and Table 4.
The Ly
H I line is too severely blended by molecular hydrogen to
be of any help in determining the total H I column density. Moreover, the Ly
H I
line is saturated and therefore does not constitute a sensitive probe for the column density. Thus we simply
report here the value derived by Rachford et al. (2002) (see Table 4) using a canonic
relation between the extinction, H2, and H I. The resulting profile seems to adequately fit our data
especially in the 1026 and 1030 Å windows.
Our determination of the interstellar oxygen abundance is based on the profile
of the 1039 Å line. The O/H ratio of 240
+200-100 ppm that we derive is
consistent within 1 with the newly revised interstellar oxygen gas phase
abundance
(André et al. 2003) of 408 ppm. However, the fact that our mean value lies well below the
adopted interstellar abundance likely indicates a larger depletion along this sightline.
Such enhanced depletion has been reported by Cartlege et al. (2001) toward reddened stars
with E(B-V) similar to HD 207538.
with the newly revised interstellar oxygen gas phase
abundance
(André et al. 2003) of 408 ppm. However, the fact that our mean value lies well below the
adopted interstellar abundance likely indicates a larger depletion along this sightline.
Such enhanced depletion has been reported by Cartlege et al. (2001) toward reddened stars
with E(B-V) similar to HD 207538.
![\begin{figure}
\par\includegraphics[width=7.5cm,clip]{H4193F6.ps}
\end{figure}](/articles/aa/full/2003/23/aah4193/Timg56.gif) |
Figure 6:
Comparison of elemental abundances with respect to hydrogen in the standard
logarithmic scale (Grevesse & Sauval 1998). Open diamonds represent the measurements
toward HD207538 and black diamonds represent the solar references. |
| Open with DEXTER |
The nitrogen column density was derived from the 1134 Å triplet. It is usually known that N I
is not depleted onto grains and we indeed find a N/H ratio close to the solar value of 83 ppm
(Grevesse & Sauval 1998) although with very large error bars:
 ppm.
ppm.
As expected for a refractory element, iron is found to be depleted by about 2 dex compared to the
solar value which is a further hint toward a large grain population along this sightline. Noteworthy
is the Fe II column density which is well constrained by the use of the relatively weak transition at
1127 Å.
Being a noble gas, Ar I is not
expected to be severely depleted onto grains. But based on the 1048 Å line, we derive
a surprising super solar abundance for Ar I. This high value may well be due to the
blending of the interstellar line with an unpredicted stellar line.
The case of Cl I deserves a particular attention for it is not expected to arise
in the diffuse atomic components but in gas components with optically thick molecular hydrogen lines
(Jura 1974). It is therefore expected that Cl I coexists with the molecular content along
the sightline. We therefore used the velocity structure derived from the molecular components (CH) to fit
the few Cl I lines for which accurate f-values were measured.
It should be noted that some C I, C I* and C I** lines are also detected between 1100 Å
and 1120 Å but the transitions are blends of multiplets and without high resolution STIS data we are unable
to disentangle the various excited states (Sonnentrucker et al. 2002). Furthermore, due to
the severe stellar blending over so many absorption lines we cannot produce a reliable C I, C I*
and C I** model. Such a model would be helpful to derive the average density. Finally, we point out that
the presence of large quantities of molecular hydrogen did not allow us to further investigate other atomic
species in this spectrum.
Below 1100 Å, the H2 lines are the most prominent features seen in absorption. The analysis of
the column density of the J=0, 1 rotational levels has already been performed by Rachford et al.
(2002). They showed that this line of sight may contain translucent cloud material and that some of
the molecular hydrogen content originates in several more diffuse components. As mentioned before, four components
are seen in CH, all of them well within 10 km s-1 which means that they cannot be resolved by FUSE
(Lacour et al. 2003).
Adopting this velocity structure, we performed a global profile fitting of the J levels up to
J=7. Our results
agree with those of Rachford et al. (2002) for J=0, 1 and we find a temperature T01 of 70 K.
Because the profiles of the higher J levels are saturated, they are not sensitive to the column density
and we could only measure lower limits to their column densities. Note also that J levels higher than J=1
contribute a negligible fraction to the total H2 column density (see Table 4). We hence found a total H2 column density of
 cm-2 along the sightline toward HD 207538.
An analysis of the 1076 Å CO (J=0) band was also performed.
Because this line arises close to a strong H2 absorption and because the CO band is
heavily saturated, we can only report a stringent lower limit to its column density of 1015 cm-2,
leading to a conversion factor of
 .
This CO-to-H2 conversion factor is consistent with
the range expected when translucent material is present along a sightline (van Dishoeck & Black 1980).
Our result therefore further suggests that along this particular line of sight some denser, colder gas is present.
.
This CO-to-H2 conversion factor is consistent with
the range expected when translucent material is present along a sightline (van Dishoeck & Black 1980).
Our result therefore further suggests that along this particular line of sight some denser, colder gas is present.
HD absorption lines are also seen along this sightline. Their study is discussed in Lacour et al.
(2003). They find that a HD/H2 ratio of
 cannot be explained unless the main
molecular component is dense enough to shield the HD molecule from the external UV radiation field. The
recent chemical model of translucent clouds of Le Petit et al. (2002) applied to this sightline
indicates a molecular fraction of at least 80% and number densities of the order of a few hundred atoms
per cubic centimeters, also consistent with the idea that some translucent material is present in the
interstellar gas.
cannot be explained unless the main
molecular component is dense enough to shield the HD molecule from the external UV radiation field. The
recent chemical model of translucent clouds of Le Petit et al. (2002) applied to this sightline
indicates a molecular fraction of at least 80% and number densities of the order of a few hundred atoms
per cubic centimeters, also consistent with the idea that some translucent material is present in the
interstellar gas.
Table 4:
ISM molecular and atomic column densities toward HD207538.
![\begin{figure}
\par\includegraphics[width=16cm,clip]{H4193F7.ps}\end{figure}](/articles/aa/full/2003/23/aah4193/Timg76.gif) |
Figure 7:
Comparison between theoretical and observed spectra in the FUV range 1000-1098 Å. In each box we have: at the top the ISM model with labelled the identified lines, at the middle
the synthetic photospheric model with the identified lines and at the bottom,
the observed spectrum compared with the total model. |
| Open with DEXTER |
![\begin{figure}
\par\includegraphics[width=17.1cm,clip]{H4193F8.ps}
\end{figure}](/articles/aa/full/2003/23/aah4193/Timg77.gif) |
Figure 8:
Comparison between theoretical and observed spectra in the FUV range 1098-1188 Å. Symbols as in Fig. 7. |
| Open with DEXTER |
We performed a detailed abundance analysis of both the stellar atmosphere and the interstellar medium toward the
suspected CP star HD 207538. We combined Far-UV spectra obtained by FUSE, UV spectra obtained by IUE
with our optical spectra obtained with the ground-based SARG-TNG facility.
Synthetic spectra were computed using ATLAS9 and SYNTHE for the stellar contribution
and by the OWENS code for the interstellar medium spectrum. Effective temperature and surface gravity were fixed
by matching the UV and visible flux distributions. We found that our values are in agreement with the values given
by Daflon et al. (1999). Microturbulent velocity was determined assuming that the oxygen abundance
inferred from ten lines is independent of the
measured equivalent width. Rotational velocity was determined by matching the profiles
of five unblended metal lines.
Our model underestimates the observed flux only in the spectral range 1110-1170 Å; this
discrepancy could be ascribed to various causes as we discussed at the end of Sect. 4.2.
Regarding the abundances in CP stars, usually helium is underabundant in cool CP stars and overabundant in hot CP stars. Carbon, oxygen, nitrogen and magnesium are underabundant and iron peak elements are overabundant.
In our study, with the exception of the underabundance found for iron, nickel and zinc, the other metals show
lines profiles compatible with the standard solar chemical composition (Grevesse et al. 1996).
We also find that the helium abundance is
,
value compatible with the standard
value measured for B-type stars reported by Gies & Lambert (1992). Therefore, our results seem to
indicate that HD 207538 does not have peculiar abundances.
Regarding the main observational fingerprint of the CP stars, namely light, spectral and magnetic variability:
a) we did not find any evidence of variability in the equivalent widths of helium lines
detected in both of our datasets and in the various literature contributions, b) Vetö et al. (1980)
found the light curve constant and we confirm the absence of variability from HIPPARCOS data, c) no magnetic
measurements were reported so far, unfortunately. All this evidence leads us to conclude that HD 207538 has
been incorrectly reported in the Renson (1991) catalogue.
In conclusion, based on Kurucz codes our stellar analysis shows that we were able to reproduce the principal spectral
features observed in HD 207538 from the far-UV to visible range using a single set of atmospheric parameters
(
 ,
,
 and
and  )
and chemical abundances.
)
and chemical abundances.
The analysis of the interstellar gas content in the FUSE range
toward HD 207538 led to estimates of the
H2, CO, N I, O I, Cl I, Ar I, Fe II
and P II column densities. The high
CO-to-H2 conversion factor,
the large molecular fraction as derived from the HD/H2 ratio both argue for the
existence of some translucent material among the diffuse interstellar gas components toward HD 207538.
However, high resolution observations of atomic species such as C I, C I* and C I** using the
STIS range are required to confirm the existence of denser cloud components and to study the depletion pattern
along this sightline.
Acknowledgements
This work is based on observations made with the NASA-CNES-CSA Far Ultraviolet
Spectroscopic Explorer (FUSE) which is operated for NASA by the "The Johns Hopkins
University'' under NASA contract NAS5-32985, on observations made with the
Italian Telescopio Nazionale Galileo (TNG) operated on the island of La Palma by the
Centro Galileo Galilei of the INAF (Istituto Nazionale di Astrofisica) at the Spanish
Observatorio del Roque de los Muchachos of the Instituto de Astrofisica de Canarias
and on INES data from the International Ultraviolet Explorer (IUE) satellite.
This work has made use of the profile fitting procedure OWENS developed by
M. Lemoine and the FUSE French Team.
This research has made use of the SIMBAD database, operated at CDS, Strasburg, France.
We wish to thank the referee, Dr. P. Barklem, for his help in improving the manuscript.
- Abgrall, H., Roueff, E., Launay, F., Roncin, J. Y., & Subtil, J. L. 1993, A&AS, 101, 273
In the text
NASA ADS
- Abgrall, H., Roueff, E., Launay, F., Roncin, J. Y., & Subtil, J. L. 1993b, A&AS, 101, 323
In the text
NASA ADS
- Allende Prietro, C., Lambert, D. L., & Asplund, M. 2002, ApJ
- André, M. K., et al. 2003, in preparation
In the text
- Auer, L., & Mihalals, D. 1972, ApJS, 24, 193
In the text
NASA ADS
- Buss, R. H., Kruk, J. W., & Ferguson, H. C. 1995, ApJ, 454, L55
In the text
NASA ADS
- Cardelli, J. A., Clayton, G. C., & Mathis, J. S. 1989, ApJ, 345, 245
In the text
NASA ADS
- Cartledge, S. I. B., Meyer, D. M., Lauroesch, J. T., & Sofia, U. J. 2001, ApJ, 562, 394
In the text
NASA ADS
- Castelli, F., & Kurucz, R. L. 1994, A&A, 281, 817
In the text
NASA ADS
- Chavez, M., Stalio, R., & Holberg, J. B. 1995, ApJ, 449, 280
In the text
NASA ADS
- Conti, P. S. 1974, ApJ, 187, 539
In the text
NASA ADS
- Conti, P. S. 1973, ApJ, 179, 161
In the text
NASA ADS
- Conti, P. S., & Alschuler, W. R. 1971, ApJ, 170, 325
In the text
NASA ADS
- Daflon, S., Cunha, D., Becker, S. R., & Smith, V. V. 2001, ApJ, 552, 309
In the text
NASA ADS
- Daflon, S., Cunha, K., & Becker, S. R. 1999, ApJ, 522, 950
In the text
NASA ADS
- De Zeeuw, P. T., Hoogerwerf, R., De Bruijne, J. H. J., et al. 1999, AJ, 117, 354
In the text
NASA ADS
- Dixon, W. V. D., & Hurwitz, M. 1998, A&A, 500, L29
In the text
- Frémat, Y., Zorec, J., Hubert, A.-M., et al. 2002, A&A, 385, 986
In the text
NASA ADS
- Gies, D. R., & Lambert, D. L. 1992, ApJ, 387, 673
In the text
NASA ADS
- Gratton, R., Bonanno, G., Bruno, P., et al. 2003, Ap&SS (in press)
In the text
- Grevesse, N., & Sauval, A. J. 1998, Space Sci. Rev., 85, 161
In the text
NASA ADS
- Grevesse, N., Noels, A., & Sauval, A. J. 1996, in
Cosmic Abundances, ed. S. S. Holt, &
G. Sonneborn, ASP Conf. Ser., p. 117
In the text
- Grigsby, J. A., Morrison, N. D., & Anderson L. S. 1992, ApJS, 78, 205
In the text
NASA ADS
- Hébrard, G., Lemoine, M., Vidal-Madjar, A., et al. 2002, ApJS, 140, 103
In the text
NASA ADS
- Howk, J. C., Sembach, K. R., Roth, K. C., & Kruk, J. W. 2000, ApJ, 544, 867
In the text
NASA ADS
- Jura, M. 1974, ApJ, 190, L33
In the text
NASA ADS
- Kurucz, R. L. 1993,
A new opacity-sampling model atmosphere program for arbitrary
abundances, in ed. M. M. Dworetsky, F. Castelli, & R. Faraggiana,
IAU Col. 138, Peculiar versus normal phenomena in A-type and
related stars, ASP Conf. Ser., 44, 87
In the text
- Kurucz, R. L., & Avrett, E. H. 1981, SAO Special Rep., 391
In the text
- Lacour, S., Le Petit, F., Sonnentrucker, P., et al. 2003, in preparation
In the text
- Leckrone, D. S., Fowler, J. W., & Adelman, S. J. 1974, A&A, 32, 237
In the text
NASA ADS
- Leone, F., & Manfrè, M. 1996, A&A, 315, 526
In the text
NASA ADS
- Le Petit, F., Roueff, E., & Le Bourlot, J. 2002, A&A, 390, 369
In the text
NASA ADS
- Mathys, G. 1989, A&AS, 81, 237
In the text
NASA ADS
- Moos, H. W., Cash, W. C., Cowie, L. L., et al. 2000, ApJ, 538, L1
In the text
NASA ADS
- Morales, C., Orozco, V., Gómez, J. F., et al. 2001, ApJ, 522, 278
In the text
- Morton, D. C. 1991, ApJS, 77, 119
In the text
NASA ADS
- Nichols, J. S., & Linsky, J. L. 1996, AJ, 111, 517
In the text
NASA ADS
- Penny, L. 1996, ApJ, 463, 737
In the text
NASA ADS
- Peterson, B. A. 1966, ApJ, 145, 735
In the text
NASA ADS
- Rachford, B. L., Snow, T. P., Tumlinson, J., et al. 2002, ApJ, 577, 221
In the text
NASA ADS
- Renson, P., Catalogue Général des Etoiles Ap et Am,
Institut d'Astrophysique, Université de Liège
In the text
- Sahnow, D. J., Moos, H. W., Ake, T. B., et al. 2000, ApJ, 538, L7
In the text
NASA ADS
- Sonnentrucker, P., Friedman, S. D., Welty, D. E., York, D. G., &
Snow, T. P. 2002, ApJ, 576, 241
In the text
NASA ADS
- Snow, T. P., Rachford, B. L., & Figoski, L. 2002, ApJ, 573, 662
In the text
NASA ADS
- Stibbs, D. W. N. 1950, MNRAS, 110, 395
In the text
NASA ADS
- St-Louis, N., & Smith, L. J. 1991, A&A, 252, 781
In the text
NASA ADS
- Stellingwerf, R. F. 1978, ApJ, 224, 953
In the text
NASA ADS
- van Dishoeck, E. F., & Black, J. H. 1989, ApJ, 340, 273
In the text
NASA ADS
- Vetö, B., Schoeneich, W., & Rustamov, Iu. S. 1980, AN, 301, 317
In the text
NASA ADS
- Welty, D. E., Hobbs, L. M., & Lauroesch, J. T., et al. 1999, ApJS, 124, 465
In the text
NASA ADS
Copyright ESO 2003
![\begin{figure}
\par\includegraphics[width=8.9cm,height=8.5cm]{H4193F1.ps}
\end{figure}](/articles/aa/full/2003/23/aah4193/img15.gif)
![\begin{figure}
\par\includegraphics[angle=-90,width=16.4cm,clip]{H4193F2.ps}
\end{figure}](/articles/aa/full/2003/23/aah4193/img18.gif)
![\begin{figure}
\par\includegraphics[width=8.2cm,clip]{H4193F3.ps}
\end{figure}](/articles/aa/full/2003/23/aah4193/img27.gif)
![\begin{figure}
\par\includegraphics[width=8.3cm,clip]{H4193F4.ps}
\end{figure}](/articles/aa/full/2003/23/aah4193/img46.gif)
![\begin{figure}
\par\includegraphics[width=7.5cm,clip]{H4193F6.ps}
\end{figure}](/articles/aa/full/2003/23/aah4193/img56.gif)
![\begin{figure}
\par\includegraphics[width=16cm,clip]{H4193F7.ps}\end{figure}](/articles/aa/full/2003/23/aah4193/img76.gif)
![\begin{figure}
\par\includegraphics[width=17.1cm,clip]{H4193F8.ps}
\end{figure}](/articles/aa/full/2003/23/aah4193/img77.gif)