A&A 404, 557-567 (2003)
DOI: 10.1051/0004-6361:20030480
Measurements of the interstellar turbulent plasma spectrum of
PSR B0329+54 using multi-frequency observations of interstellar
scintillation
V. I. Shishov1 -
T. V. Smirnova1 -
W. Sieber2 -
V. M. Malofeev1,5 -
V. A. Potapov1 -
D. Stinebring3 -
M. Kramer4 -
A. Jessner5 -
R. Wielebinski5
1 - Pushchino Radioastronomy Observatory of Lebedev Physical
Institute, 142290 Pushchino, Russia, and Isaac Newton
Institute of Chile, Pushchino Branch
2 -
Hochschule Niederrhein, Reinarzstr. 49, 47805 Krefeld,
Germany
3 -
Oberlin College, OH 44074, Oberlin, USA
4 -
University of Manchester, Jodrell Bank Observatory,
Macclesfield SK11 9DL, UK
5 -
Max-Planck-Institut für Radioastronomie, Auf dem Hügel
69, 53121 Bonn, Germany
Received 2 July 2002 / Accepted 21 March 2003
Abstract
Interstellar scintillation multi-frequency observations
of PSR 0329+54 in the frequency range from 102 MHz to 5 GHz were
analysed to estimate the spectrum of interstellar plasma
inhomogeneities in the direction of this pulsar. Based on the
theory of diffractive scintillation, the composite structure
function of phase fluctuations covering a large range of
turbulence scales was constructed. We found that the spectrum is
well described by a power law with n = 3.5 for scales from
106 to 109 m, which differs from the value known for a
Kolmogorov spectrum. We can, however, within the accuracy of our
data not exclude a Kolmogorov spectrum. It became also clear that
angular refraction of emission must be taken into account to fit
the data points at all observing frequencies. The size of the
irregularities responsible for the angular refraction is estimated
to be about
 m. They can be identified with clouds
of neutral hydrogen that can be considered as holes of electron
density.
m. They can be identified with clouds
of neutral hydrogen that can be considered as holes of electron
density.
Key words: stars: pulsars: general - turbulence - ISM: structure - stars: pulsars: individual: PSR B0329+54
A generally accepted point of view at the present time is that
scattering as well as diffractive and refractive interstellar
scintillation effects are caused by electron density fluctuations
in the interstellar medium (ISM) (Scheuer 1968;
Rickett 1969; Sieber 1982; Rickett et al. 1984; Armstrong et al. 1995;
Stinebring et al. 2000). It could be shown that
for the different kinds of pulsar observations connected with the
propagation through the interstellar plasma, a composite structure
function of phase fluctuations can be constructed and that this
structure function follows a power law over a very wide range of
scales (106 to 1013 m). This function fits the
experimental data quite well for the near ISM ( 1 kpc)
(Armstrong et al. 1995) as well as for the distant
ISM (>1 kpc) (Shishov & Smirnova 2002). The
exponent of the structure function is about 1.7. This means that
the 3-dimensional spatial spectrum of electron density can be
described by a Kolmogorov spectrum
1 kpc)
(Armstrong et al. 1995) as well as for the distant
ISM (>1 kpc) (Shishov & Smirnova 2002). The
exponent of the structure function is about 1.7. This means that
the 3-dimensional spatial spectrum of electron density can be
described by a Kolmogorov spectrum
 |
|
|
(1) |
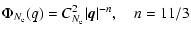
with the power law index n = 11/3, where
 denotes the
squared Fourier spectrum of the electron density fluctuations.
denotes the
squared Fourier spectrum of the electron density fluctuations.
 characterizes the level of plasma turbulence and
  is
the spatial frequency.
is
the spatial frequency.
Although the Kolmogorov spectrum describes the data sufficiently
well in a statistical sense, the dispersion of points is large and
in particular directions the spectrum can differ from a Kolmogorov
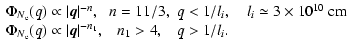
one. Smirnova et al. (1998) showed that two types of
turbulent spectra can exist in the ISM as measurements of the flux
density variations of 21 pulsars at 610 MHz prove, which show two
different types of behaviour for the dependence of the modulation
index on the dispersion measure DM. The data can be explained if
one group follows a pure power law spectrum
(Eq. (1)) with
 ,
whereas the other
group corresponds to a medium with a power law spectrum pieced
together by an exponent of
and an inner scale of
length
,
whereas the other
group corresponds to a medium with a power law spectrum pieced
together by an exponent of
and an inner scale of
length
 cm and an exponent n1 > 4 at
higher space frequencies:
cm and an exponent n1 > 4 at
higher space frequencies:
 |
|
|
(2) |
It should be noted that the accuracy of the determination of the
value of li is low and that the shape of the turbulence
spectrum in the region around li is unknown. This means that
the shape of the spectrum can be different for different regions
in the sky and that the variations of the turbulence spectrum must
be investigated in dependence on these directions.
In general, there are two types of power law spectra known for
turbulent plasmas: in addition to the aforementioned Kolmogorov
spectrum with
 (Tu et al. 1984) the
spectrum of weak plasma turbulence with
(Tu et al. 1984) the
spectrum of weak plasma turbulence with
 (Iroshnikov 1963; Kraichnan 1965).
The difference between
(Iroshnikov 1963; Kraichnan 1965).
The difference between  and
and
 is
unfortunately small, about 5%, whereas the accuracy of the
measurements of the value of n is not better than 10%. New
measurements with much higher accuracy are therefore urgently
needed.
is
unfortunately small, about 5%, whereas the accuracy of the
measurements of the value of n is not better than 10%. New
measurements with much higher accuracy are therefore urgently
needed.
In this paper we propose a new method for the determination of the
turbulent spectrum in the direction of a given pulsar using
multi-frequency scintillation observations covering a wide
frequency range from centimeter to meter wavelengths. We will then
address the question whether the exponent of the power law
spectrum equals a Kolmogorov spectrum or not.
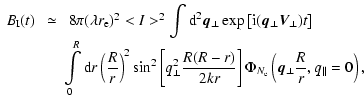
In the theory of wave propagation through random media the fundamental
function is the gradient of the phase structure function computed in
the geometrical optics approximation (Prokhorov et al. 1975). This function is given for a plasma by the equation
(Shishov & Tokumaru 1996):
![$\displaystyle %
D (\vec{\rho}) = 4 \pi (\lambda r_{\rm e})^2 \int
{\rm d}^2 \ve...
...ho}\right)\right]
\Phi_{N_{\rm e}} \left(\vec{q_{\perp}}, q_{\parallel}\right),$](/articles/aa/full/2003/23/aa2855/img14.gif) |
|
|
(3) |
where
 denotes a two-dimensional vector between two
points in the plane normal to the line of sight,
denotes a two-dimensional vector between two
points in the plane normal to the line of sight,  is the
wavelength,
is the
wavelength,  the classical electron radius, the spatial frequency,
 its component along the
line of sight, and
its component along the
line of sight, and
 its normal component. For a
power law spectrum (1)
its normal component. For a
power law spectrum (1)
 is described by the
equation (Smirnova et al. 1998):
is described by the
equation (Smirnova et al. 1998):
 |
|
|
(4) |
describes the turbulence spectrum
 for the spatial frequency region near
 .
The
equation is correct when
and n varies smoothly
with ;
it describes also spectra determined by
Eq. (2) with
.
The
equation is correct when
and n varies smoothly
with ;
it describes also spectra determined by
Eq. (2) with
 .
If n1 is however
greater than 4,
becomes proportional to
.
If n1 is however
greater than 4,
becomes proportional to  for
so that it is impossible to obtain information on the
turbulence spectrum in the region
q > 1/ li.
for
so that it is impossible to obtain information on the
turbulence spectrum in the region
q > 1/ li.
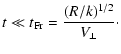
When the displacement of the line of sight is determined by a
movement of the source with the velocity  ,
which is
assumed to be greater than internal motions within the medium or
the observer velocity, the structure phase function is given by
,
which is
assumed to be greater than internal motions within the medium or
the observer velocity, the structure phase function is given by
![$\displaystyle %
D_{\rm S}(t) = \int\limits_o^R {\rm d}r D[V_{\perp} t(1-r/R)],$](/articles/aa/full/2003/23/aa2855/img27.gif) |
|
|
(5) |
where R is the distance from the observer to the source and r is
the variable distance from the source.
 can be measured
directly using pulsar timing data (Cognard & Lestrade 1997) for large time intervals t. The structure
function of the variations of the residuals
can be measured
directly using pulsar timing data (Cognard & Lestrade 1997) for large time intervals t. The structure
function of the variations of the residuals
 due to
propagation in the turbulent medium,
due to
propagation in the turbulent medium,
 ,
is
reduced to
by the relation
,
is
reduced to
by the relation
 |
|
|
(6) |
where f denotes the radio wave frequency.
can be
measured for small values of t using data on intensity
variations in the saturated scintillation regime. For this regime
the correlation function of flux variations I(t) is described by
the equation
![$\displaystyle %
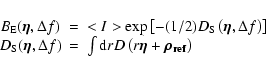
B_{\rm I}(t) = <I>^2 \exp[- D_{\rm S} (t)].$](/articles/aa/full/2003/23/aa2855/img32.gif) |
|
|
(7) |
If t0 is the characteristic scale of intensity variations we have
 |
|
|
(8) |
and Eq. (7) can be reduced for  to the
equation
to the
equation
 |
|
|
(9) |
and one obtains
 |
|
|
(10) |
where
 is the structure function of the intensity
fluctuations.
is the structure function of the intensity
fluctuations.
The phase structure function can be determined from observations
of intensity scintillation in the weak scintillation regime. In
this case the intensity correlation function of intensity
fluctuations is determined by the equation (Prokhorov et al. 1975; Malofeev et al. 1996)
 |
|
|
(11) |
where
 is the wave number. For small values of t we
may write
is the wave number. For small values of t we
may write
 |
|
|
(12) |
A small value of t corresponds to a large value of
 so that we may replace
![$\sin^2
[q_{\perp}^{2} R (R-r)/2kr]$](/articles/aa/full/2003/23/aa2855/img42.gif) by its average value 1/2; it
follows that 0.5 times the structure function of relative
intensity fluctuations
(1/2) DI (t) / <I>2 equals the phase
structure function DS (t) (see, for example, Tatarskii 1971).
Equation (10) may therefore be used for the determination
of the phase structure function in the weak scintillation regime.
by its average value 1/2; it
follows that 0.5 times the structure function of relative
intensity fluctuations
(1/2) DI (t) / <I>2 equals the phase
structure function DS (t) (see, for example, Tatarskii 1971).
Equation (10) may therefore be used for the determination
of the phase structure function in the weak scintillation regime.
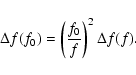
may be measured at any frequency f; if a fixed
frequency f0 is given, the result may be converted by use of the
universal factor

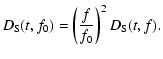 |
|
|
(13) |
It should be mentioned that
 is valid for a given time t, which must be kept constant when
is converted to
is valid for a given time t, which must be kept constant when
is converted to
 .
.
An estimation of the value of the phase structure function can be
obtained from the scintillation index of refractive scintillation
 (Smirnova et al. 1998). The
refractive scintillation index of strong scintillation is
described in case of isotropic turbulence by
(Smirnova et al. 1998). The
refractive scintillation index of strong scintillation is
described in case of isotropic turbulence by
![$\displaystyle %
m_{\rm ref}^2 = \lambda^4 r_{\rm e}^2 R^2 \int
\limits_0^{\inft...
... \Phi_{N_{\rm e}}\left[q_{\perp} \frac{R}{r}, q_{\parallel} =
0\right] \exp(-F)$](/articles/aa/full/2003/23/aa2855/img48.gif) |
|
|
(14) |
![$\displaystyle %
F = \int\limits_0^r {\rm d}r' D\left[\frac{q_{\perp} r'}{k} \le...
...right] + \int\limits_r^R {\rm d}r' D\left[\frac{q_{\perp}}{k} (R - r')\right] .$](/articles/aa/full/2003/23/aa2855/img49.gif) |
|
|
(15) |
The refractive scintillation index is determined by the value of
the turbulence spectrum
in the region of spatial
frequencies near to
 ,
where
,
where
 is the
characteristic spatial scale of refractive scintillation.
is the
characteristic spatial scale of refractive scintillation.
 can be expressed as (Shishov & Smirnova 2002)
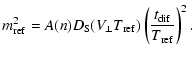 |
|
|
(16) |
Here
 and
and
 are the characteristic
temporal scales of refractive and diffractive scintillation
respectively, A(n) is a numerical coefficient, which depends on
the power law index n and on the distribution of the medium
along line of sight. In the case of a statistically homogeneous medium
with
are the characteristic
temporal scales of refractive and diffractive scintillation
respectively, A(n) is a numerical coefficient, which depends on
the power law index n and on the distribution of the medium
along line of sight. In the case of a statistically homogeneous medium
with
 ,
A (n) is given by
,
A (n) is given by
 |
|
|
(17) |
The phase structure function can also be measured using
observations of the frequency structure of intensity variations.
Ostashov & Shishov (1977) showed that the
two-frequency field coherence function of a spherical wave
 in the case of a power law turbulence spectrum and
for small values of the frequency difference
in the case of a power law turbulence spectrum and
for small values of the frequency difference
 |
|
|
(18) |
can be described by the equation
with
 |
|
|
(19) |
Equation (19) is the first order approximation of an
iteration series resulting from an expansion of the successive
scattering. The first term is much smaller than the zero term,
which equals to 1. In Eq. (19) i is the imaginary
unit and
 the characteristic scale of the
frequency structure of diffractive scintillation (for more details
see Smirnova et al. 1998). Using
Eq. (19) one may derive the relation which
determines the frequency correlation function of intensity fluctuations
the characteristic scale of the
frequency structure of diffractive scintillation (for more details
see Smirnova et al. 1998). Using
Eq. (19) one may derive the relation which
determines the frequency correlation function of intensity fluctuations
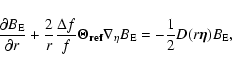
![$\displaystyle %
\begin{array}{l}
B_{\rm I,dif} (\Delta f, \rho=0) = B_{\rm E} (...
... G (R,r, \vec {\rho'})
D\left(\frac{r}{R} \vec {\rho'}\right)\big].
\end{array}$](/articles/aa/full/2003/23/aa2855/img63.gif) |
|
|
(20) |
Equation (20) can be reduced to the following equation in
case of a power law turbulence spectrum
Using these relations one can estimate the phase structure function
 |
|
|
(22) |
Equations (21) and (22) are correct for
 .
The difference between
.
The difference between  and
and
 depends on the distribution of the turbulent
medium along the line of sight. In case of a statistically uniform
distribution one obtains
depends on the distribution of the turbulent
medium along the line of sight. In case of a statistically uniform
distribution one obtains
 |
|
|
(23) |
One can reduce the measured value
 to a given
frequency f0 by use of the relations
to a given
frequency f0 by use of the relations
 |
(24) |
 |
(25) |
It should be pointed out here that the value of
as well as
the value of the frequency scale  must be reduced to the same
frequency f0.
must be reduced to the same
frequency f0.
Another type of relation between the frequency correlation
function
 of the intensity fluctuations and
the spatial phase structure function
of the intensity fluctuations and
the spatial phase structure function
 is realised
in case of strong angular refraction. According to (Shishov 1973)
we may introduce the accumulated angle of refraction
is realised
in case of strong angular refraction. According to (Shishov 1973)
we may introduce the accumulated angle of refraction
 at distance r, which is a random function of r and
depends only weakly on the coordinates in the plane perpendicular
to the line of sight. If the characteristic value of the
refraction angle
is much bigger than the
characteristic value of the diffractive or scattering angle
at distance r, which is a random function of r and
depends only weakly on the coordinates in the plane perpendicular
to the line of sight. If the characteristic value of the
refraction angle
is much bigger than the
characteristic value of the diffractive or scattering angle
 |
(26) |
then the frequency structure of the scintillation is formed by the
frequency dependence of the displacement of the beam path
(Shishov 1973). Using the equation for the
two-frequency field coherence function derived by Shishov
(1973) and taking into account inequality (26) we
obtain
 |
(27) |
where we have used a spherical co-ordinate system, in which
 denotes a two-dimensional angle. The solution is
 |
(28) |
 |
(29) |
This solution describes the spatial pattern of diffractive
scintillation for
 and corresponds to Eq. (7).
The fine frequency structure of scintillation is determined by the
refractive relative displacement of beam paths at two frequencies
that causes rearrangement of speckles of the diffractive
scintillation pattern with a changing of frequency.
and corresponds to Eq. (7).
The fine frequency structure of scintillation is determined by the
refractive relative displacement of beam paths at two frequencies
that causes rearrangement of speckles of the diffractive
scintillation pattern with a changing of frequency.
For the frequency correlation function of intensity fluctuations
one can show that for small values of
and in case of a
power law turbulence spectrum the following relations hold
![\begin{displaymath}%
B_{\rm I,ref} (\Delta f) = <I>^2 \left[1- D_{\rm S,1} \left(\rho_{\rm ref,eff}
(\Delta f)\right)\right]
\end{displaymath}](/articles/aa/full/2003/23/aa2855/img86.gif) |
(30) |
 |
(31) |
where
 is the effective refraction angle
![\begin{displaymath}%
\Theta_{\rm ref,eff} = \frac{\left[ \int\limits_0^R {\rm d}...
...r^R {\rm d}r'\frac{r}{r'}\right\}^{n-2}\right]^{1/(n-2)}}\cdot
\end{displaymath}](/articles/aa/full/2003/23/aa2855/img89.gif) |
(32) |
The numerical coefficient in Eq. (31) was calculated
for the case of a statistically homogeneous medium. Using
Eq. (31) one can estimate the phase structure
function
The spatial scale
 is determined by
Eq. (31).
is determined by
Eq. (31).
 is the characteristic
frequency scale of diffractive scintillation in the presence of
strong angle refraction (Shishov 1973)
is the characteristic
frequency scale of diffractive scintillation in the presence of
strong angle refraction (Shishov 1973)
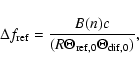 |
(34) |
where c is the velocity of light,
 the
characteristic value of the refractive angle, and
the
characteristic value of the refractive angle, and
 the scattering angle. The numerical coefficient B(n)depends on the power law index n and on the distribution of the
medium along the line of sight.
the scattering angle. The numerical coefficient B(n)depends on the power law index n and on the distribution of the
medium along the line of sight.
The weak dependence of
 on
in
comparison with that of
on
in
comparison with that of
 leads to dominant
diffraction effects for very small values of
leads to dominant
diffraction effects for very small values of
with
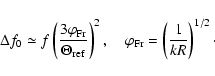 |
(35) |
One can use Eqs. (20) and (33) also if the
scintillation is weak because these equations correspond to single
or weak scattering on inhomogeneities with scales of the order of
 or
or
 .
.
It is important for practical observations that the diffractive
and refractive model gives indeed for small values of different functional dependences of the intensity correlation
function on .
The power law indices of the temporal and
frequency structure functions of intensity fluctuations are
different: (n-2) and (n-2)/2 in case of the diffractive model.
The indices are equal and have the value (n-2) for the
refractive model.
The dynamic spectra of pulsars must show a strong frequency drift
in case of a phase screen model, if refractive effects dominate
over diffractive effects. The effect of the frequency drift is
however weak as shown by Shishov (1973) in case of an extended
random medium. It is possible that the frequency drift can in
this case be the result of an interaction of refractive
scintillation with strong angular refraction. This problem must
be analyzed in more detail in future.
A comprehensive collection of observations of PSR B0329+54, covering
the wide frequency range from 102 MHz to 5 GHz, was available for this
paper to compare the theoretical results of Sect. 2 with measurements.
The collection of data was used to construct the phase-structure
function as outlined above.
The emission of PSR B0329+54 is fortunately strong at high frequencies
- our observations were taken at 4.7 and 10.6 GHz - showing clearly
visible scintillation (Malofeev et al. 1996). We
completed and extended the available observational material with
specific measurements in July 1997 at the 100-m radio telescope of the
Max-Planck-Institut für Radioastronomie, when we used a filterbank
receiver with four channels of 60 MHz bandwidth each. The system
temperature was in average about 60 K and the channels were centered at 5060, 4940, 4760 and 4640 MHz. Individual pulses were sampled at 1/1024
of the observing period and integrated subsequently in a data logger
over ten periods to improve the signal-to-noise ratio. These blocks of
data were used in the following analysis separately for each channel.
More details on the observing method, the receiver and the pulsar
backend are presented by Kijak et al. (1997).
![\begin{figure}
\par\includegraphics[width=14cm,clip]{shishov_fig1.eps}\end{figure}](/articles/aa/full/2003/23/aa2855/Timg106.gif) |
Figure 1:
Flux density variations over 400 min at four frequencies. |
| Open with DEXTER |
Examples of intensity variations in the four channels are shown in
Fig. 1. The measurements were smoothed over 20 data
points by a running mean to improve the signal-to-noise ratio. The
intensity fluctuations contain fast noisy oscillations and
variations with a temporal scale order of the order of 10 min
due to scintillation. The sharp peaks in the first 110 min are due to interference. They were excluded before we started the
correlation analysis. It is interesting to note that the
scintillation patterns at 5060 and 4640 MHz are partly
decorrelated. To establish the degree of decorrelation, normalized
cross-correlation functions were calculated between frequency
channels. We introduced also an artificial time shift of 20 data
points (142.6 s) between the channels to minimize the influence
of noise. The dependence of the cross-correlation coefficient on
frequency separation is shown in Fig. 2. The effect of
decorrelation is obvious for frequency lag
of about 8% of the observing frequency f.
At these high observing frequencies we are in the weak scintillation
regime and the flux density variations should be well correlated in all
four channels, which is obviously not the case. The decorrelation
indicates that we see the influence of strong refraction, changing with
frequency. We will discuss this later.
![\begin{figure}
\par\includegraphics[width=6.5cm,clip]{shishov_fig2.eps}\end{figure}](/articles/aa/full/2003/23/aa2855/Timg107.gif) |
Figure 2:
Cross-correlation coefficients of the
flux variations in dependence on frequency separation corrected
for noise. |
| Open with DEXTER |
The temporal structure function of intensity fluctuations
for time shifts t>200 s (calculated for f=4640 MHz) is
shown in Fig. 3. It was corrected for noise by
subtracting the mean value of the structure function calculated
over the first 10 points.
![\begin{figure}
\par\includegraphics[width=6.5cm,clip]{shishov_fig3.eps}\end{figure}](/articles/aa/full/2003/23/aa2855/Timg108.gif) |
Figure 3:
Structure function of intensity variations normalized by
the mean intensity in the time domain at a frequency of 4640 MHz
corrected for noise. |
| Open with DEXTER |
At 610 MHz we used part of the data of a two year monitoring program of PSR B0329+54 at the NRAO 42-m telescope in 1994-1995. The observations
were made using 1024 channels of the NRAO Spectral Processor covering a
total bandwidth of 20 MHz in two orthogonal polarisations from which
the total intensity was computed as the sum of the two signals. The
spectra were accumulated during 59 s and written to magnetic tape for
subsequent off-line analysis. The off-pulse spectra were subtracted
from the on-pulse spectra. Each observation lasted for about 70 min.
We computed for all the 70-min dynamic spectra the normalized
autocorrelation function (ACF) versus frequency and time to
visualise the diffractive scintillation pattern, from which we
calculated the characteristic frequency and time scales,
 and
and
 .
and
were defined as half of the ACF width at the level of
0.5 along the frequency axis and at the level of 1/e along the
time axis after removing the spike at zero lag due to noise. Both,
and
,
are changing with time
up to a factor of 3, an effect which is in accordance with the
observations of Bhat Ramesh et al. (1999) at 327 MHz
and which we will consider in a forthcoming paper.
.
and
were defined as half of the ACF width at the level of
0.5 along the frequency axis and at the level of 1/e along the
time axis after removing the spike at zero lag due to noise. Both,
and
,
are changing with time
up to a factor of 3, an effect which is in accordance with the
observations of Bhat Ramesh et al. (1999) at 327 MHz
and which we will consider in a forthcoming paper.
![\begin{figure}
\par\includegraphics[width=8.8cm,clip]{shishov_fig4.eps}\end{figure}](/articles/aa/full/2003/23/aa2855/Timg111.gif) |
Figure 4:
Mean auto- (top) and cross-correlation (bottom) function
between successive spectra in dependence on frequency lag. One
frequency lag corresponds to 19.5 kHz. The data points are averaged
over 70 min. |
| Open with DEXTER |
![\begin{figure}
\par\includegraphics[width=8.8cm,clip]{shishov_fig5.eps}\end{figure}](/articles/aa/full/2003/23/aa2855/Timg112.gif) |
Figure 5:
Mean auto- (top) and cross-correlation (bottom) function
at f = 610 MHz in dependence on time lag. One time lag
corresponds to 59 s. The data points are averaged over 1024
frequency channels. |
| Open with DEXTER |
We computed in addition average autocorrelation functions for each
day. The mean frequency ACF was calculated from the normalized
ACFs averaged in time over all 59-s time bins whereas the mean
time ACF was calculated by averaging over all normalised ACFs in
each frequency channel. As an example the average time and
frequency ACFs are shown for the observations of 12 March 1994 in the upper panels of Figs. 4 and 5. Figure 4
presents the frequency dependence, where one lag in frequency
corresponds to 19.5 kHz, and Fig. 5 the time dependence
with one lag representing 59 s in time (the spike at zero lag is
due to noise). The corresponding crosscorrelation functions
between intensity variations in neighbouring time bins ( )
and frequency channels (
)
and frequency channels (
 )
averaged over all
pairs are shown at the bottom of these figures.
)
averaged over all
pairs are shown at the bottom of these figures.
More informative for a comparison with theory are the structure
functions (SF), since their slopes on a log-log scale contain
information on the spectral distribution of the inhomogeneities in
the ISM. We calculated therefore time and frequency structure
functions separately for each channel and time bin and averaged
them afterwards. The structure functions were normalized by the
square of the mean intensity. The off-spectra, containing
information on the noise, were treated in the same way. A special
treatment is necessary for the first points of the SFs,
 ,
since these points include noise
and correlated signal. We subtracted from the SFs a value of
,
since these points include noise
and correlated signal. We subtracted from the SFs a value of
 ,
where
,
where
 and
and
 for a correction of the time and frequency
structure functions. The ACFs and CCFs in the time and frequency
domain were calculated as described earlier.
for a correction of the time and frequency
structure functions. The ACFs and CCFs in the time and frequency
domain were calculated as described earlier.
![\begin{figure}
\par\includegraphics[width=8.8cm,clip]{shishov_fig7.eps}\end{figure}](/articles/aa/full/2003/23/aa2855/Timg119.gif) |
Figure 6:
Mean time structure function of intensity variations at
f = 610 MHz corrected for noise as described in the text and
normalized by 2 m2, where m is the modulation index. The line
is a fit to the first points. |
| Open with DEXTER |
![\begin{figure}
\par\includegraphics[width=8.8cm,clip]{shishov_fig6.eps}\end{figure}](/articles/aa/full/2003/23/aa2855/Timg120.gif) |
Figure 7:
Mean frequency structure function of intensity variations
at f = 610 MHz corrected for noise as described in the text and
normalized by 2 m2, where m is the modulation index. The line
is a fit to the first points. |
| Open with DEXTER |
Figures 6 and 7 present the mean time and frequency
structure functions at 610 MHz. The lines delineate fits to the first
points of the SFs. To present the data of different frequencies in the
same scale, the mean SFs were normalized by
 ,
where mis the modulation index computed on the basis of a two-dimensional
frequency time array (70 min
,
where mis the modulation index computed on the basis of a two-dimensional
frequency time array (70 min  20 MHz).
At 102 MHz we used observational material published by Popov &
Soglasnov (1984); the observations were made with the
Large Phased Array (BSA) at Pushchino in 1978. The analysis
followed a different normalization procedure since the noise
contribution in their correlation functions is large with the
result that the correlation for small lags in time and frequency
is significantly less then 1. We decided therefore to renormalize
the time and frequency correlation functions
 and
so that the correlation at zero lag becomes
indeed 1:
and
so that the correlation at zero lag becomes
indeed 1:
 and
and
 .
These modified
functions were used for a comparison with our data at cm and dm
wavelengths as shown in Figs. 8 to 10.
.
These modified
functions were used for a comparison with our data at cm and dm
wavelengths as shown in Figs. 8 to 10.
Popov & Soglasnov (1984) mention two frequency scales for the
intensity variations: 100 Hz and 750 Hz, the latter feature
amounting to about 20% of the 100 Hz component in the
correlation function. The 100 Hz structure corresponds quite well
to observations at other frequencies and the estimated
scintillation time scale, whereas the weaker 750 Hz feature might
very well be due to statistical fluctuations. We consider
therefore the 100 Hz fluctuations to be real and caused by ISS,
whereas the 750 Hz feature is doubtful.
![\begin{figure}
\par\includegraphics[width=6.5cm,clip]{shishov_fig8.eps}\end{figure}](/articles/aa/full/2003/23/aa2855/Timg126.gif) |
Figure 8:
Time structure function of phase fluctuations at f0 =
1 GHz as compiled from the following data points 1.) 102 MHz
observations: filled circles; 2.) 610 MHz: open circles; 3.)
5 GHz: stars. The solid line corresponds to the best fit to the
first points of the structure functions. The slope is 1.50. The
dashed line corresponds to n = 1.67 (Kolmogorov model). |
| Open with DEXTER |
Using the theory developed in Sect. 2 one can reduce the
measurements obtained at many different frequencies to one given
frequency f0. Figure 8 shows the resulting time
structure function
at the frequency f0 = 1 GHz
as compiled from Eqs. (10) and (13). Data
points at different frequencies are marked by different symbols.
The first points obtained at 5 GHz (stars) correspond very well to
those at 610 MHz proving that we used the right correction
procedure for measurements at different frequencies. The
uncertainty increases, however, at large time lags (>2000 s)
for the 5 GHz observations because the ratio between the time
duration of the observations and the characteristic scintillation
time scale becomes smaller and smaller. For a fit only the first
three points were used. The measurements follow a power law:
 |
(36) |
The best fit corresponds to the parameters:
t0 = 1000 s and
 which is shown in Fig. 8 by the solid
line. The accuracy of the values of
in Fig. 8 can be
estimated to be about 15% of ,
which means that the error
bars, are comparable in size to the dots in the figure. The most
objective estimation of the total error may be obtained from the
scatter of the
values measured at different frequencies.
The resulting accuracy in the determination of the exponent is
which is shown in Fig. 8 by the solid
line. The accuracy of the values of
in Fig. 8 can be
estimated to be about 15% of ,
which means that the error
bars, are comparable in size to the dots in the figure. The most
objective estimation of the total error may be obtained from the
scatter of the
values measured at different frequencies.
The resulting accuracy in the determination of the exponent is
 .
The dashed line corresponds to: t0 =
800 s and the Kolmogorov value
.
The dashed line corresponds to: t0 =
800 s and the Kolmogorov value
 ,
which describes
the data points within
,
which describes
the data points within  .
.
For the computation of the frequency dependence, i.e. for the
computation of
 at f0 = 1 GHz, one may
use two different approaches. One approach is to base the analysis
on the diffractive scintillation model, described by
Eqs. (20), (22), and (23). The
result of such a compilation is shown at the top of
Fig. 9. One recognises immediately a strong discrepancy
between the data sets at different frequencies.
at f0 = 1 GHz, one may
use two different approaches. One approach is to base the analysis
on the diffractive scintillation model, described by
Eqs. (20), (22), and (23). The
result of such a compilation is shown at the top of
Fig. 9. One recognises immediately a strong discrepancy
between the data sets at different frequencies.
![\begin{figure}
\par\includegraphics[width=7.7cm,clip]{shishov_fig9.eps}\end{figure}](/articles/aa/full/2003/23/aa2855/Timg133.gif) |
Figure 9:
Frequency structure function
of phase fluctuations at f0 = 1 GHz based on data at 102 MHz,
610 MHz and 5 GHz (the different frequencies are characterized by
different sizes of the circles) for two models: 1.) diffractive
scintillation model; 2.) model with angular refraction. The solid
line corresponds to the best fit to the first data points of the
structure function. The slope is 1.47. |
| Open with DEXTER |
Alternatively one may assume the strong refraction model (model 2)
using Eqs. (23), (31), and (33).
It should be remembered that
is reduced to f0 in
this case according to
 |
(37) |
The results for the refractive model are shown at the bottom of
Fig. 9 demonstrating now a good agreement between the data
sets at different frequencies. The plotted power law corresponds to
 |
(38) |
with
 kHz and
 .
The
accuracy of the values of
in Fig. 9 is about 15% so that
the error bars a comparable in size to the shown points. No change
in the local value of the slope can now be recognized down to the
smallest value of .
We may conclude therefore that the
refractive effect dominates over all ranges of the variation of .
.
The
accuracy of the values of
in Fig. 9 is about 15% so that
the error bars a comparable in size to the shown points. No change
in the local value of the slope can now be recognized down to the
smallest value of .
We may conclude therefore that the
refractive effect dominates over all ranges of the variation of .
It is interesing to compare the angular refractive effect
discussed above with the slanting features which are sometimes
observed in the dynamical spectra of pulsars (see, for example,
Rickett 1969; Gupta et al. 1994; Stinebring et al. 1996; Bhat et al. 1999). The angular refractive effect, which is evident in the
frequency correlation function of intensity fluctuations, is
stable over more than 15 years, because the time lag between the
observations at 102 and 610 MHz as well as 5 GHz is about 15 years. The observations do, however, not show corresponding stable
slanting features. This is an additional argument in favour of an
extended model of the interstellar turbulent plasma near to the
Sun because the frequency drift of diffraction patterns is strong
for a phase screen and weak for an extended medium (Shishov 1973).
In case of a power law turbulence spectrum, the theory predicts
small angle refraction of the order of more or less
 ,
where
is the scintillation index of refactive
scintillation and
the scattering angle. The
observations show however sometimes strong frequency drifts, that
correspond to very large values of the
refraction angle
,
where
is the scintillation index of refactive
scintillation and
the scattering angle. The
observations show however sometimes strong frequency drifts, that
correspond to very large values of the
refraction angle
 .
It is
difficult to explain such values of the refraction angle in terms
of a power law turbulence spectrum only. It may be necessary to
introduce into the model additional large scale inhomogeneities
that give strong angular refraction, a modification which may
open up new possibilities. The problem of refractive
scintillation in presence of strong angle refraction is difficult
and needs obviously special consideration.
.
It is
difficult to explain such values of the refraction angle in terms
of a power law turbulence spectrum only. It may be necessary to
introduce into the model additional large scale inhomogeneities
that give strong angular refraction, a modification which may
open up new possibilities. The problem of refractive
scintillation in presence of strong angle refraction is difficult
and needs obviously special consideration.
One may reduce the temporal structure function to a spatial
structure function
using the pulsar velocity
 and the equation
 |
(39) |
An alternative would be to reduce the frequency structure function
to the spatial structure function
by use of Eqs. (23) and (31); one has then to specify the distance R and the
refractive angle
.
Good agreement between
and
 can
be obtained if we suppose that R =1.4 kpc and the refractive
angle is equal to
can
be obtained if we suppose that R =1.4 kpc and the refractive
angle is equal to
 |
(40) |
Notice that the evaluation of
 in Eq. (40) is independent on the value of R because the ratio
 designates an angular velocity representing a
measured quantity.
designates an angular velocity representing a
measured quantity.
The whole compilation for
is shown in
Fig. 10, where the data points for
are
taken from Fig. 8 and converted to the spatial scale
using Eq. (39).
![\begin{figure}
\par\includegraphics[width=6.3cm,clip]{shishov_fig10.eps}\end{figure}](/articles/aa/full/2003/23/aa2855/Timg146.gif) |
Figure 10:
Structure function of phase fluctuations at f0 = 1 GHzversus spatial scale of the inhomogeneities. The signs are the
same as in Fig. 8; the cross designates the value
computed from an analysis of refractive scintillation; the point
at 1014 m is an upper limit from timing observations at
102 MHz. The points at the highest spatial scales are from DM
variations of pulsar pairs in globular clusters. The line 1
corresponds to the best fit to the first points of the structure
function, the line 2 to the Kolmogorov spectrum, and the line 3 is
computed from Eqs. (41) and (44) as
explained in the text. |
| Open with DEXTER |
Further data points for the determination of
can
be obtained from measurements of refractive scintillation at 610 MHz as given by Smirnova et al. (1998) and from
timing data at 102 MHz as published by Shabanova
(1995). These points have been added to
Fig. 10. The 610 MHz measurements allow one to calculate a
value of
at
 m by use of Eqs. (16) and (17)
with n=3.5 and assuming a scintillation index m = 0.37 and a
characteristic time scale of
m by use of Eqs. (16) and (17)
with n=3.5 and assuming a scintillation index m = 0.37 and a
characteristic time scale of
 days. In addition,
the variations of the pulse arrival times at 102 MHz with
days. In addition,
the variations of the pulse arrival times at 102 MHz with
 ms provide an upper limit for
at
ms provide an upper limit for
at
 m if we use Eq. (6).
Data of dispersion measure variations for pulsars in globular
clusters (Shishov & Smirnova 2002) were used to
estimate
for large values of  in the range
of one parsec (see Fig. 10). These data were reduced to
our reference value of the dispersion measure, i.e.
in the range
of one parsec (see Fig. 10). These data were reduced to
our reference value of the dispersion measure, i.e.
 .
The errors for these values are about
50% of .
A detailed discussion of this data material can
be found at Shishov & Smirnova (2002).
.
The errors for these values are about
50% of .
A detailed discussion of this data material can
be found at Shishov & Smirnova (2002).
All the experimental data points were fitted by two lines where
line 1 has a slope of
 which corresponds to an
exponent of n = 3.5 in the spectrum and where the line 2 has a
slope of
corresponding to a Kolmogorov spectrum.
The point characterising the refractive scintillation falls above
line 1 with
but we know that this point depends
on the used theoretical model for the spectrum and the
distribution of inhomogeneities along the line of sight to PSR 0329+54 and can be reduced.
which corresponds to an
exponent of n = 3.5 in the spectrum and where the line 2 has a
slope of
corresponding to a Kolmogorov spectrum.
The point characterising the refractive scintillation falls above
line 1 with
but we know that this point depends
on the used theoretical model for the spectrum and the
distribution of inhomogeneities along the line of sight to PSR 0329+54 and can be reduced.
We show in addition in Fig. 10 by line 3 the relation
![\begin{displaymath}%
2[\Delta S (\rho)]^2 = (k \Theta_{\rm ref} \rho)^2 \simeq 3.6
\times 10^{-15} (\rho [m])^2.
\end{displaymath}](/articles/aa/full/2003/23/aa2855/img154.gif) |
(41) |
This line corresponds to the case when the refraction dominates
and
 designates the phase difference measured at
points separated by a distance .
designates the phase difference measured at
points separated by a distance .
![$2[\Delta S (\rho)]^2$](/articles/aa/full/2003/23/aa2855/img156.gif) can
be considered then as a rough estimate of the phase structure
function
can
be considered then as a rough estimate of the phase structure
function
 influenced mainly by refractive
inhomogeneities. The exact value of
can be
described by Eq. (41), if
influenced mainly by refractive
inhomogeneities. The exact value of
can be
described by Eq. (41), if
 is
substituted by
is
substituted by
 .
.
The observations show that the interstellar plasma near to the Sun
along the line of sight to PSR 0329+54 consists of two types of
inhomogeneities: turbulent irregularities, which produce the
scattering and scintillation effects, and much larger scale
irregularities, which are responsible for angular refraction
effects only.
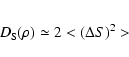
The turbulence spectrum can be described by the Karman model (Tatarskii 1971)
 |
(42) |
with n = 3.5 and
L0 designates here the outer scale of the turbulence spectrum
and
 the average of the squared electron
density fluctuations.
the average of the squared electron
density fluctuations.  is the gamma function.
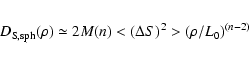
Using this model one obtains for small values

with
![\begin{displaymath}%
M (n) = \displaystyle\frac{\Gamma
((n-2)/2)}{\left[2^{n-2} (n-1) \Gamma (n/2)\right]} \simeq 0.19, \quad n =
3.5.
\end{displaymath}](/articles/aa/full/2003/23/aa2855/img166.gif) |
(43) |
The observational data are described very well by
Eq. (43), if n = 3.5. This value of the power law
index indicates conclusively that the data correspond to the model
of weak plasma turbulence (Iroshnikov 1963;
Kraichnan 1965).
For large values of
 is given by
with
| |
|
 |
|
| |
|
 |
(44) |
Using these equations one can estimate the values of
and L0. Unfortunately, there are no reliable
data points for large values of
available. One can therefore
only estimate the limits of L0
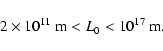 |
(45) |
If we take the upper limit of
L0 = 1017 m and
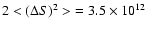 for f=1000 MHz, the value of the density
fluctuations becomes a maximum and equal to
for f=1000 MHz, the value of the density
fluctuations becomes a maximum and equal to
![\begin{displaymath}%
\delta N_{\rm e} = [<(\Delta N_{\rm e})^2>]^{1/2} \simeq 5 \times 10^{-4}
~ {\rm cm}^{-3}
\end{displaymath}](/articles/aa/full/2003/23/aa2855/img173.gif) |
(46) |
and the level of turbulence will be
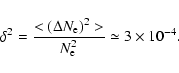 |
(47) |
The nonlinear decrement of absorption will be in this case
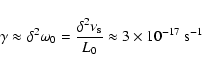 |
(48) |
and waves can propagate through a distance of about
 |
(49) |
where
 is the sound velocity. The value of R0 is
important for the problem of a localization of the turbulence
energy sources. If L0 is greater or equal to 0.3 pc then
R0 must be greater or equal than 1 kpc and waves generated in
the spiral arms of the Galaxy can be the source of the energy of
the turbulence in the space between the spiral arms. For smaller
values of L0, i.e.
L0 < 0.3 pc, the energy sources of the
turbulence must be distributed in the interarm space.
is the sound velocity. The value of R0 is
important for the problem of a localization of the turbulence
energy sources. If L0 is greater or equal to 0.3 pc then
R0 must be greater or equal than 1 kpc and waves generated in
the spiral arms of the Galaxy can be the source of the energy of
the turbulence in the space between the spiral arms. For smaller
values of L0, i.e.
L0 < 0.3 pc, the energy sources of the
turbulence must be distributed in the interarm space.
The type of irregularities which are responsible for the angular
refraction are characterised by much smaller values of L0
 |
(50) |
The value of
 cannot be less than
m
because the frequency correlation functions of scintillation obtained
at different frequencies and at epochs stretching over about 10 years
which we used still show good correspondence.
cannot be less than
m
because the frequency correlation functions of scintillation obtained
at different frequencies and at epochs stretching over about 10 years
which we used still show good correspondence.
Using the value (50) in the Eq. (44) one obtains
 |
(51) |
Such irregularities can be from the radio physics viewpoint dense
clouds or holes in the interstellar plasma. Dense plasma clouds are
however - as plasma physics tells - unstable and will expand and
generate MHD turbulence. We see, however, not yet such a turbulent
high-frequency tail. The irregularities can be identified with clouds
of neutral hydrogen which can be considered as holes of the electron
density. Dense cold clouds can indeed be stable in a surrounding hot
plasma. If we suppose that the local variation of the electron density
in clouds is  ,
then the filling factor of such clouds is of
the order of
,
then the filling factor of such clouds is of
the order of
 |
(52) |
The observational data may therefore be explained by the following
scenario. The main part of the inter-arm space is filled by a hot
plasma with weak plasma turbulence. 10% of the space shows,
however, inhomogeneities in the sense that there exists an
electron deficit on an characteristic spatial scale of the order
of
m. These volumes of low electron density can
be identified with clouds of neutral hydrogen. It is possible that
there exists a distribution of cloud sizes and that we detect only
the small-size end of the distribution. We could show in addition
that the three-dimensional spectrum of electron density
fluctuations follows a power law with index
 .
Reliable data points are available for spatial scales
between 106 and 108 m. It appears very important to
investigate the density fluctuation spectrum also in the region of
the outer scale of turbulence. To solve this problem it seems
desirable to obtain multi-frequency scintillation observations of
pulsars together with good timing measurements.
.
Reliable data points are available for spatial scales
between 106 and 108 m. It appears very important to
investigate the density fluctuation spectrum also in the region of
the outer scale of turbulence. To solve this problem it seems
desirable to obtain multi-frequency scintillation observations of
pulsars together with good timing measurements.
This scenario is not universal. There is evidence that different
types of turbulent spectra exist in different regions of the
Galaxy (see, for example, Smirnova et al. 1998; Lambert and
Rickett 2000). Multifrequency scintillation observations of
different pulsars should allow one to investigate the real change of
interstellar plasma turbulence parameters in different regions of
the Galaxy.
Acknowledgements
The authors thank the referee B. J. Rickett for useful comments,
which improved the paper considerably. This work was supported by
INTAS grant No. 00-00849, NSF grant No. AST 0098685, the Russian
Foundation for Basic Research, project code 00-02-17850, and the
Russian Federal Science and Technology Program in Astronomy. We
thank the NRAO operated by Associated Universities for support
with the 610 MHz observations and L. B. Potapova and G. Breuer for
technical assistance.
-
Armstrong, J. W., Rickett, B. J., & Spangler, S. R. 1995, ApJ, 443, 209
In the text
NASA ADS
-
Bhat, N. D. R., Rao, A. P., & Gupta, Y. 1999, ApJS, 121, 483
In the text
NASA ADS
-
Cognard, J., & Lestrade, J.-F. 1997, A&A, 323, 211
In the text
NASA ADS
-
Gupta, Y., Rickett, B. J., & Lyne, A. G. 1994, MNRAS, 269, 1035
In the text
NASA ADS
-
Iroshnikov, R. S. 1963, Astron. Zh., 40, 742
In the text
NASA ADS
-
Kijak, J., Kramer, M., Wielebinski, R., & Jessner, A. 1997, A&A, 318, L63
In the text
NASA ADS
-
Kraichnan, D. H. 1965, Phys. Fluids, 8, 1385
In the text
-
Lambert, H. C., & Rickett, B. J. 2000, ApJ, 531, L883
In the text
-
Malofeev, V. M., Shishov, V. I., Sieber, W., et al. 1996, A&A, 308, 180
In the text
NASA ADS
-
Ostashov, V. E., & Shishov, V. I. 1977, Radiophys. Quantum Electron., 20, 581
In the text
-
Popov, M. V., & Soglasnov, V. A. 1984, Astron. Zh., 61, 727
In the text
NASA ADS
-
Prokhorov, A. M., Bunkin, V. F., Gochelashvily, K. S., & Shishov, V. I. 1975, Proc. IEEE, 63, 790
In the text
NASA ADS
-
Rickett, B. J. 1969, Nature, 221, 158
In the text
-
Rickett, B. J., Coles, W. A., & Bourgois, G. 1984, A&A, 134, 390
In the text
NASA ADS
-
Shabanova, T. V. 1995, ApJ, 453, 779
In the text
NASA ADS
-
Scheuer, P. A. G. 1968, Nature, 218, 920
In the text
-
Shishov, V. I. 1973, Astron. Zh., 50, 947
In the text
-
Shishov, V. I., & Smirnova, T. V. 2002, Astron. Rep., 46, 731
In the text
NASA ADS
-
Shishov, V. I., & Tokumaru, M. 1996, J. Geomag. Geoelectr., 48, 1461
In the text
-
Sieber, W. 1982, A&A, 113, 311
In the text
NASA ADS
-
Smirnova, T. V., Shishov, V. I., & Stinebring, D. 1998, Astron. Rep., 42, 766
In the text
NASA ADS
-
Stinebring, D. R., Faison, M. D., & McKinnon 1996, ApJ, 460, 460
In the text
NASA ADS
-
Stinebring, D. R., Smirnova, T. V., Hankins, T. H., et al. 2000, ApJ, 539, 300
In the text
NASA ADS
-
Tatarskii, V. I. 1971, The Effects of the Turbulent Atmosphere on Wave Propogation, National Technical Information Service, TT-68-500464
In the text
-
Tu, C.-Y., Pu, Z.-Y., & Fei, F.-S. 1984, J. Geophys. Res., 89, 9695
In the text
NASA ADS
Copyright ESO 2003
![\begin{eqnarray*}B_{\rm E} (\Delta f, \rho=0) \simeq <I> \biggl[1 +
\int\limits_...
...r, \vec {\rho'})
D\left(\frac{r}{R} \vec {\rho'}\right) \biggl]
\end{eqnarray*}](/articles/aa/full/2003/23/aa2855/img60.gif)
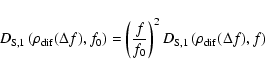
![$\displaystyle D_{\rm S,1} \left(\rho_{{\rm dif}}(\Delta f)\right) =
\int\limits...
...)^{1/2} \left( 1 -
\frac{r}{R} \right)^{1/2} \rho_{{\rm dif}} (\Delta f)\right]$](/articles/aa/full/2003/23/aa2855/img65.gif)
![$\displaystyle \rho_{{\rm dif}}(\Delta f) = \left[\Gamma \left( \frac{n}{2} \rig...
...{4 \pi}\right]^{1/(n-2)} \left( \frac{\Delta f}{f}
\right)^{1/2} \rho_{\rm Fr},$](/articles/aa/full/2003/23/aa2855/img66.gif)

![$\displaystyle \displaystyle\frac{[B_{\rm I,ref} (0) - B_{\rm I,ref} (\Delta f)]}{<I>^2}$](/articles/aa/full/2003/23/aa2855/img92.gif)


![\begin{figure}
\par\includegraphics[width=14cm,clip]{shishov_fig1.eps}\end{figure}](/articles/aa/full/2003/23/aa2855/img106.gif)
![\begin{figure}
\par\includegraphics[width=6.5cm,clip]{shishov_fig2.eps}\end{figure}](/articles/aa/full/2003/23/aa2855/img107.gif)
![\begin{figure}
\par\includegraphics[width=6.5cm,clip]{shishov_fig3.eps}\end{figure}](/articles/aa/full/2003/23/aa2855/img108.gif)
![\begin{figure}
\par\includegraphics[width=8.8cm,clip]{shishov_fig4.eps}\end{figure}](/articles/aa/full/2003/23/aa2855/img111.gif)
![\begin{figure}
\par\includegraphics[width=8.8cm,clip]{shishov_fig5.eps}\end{figure}](/articles/aa/full/2003/23/aa2855/img112.gif)
![\begin{figure}
\par\includegraphics[width=8.8cm,clip]{shishov_fig7.eps}\end{figure}](/articles/aa/full/2003/23/aa2855/img119.gif)
![\begin{figure}
\par\includegraphics[width=8.8cm,clip]{shishov_fig6.eps}\end{figure}](/articles/aa/full/2003/23/aa2855/img120.gif)
![\begin{figure}
\par\includegraphics[width=6.5cm,clip]{shishov_fig8.eps}\end{figure}](/articles/aa/full/2003/23/aa2855/img126.gif)
![\begin{figure}
\par\includegraphics[width=7.7cm,clip]{shishov_fig9.eps}\end{figure}](/articles/aa/full/2003/23/aa2855/img133.gif)
![\begin{figure}
\par\includegraphics[width=6.3cm,clip]{shishov_fig10.eps}\end{figure}](/articles/aa/full/2003/23/aa2855/img146.gif)
![\begin{eqnarray*}K(n) = \frac{\Gamma (n/2)}{[\pi^{3/2} \Gamma ((n-3)/2)]} = 5
\times 10^{-2}.
\end{eqnarray*}](/articles/aa/full/2003/23/aa2855/img161.gif)