A&A 404, 661-668 (2003)
DOI: 10.1051/0004-6361:20030496
B. Barbuy1 - M.-N. Perrin2 - D. Katz3 - P. Coelho1 - R. Cayrel2 - M. Spite3 - C. Van 't Veer-Menneret3
1 - Universidade de São Paulo, Rua do Matão 1226, São Paulo 05508-900,
Brazil
2 -
Observatoire de Paris, 61 av. de l'Observatoire, 75014 Paris, France
3 -
Observatoire de Paris-Meudon, 92195 Meudon, France
Received 30 August 2000 / Accepted 20 March 2003
Abstract
We have computed a grid of synthetic spectra in the
wavelength range
![]() 4600-5600 Å
using revised model atmospheres,
for a range of atmospheric parameters and
values of [
4600-5600 Å
using revised model atmospheres,
for a range of atmospheric parameters and
values of [
![]() and +0.4.
The Lick indices Fe5270, Fe5335, Mgb and Mg2 are measured
on the grid spectra for FWHM = 2 to 8.3 Å.
Relations between the indices Fe5270, Fe5335 and Mg2
and the stellar parameters
effective temperature
and +0.4.
The Lick indices Fe5270, Fe5335, Mgb and Mg2 are measured
on the grid spectra for FWHM = 2 to 8.3 Å.
Relations between the indices Fe5270, Fe5335 and Mg2
and the stellar parameters
effective temperature
![]() ,
[Fe/H] and
[
,
[Fe/H] and
[![]() /Fe], valid in the range
/Fe], valid in the range
![]() K, are presented. These
fitting functions are given for
FWHM = 3.5 and 8.3 Å.
The indices were also
measured for a list of 97 reference stars with
well-known stellar parameters observed at ESO and OHP, and these
are compared to the computed indices.
Finally,
a comparison of the indices measured on the observed spectra
and those derived from
the fitting functions based on synthetic spectra is presented.
K, are presented. These
fitting functions are given for
FWHM = 3.5 and 8.3 Å.
The indices were also
measured for a list of 97 reference stars with
well-known stellar parameters observed at ESO and OHP, and these
are compared to the computed indices.
Finally,
a comparison of the indices measured on the observed spectra
and those derived from
the fitting functions based on synthetic spectra is presented.
Key words: stars: abundances
Libraries of stellar spectra for a range of atmospheric parameters are a useful tool for the study of stellar populations. In the literature libraries of spectra both observed and synthetic (e.g. Allard & Hauschildt 1995; Gunn & Stryker 1983; Jacoby et al. 1984; Kurucz 1993; Lejeune et al. 1997, 1998; Soubiran et al. 1998; Schiavon & Barbuy 1999) are used in calculations of population synthesis (e.g. Bruzual & Charlot 1993, 2003). Spectral indices, among which the most used are the Lick Fe5270 and Fe5335, Mgb and Mg2 ones (Burstein et al. 1984; Faber et al. 1985; Worthey et al. 1994), are also of great interest in studies of composite systems (e.g. Gorgas et al. 1993; Worthey 1994; Worthey et al. 1994).
Indices derived from the computation of synthetic spectra were presented by
Gulati et al. (1993), where the ATLAS code,
line lists and model atmospheres by Kurúcz (1993)
were employed;
Barbuy (1994) computed Mg2 for representative stellar evolutionary stages
of globular clusters, for metallicities in the range
![]() ,
and composite spectra for single-aged
populations, deriving a calibration of Mg2 vs. [Fe/H] and [Mg/Fe].
Tripicco & Bell (1995, hereafter TB95) computed a series of 21 Lick indices,
taking
into account changes in the abundances of individual elements.
For each of the elements C, N, O, Mg, Fe, Ca, Na, Si, Cr and Ti,
calculations with different abundance values were carried out,
and effects of the abundance changes of each of these particular elements
on the different indices were measured.
,
and composite spectra for single-aged
populations, deriving a calibration of Mg2 vs. [Fe/H] and [Mg/Fe].
Tripicco & Bell (1995, hereafter TB95) computed a series of 21 Lick indices,
taking
into account changes in the abundances of individual elements.
For each of the elements C, N, O, Mg, Fe, Ca, Na, Si, Cr and Ti,
calculations with different abundance values were carried out,
and effects of the abundance changes of each of these particular elements
on the different indices were measured.
In the present work we compute synthetic spectra, using revised
lists of atomic and molecular data and revised model atmospheres,
thus improving the grid of synthetic spectra
as used by Cayrel et al. (1991).
The Fe5270, Fe5335, Mgb and Mg2 indices are measured on the
grid spectra, convolved with Gaussians of
FWHM = 2.0 to 8.3 Å.
A comparison between the synthetic indices and those
measured on a sample of reference stars are presented.
Our intent is to reveal the effects caused on the indices by
changes in the abundances of all the ![]() -elements
at the same time, therefore in this respect a different approach
relative to that by TB95.
Finally, fitting functions of the indices
Fe5270, Fe5335 and Mg2 measured on
synthetic spectra, convolved with
FWHM = 3.5 and 8.3 Å,
are presented.
-elements
at the same time, therefore in this respect a different approach
relative to that by TB95.
Finally, fitting functions of the indices
Fe5270, Fe5335 and Mg2 measured on
synthetic spectra, convolved with
FWHM = 3.5 and 8.3 Å,
are presented.
In Sect. 2 the theoretical grid is described. In Sect. 3 the theoretical indices are reported, and their behaviour with respect to stellar parameters is studied. In Sect. 4 the observed spectra and corresponding indices are reported. A summary is given in Sect. 5. In Appendix A the fitting functions coefficients are presented. In Appendix B the list of observed stars and corresponding measured indices are listed.
The code for spectrum synthesis is an improved version of that presented in Cayrel et al. (1991), where hydrogen lines are included. LTE is assumed for the synthesis, and for the hydrogen lines a revised version of the code presented in Praderie (1967) was employed.
Abundances are adopted from Grevesse et al. (1996). Oscillator strengths for atomic lines are adopted from Fuhr et al. (1988), Martin et al. (1988) and Wiese et al. (1969) whenever available, otherwise they were obtained by fitting the solar spectrum.
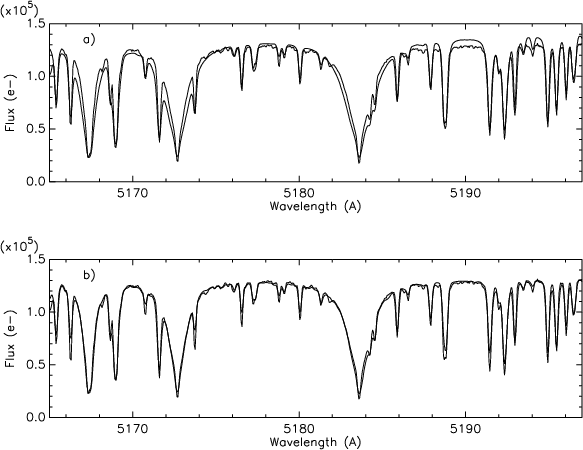 |
Figure 1: Solar spectrum observed (thick lines) at a resolution of R = 42 000 with the ELODIE spectrograph compared to synthetic spectra (thin lines) computed with revised ATLAS9 models (Sect. 2.1). Damping constants and oscillator strengths were obtained from a fit to the solar spectrum employing a) the HM74 model; b) ATLAS9 solar atmospheric model computed in this work, for which the atomic constants were fitted. |
| Open with DEXTER | |
In order to fit the damping constants, it is important to be consistent with the models to be used in the calculation of the grid. In fact atomic constants fitted to the center of the solar disk using the semi-empirical Holweger & Müller (1974, hereafter HM74) solar model atmosphere, showed not to be consistent with calculations for giants, where too large line wings have resulted. A revision of all constants using the integrated solar spectrum (Kurúcz et al. 1984) and a solar model atmosphere computed in the same way as those used for the grid was necessary. This is illustrated in Fig. 1a showing the solar spectrum fitted with constants suitable to the HM74 model, but using the present grid of model atmospheres (see Sect. 2.1) for the solar parameters. The wings of the MgI lines are clearly too strong. In Fig. 1b we show the calculation with revised atomic parameters and the solar model of the present grid. It proved to be very important to correct damping contants, given that the discrepancy between calculation and observation becomes increasingly pronounced with the strength of the MgI lines. We have previously computed a grid with atomic parameters derived for the solar spectrum employing the HM74 model, and the indices measured for giants were much stronger than expected.
In order to check our damping constants (and therefore the
gf-values, which are determined depending on the adopted
damping constant) for FeI and MgI triplet lines,
we have computed the damping constants
based on the tables of damping constants from the collisional
broadening theory of Anstee et al. (1997, hereafter AOR97).
For this purpose, we obtained the list of FeI lines from
Kurúcz (1993), which includes the atomic transitions, available
in his CD-ROM 23 and at the web address
http://cfa-www.harvard.edu/amdata/ampdata/kurucz23/sekur.html.
We selected the Fe I lines with solar equivalent widths stronger than
![]() ,
and free of blends, as well as the triplet
lines of Mg I. We compared our derived
interaction constants, as compared to the damping constants derived
from Anstee & O'Mara (1995), Barklem & O'Mara (1997) and
Barklem et al. (1998). The interaction constant C6 relates
to the damping constant through the formula
,
and free of blends, as well as the triplet
lines of Mg I. We compared our derived
interaction constants, as compared to the damping constants derived
from Anstee & O'Mara (1995), Barklem & O'Mara (1997) and
Barklem et al. (1998). The interaction constant C6 relates
to the damping constant through the formula
![]() C62/5(v is the velocity and
C62/5(v is the velocity and ![]() is the density of hydrogen atoms).
In Table 1 the line parameters and the interaction
constants from our fits and those by the AOR97 method
are reported for strong lines; the differences are within a factor 3,
therefore negligible.
For example, this causes a change of about
<0.5% in the Mg2 index;
in order to compensate for this amount, the
is the density of hydrogen atoms).
In Table 1 the line parameters and the interaction
constants from our fits and those by the AOR97 method
are reported for strong lines; the differences are within a factor 3,
therefore negligible.
For example, this causes a change of about
<0.5% in the Mg2 index;
in order to compensate for this amount, the ![]() value would have to be changed by
value would have to be changed by ![]() 0.12 dex.
0.12 dex.
The molecular lines of the following molecules were
taken into account in the calculations:
MgH (A![]() -X
-X![]() ),
C2 (A
),
C2 (A![]() -X
-X![]() ),
CN blue (B
),
CN blue (B![]() -X
-X![]() ),
CH (A
),
CH (A![]() -X
-X![]() ),
CH (B
),
CH (B![]() -X
-X![]() ),
CN red (A
),
CN red (A![]() -X
-X![]() ),
TiO
),
TiO ![]() (C
(C![]() -X
-X![]() )
and
TiO
)
and
TiO ![]() (A
(A![]() -X
-X![]() ).
).
Table 1: Comparison of the interaction constant from this work and computed with the collisional broadening theory of Anstee et al. (1997).
In all cases where possible the Franck-Condon factors with dependence on the rotational quantum number J as given in Dwiwedi et al. (1978) and Bell et al. (1979) were computed and adopted. For vibrational bands for which such values were not available, we adopted a constant value kindly made available to us through computations by P. D. Singh, using the code by Jarmain & McCallum (1970).
For the CN blue and CH systems, the line lists by Kurúcz (1993, CD ROM 18) were adopted, where we transformed his tables to our format, recomputing Hönl-London factors using the formulae by Kovács (1969) (a more detailed description is given in Castilho et al. 1999). For the C2 lines we have carried out a detailed comparison between the Kurúcz line list and the laboratory list by Phillips & Davis (1968). The resulting molecular bands are very similar, so that we have kept the laboratory line list in our calculations.
We have adopted the
electronic oscillator strengths
![]() E-3 (Davis et al. 1986; Larsson et al. 1983,
Bauschlicher et al. 1988),
E-3 (Davis et al. 1986; Larsson et al. 1983,
Bauschlicher et al. 1988),
![]() (Duric et al. 1978),
(Duric et al. 1978),
![]() (Kirby et al. 1979),
(Kirby et al. 1979),
![]() (CH A2
(CH A2![]() -X2
-X2
![]() E-3
(Brzozowski et al. 1976), and dissociation potentials
E-3
(Brzozowski et al. 1976), and dissociation potentials
![]() eV,
eV,
![]() eV,
eV,
![]() eV,
eV,
![]() eV,
eV,
![]() eV (Huber & Herzberg 1979).
TiO line lists and constants are described in Schiavon & Barbuy (1999).
eV (Huber & Herzberg 1979).
TiO line lists and constants are described in Schiavon & Barbuy (1999).
Based on the grid of model atmospheres
by Kurúcz (1993), a new grid
covering the effective temperature range
![]() K,
(in steps of 250 K)
using the ATLAS9 code, was computed.
The calculations comprise
models with
K,
(in steps of 250 K)
using the ATLAS9 code, was computed.
The calculations comprise
models with ![]() -elements to iron
ratios
-elements to iron
ratios
![]() and +0.4.
and +0.4.
Three parameters were changed with respect to the original grid, and for this purpose the ATLAS9 code was adapted to a Unix system.
i) The number of layers was increased from
64 to 72. The 8 additional layers represent the
outer atmosphere, with optical depths
![]() .
These extra layers are important in the formation
of the center of strong lines.
.
These extra layers are important in the formation
of the center of strong lines.
ii) The mixing length
to pressure scale height ratio
![]() was adopted, instead
of
was adopted, instead
of ![]() = 1.25 employed in the former models.
This value was suggested by Fuhrmann et al. (1993) and
Van 't Veer-Menneret & Mégessier (1996) as
being more suitable
to reproduce the profile of Balmer lines.
= 1.25 employed in the former models.
This value was suggested by Fuhrmann et al. (1993) and
Van 't Veer-Menneret & Mégessier (1996) as
being more suitable
to reproduce the profile of Balmer lines.
iii) No overshooting was considered, given the problems discussed by Van 't Veer-Menneret & Mégessier (1996), Castelli et al. (1997), Castelli (1999) and Heiter et al. (2002).
The convergence of models was imposed to within
temperature and flux corrections of
![]() K,
K,
![]() %
in the optical depths
%
in the optical depths
![]() and
and
![]() K,
K,
![]() % in the higher and lower
parts of the atmosphere.
% in the higher and lower
parts of the atmosphere.
Cooler models were computed in order to have reliability
on the fitting functions for
![]() around 4000 K, such that
the behaviour of curves at 4000 K takes into account a range of
points above and below this temperature.
around 4000 K, such that
the behaviour of curves at 4000 K takes into account a range of
points above and below this temperature.
The grid of stellar synthetic spectra is computed in the
wavelength range
![]() 4600-5600 Å and covers
the effective temperatures
4600-5600 Å and covers
the effective temperatures
![]() K in steps of 250 K, gravities
K in steps of 250 K, gravities
![]() in steps of 0.5,
and metallicities
in steps of 0.5,
and metallicities
![]() ,
-2.5, -2.0, -1.5, -1.0,
-0.5, -0.3, -0.2, -0.1, 0.0 and +0.3.
Two values of the abundance ratio of
,
-2.5, -2.0, -1.5, -1.0,
-0.5, -0.3, -0.2, -0.1, 0.0 and +0.3.
Two values of the abundance ratio of ![]() -elements to iron
-elements to iron
![]() and +0.4 were assumed.
and +0.4 were assumed.
The C and N values which are modified in giants due to convective mixing
were adopted to be
![]() and
and
![]() for giants of
for giants of
![]() and solar for higher gravity stars. The changes in C and N
have strong effects in CH and CN bands.
The values assumed for microturbulence velocity are
and solar for higher gravity stars. The changes in C and N
have strong effects in CH and CN bands.
The values assumed for microturbulence velocity are
![]() km s-1 for
km s-1 for
![]() ,
,
![]() km s-1 for
km s-1 for
![]() ,
and
,
and
![]() km s-1 for
km s-1 for
![]() .
.
Note that the grid was used to estimate atmospheric parameters
for different samples of low resolution observed spectra, where
errors were found to be of the order of
![]() K,
K,
![]() ,
,
![]() (Katz 2000a,b, 2001).
(Katz 2000a,b, 2001).
In Fig. 2 is given a comparison between
synthetic spectra in the MgI triplet lines region,
computed with
![]() K,
K,
![]() ,
,
![]() and
and
![]() and +0.4.
and +0.4.
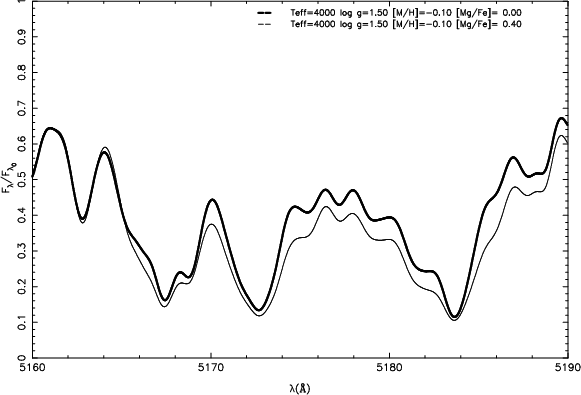 |
Figure 2:
Spectral region containing the MgI triplet lines
computed with
|
| Open with DEXTER | |
In Fig. 3 is given the comparison between
the observed spectrum of M67: F108 (Table B.1) and the corresponding
synthetic spectrum
computed with
![]() K,
K,
![]() ,
,
![]() and
and
![]() .
.
The synthetic spectra of the grid were convolved
with FWHM = 2, 3, 3.5, 4, 6, 8 and 8.3 ![]() ,
the latter corresponding
to the observations of the Lick group (Worthey & Ottaviani 1997).
The Lick indices Fe5270, Fe5335, Mgb and Mg2, in their
early (Burstein et al. 1984; Faber et al. 1985) and revised
(Worthey et al. 1994) definitions,
were measured on the whole
grid of synthetic spectra, for all the convolutions
considered. The definitions of the indices are reproduced in Table 2.
In this paper we will focus the calculations on the
Worthey et al. (1994) definition
of the indices.
,
the latter corresponding
to the observations of the Lick group (Worthey & Ottaviani 1997).
The Lick indices Fe5270, Fe5335, Mgb and Mg2, in their
early (Burstein et al. 1984; Faber et al. 1985) and revised
(Worthey et al. 1994) definitions,
were measured on the whole
grid of synthetic spectra, for all the convolutions
considered. The definitions of the indices are reproduced in Table 2.
In this paper we will focus the calculations on the
Worthey et al. (1994) definition
of the indices.
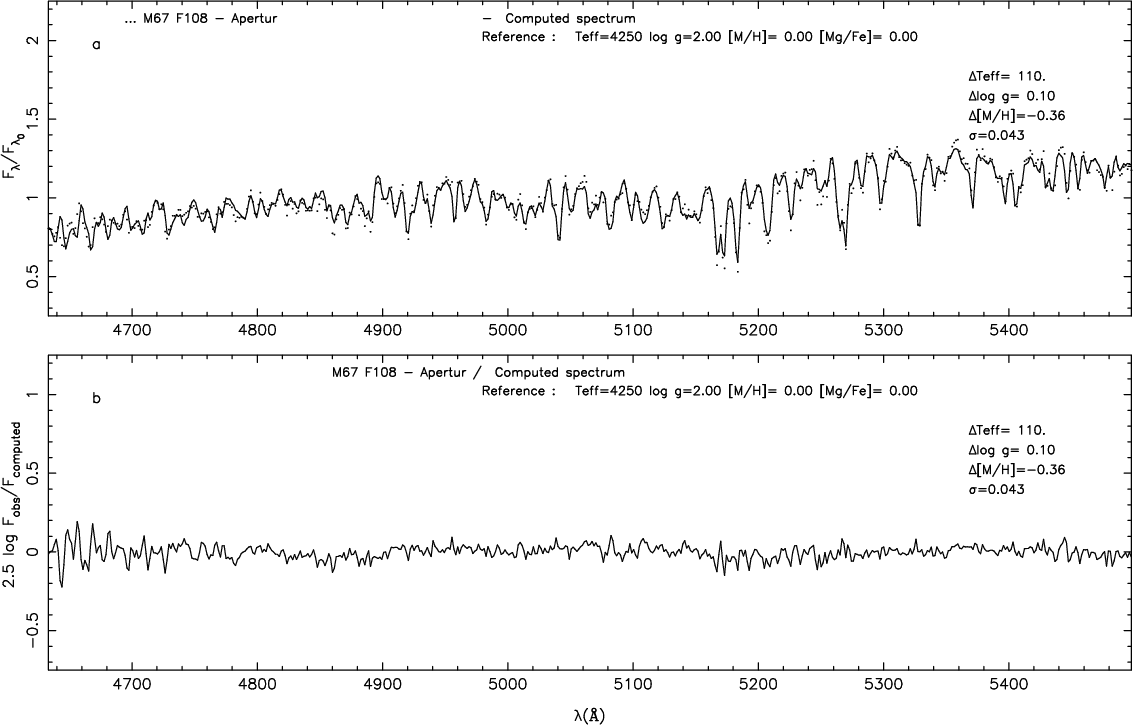 |
Figure 3:
Comparison of the spectrum of M67: F108 and
synthetic spectrum
computed with
|
| Open with DEXTER | |
Table 2: Definition of indices, where "1984'' corresponds to Burstein et al. (1984) and Faber et al. (1985), and "1994'' to Worthey et al. (1994).
In Figs. 4a-d the Fe5270, Fe5335, Mgb and Mg2 indices are plotted
as a function of spectral resolution (FWHM in ![]() ).
These figures make it clear that
the Mgb and Mg2 indices show essentially no dependence
on resolution, showing how robust these indices are.
).
These figures make it clear that
the Mgb and Mg2 indices show essentially no dependence
on resolution, showing how robust these indices are.
The Fe5270 and Fe5335 indices are
weaker for spectra with
![]() -element enhancements than those
with
-element enhancements than those
with
![]() .
The same effect was present in the calculations by TB95.
This is expected, because the
.
The same effect was present in the calculations by TB95.
This is expected, because the ![]() -elements
are electron donors (magnesium being the most important
in this respect). With
-elements
are electron donors (magnesium being the most important
in this respect). With ![]() enhancement the electron
pressure increases, therefore the continuum absorption by
H- increases. As a consequence,
a certain optical depth will be reached
at a shallower layer, where the gas pressure is lower,
therefore the line wings will be less strong.
enhancement the electron
pressure increases, therefore the continuum absorption by
H- increases. As a consequence,
a certain optical depth will be reached
at a shallower layer, where the gas pressure is lower,
therefore the line wings will be less strong.
![\begin{figure}
\par\includegraphics[width=14.5cm]{ms10234.f4}\par
\end{figure}](/articles/aa/full/2003/23/aa10234/img91.gif) |
Figure 4:
a) Fe5270 and b) Fe5330 (as defined by Worthey et al. 1994) vs. FWHM ( Å) for dwarfs of
|
| Open with DEXTER | |
The comparison between our calculations and those by TB95
are difficult to establish, given that those authors computed
variations of the indices by increasing the abundance of one
unique element one by one, whereas in the present work,
the calculations were carried out for an enhancement of all
![]() -elements at the same time. The
-elements at the same time. The ![]() -elements
considered are O, Mg, Si, S, Ca and Ti; Ti nucleosynthesis is
in principle
associated to the Fe-peak elements (Thielemann et al. 1996),
however the observations strongly suggest a behaviour as an
-elements
considered are O, Mg, Si, S, Ca and Ti; Ti nucleosynthesis is
in principle
associated to the Fe-peak elements (Thielemann et al. 1996),
however the observations strongly suggest a behaviour as an
![]() -element (e.g. Pompéia et al. 2002; François et al. 2003).
In addition to that, the measurement of the indices is strongly dependent
on the continuum, which is affected in two ways:
(i) molecular bands or a number of atomic lines
involving the
-element (e.g. Pompéia et al. 2002; François et al. 2003).
In addition to that, the measurement of the indices is strongly dependent
on the continuum, which is affected in two ways:
(i) molecular bands or a number of atomic lines
involving the ![]() -elements will affect indices in the
pseudo-continuum as well as the features;
(ii) the true continuum is dominated by H-, and therefore it will
depend on electron donors, among which the
-elements will affect indices in the
pseudo-continuum as well as the features;
(ii) the true continuum is dominated by H-, and therefore it will
depend on electron donors, among which the ![]() -elements Mg
and Si are
important, whereas Ti is not important in this respect.
In conclusion, due to
the combination of all these effects, it is difficult to make a
comparison with the TB95 method of calculation and results.
-elements Mg
and Si are
important, whereas Ti is not important in this respect.
In conclusion, due to
the combination of all these effects, it is difficult to make a
comparison with the TB95 method of calculation and results.
It is important to note that calculations of ![]() -enhanced
spectra is useful for applications in stellar population
synthesis in the study of integrated spectra of elliptical galaxies.
A discussion on <Fe> and
-enhanced
spectra is useful for applications in stellar population
synthesis in the study of integrated spectra of elliptical galaxies.
A discussion on <Fe> and ![]() -element
enhancements in ellipticals can be found in
e.g. Greggio (1997) and Trager et al. (2000) and references therein.
The calculations of TB95 were used
by Trager et al. (2000) to infer relations between indices and
Fe abundances and the enhancement of a few selected elements.
-element
enhancements in ellipticals can be found in
e.g. Greggio (1997) and Trager et al. (2000) and references therein.
The calculations of TB95 were used
by Trager et al. (2000) to infer relations between indices and
Fe abundances and the enhancement of a few selected elements.
Based on the grid of indices derived for 2660
synthetic spectra with parameters in the range
described in Sect. 2.2, we appplied the Levenberg-Marquardt
method (e.g. Press et al. 1992) to derive functions
of the form
![]() (where
(where
![]() ), and [exp]
indicates that
the index is either the polynomial or the exponential of
the polynomial, as indicated in Tables A of the Appendix.
), and [exp]
indicates that
the index is either the polynomial or the exponential of
the polynomial, as indicated in Tables A of the Appendix.
The resulting coefficients for the indices Fe5270, Fe5335 and Mg2 in their Worthey et al. (1994) definitions are given in Tables A.1-A.3 for FWHM = 8.3 Å, and Tables A.4-A.6 for FWHM = 3.5 Å. Each set of fitting functions was divided into four parameter intervals. For the index Mg2, two of the intervals are not in the exponential form (as indicated in the Tables of Appendix A), in which cases the index is given directly by the polynomial.
It is important to note that since these indices were measured
on synthetic spectra, computed in absolute flux,
they are not in the Lick System.
In order to evaluate the deviation from the Lick system,
our fitting functions for
FWHM = 8.3 Å
were applied to the Worthey et al. (1994) sample
and compared with the measured indices (as
can be seen in Fig. 5 for the index
Fe5335).
Systematic shifts can be seen, and we interpret them as
constants needed to calibrate our theoretical fitting functions to
the Lick System. These constants were derived
by applying a linear regression to the plots, fixing the slope to 1.
The adopted values of [![]() /Fe] for the Lick sample
are described below in Sect. 4.1.
/Fe] for the Lick sample
are described below in Sect. 4.1.
The same procedure was applied to the fitting functions for FWHM = 3.5 Å. In this case, we used our own observations from Table B.3. These observations were flux calibrated, so that we are providing the calibration of the fitting functions for FWHM = 3.5 Å in a flux calibrated system.
The derived calibration constants are provided in Table A.7.
The Mgb index shows a more complicated behaviour, as illustrated
in Fig. 6, where ln (Mgb) vs. [Fe/H] is shown for 4 effective temperatures
and
![]() .
For the cooler stars the behaviour is smooth, whereas
for
.
For the cooler stars the behaviour is smooth, whereas
for
![]() K the dependence of the index with metallicity
is less smooth; the MgI lines are
stronger, but the index is lower, due probably to an
enhanced continuum absorption. We preferred not to present a fitting
function for this index, since it would involve several functions
for limited ranges of parameters.
Note that the difficulties in finding fitting functions from the whole
grid of synthetic spectra does not appear when using observed
indices: Fig. 9 of Schiavon et al. (2002) shows a clear separation
between dwarfs and giants, therefore a clear dependence on gravity,
and a well behaved function of temperature. The same is obtained
with the Mgb indices computed from the synthetic spectra, if we
select the same ranges of parameters as shown in Schiavon et al. (2002).
More complicated dependences on parameters appear however
when the whole space of stellar parameters is used, which is possible
with the grid of synthetic spectra.
K the dependence of the index with metallicity
is less smooth; the MgI lines are
stronger, but the index is lower, due probably to an
enhanced continuum absorption. We preferred not to present a fitting
function for this index, since it would involve several functions
for limited ranges of parameters.
Note that the difficulties in finding fitting functions from the whole
grid of synthetic spectra does not appear when using observed
indices: Fig. 9 of Schiavon et al. (2002) shows a clear separation
between dwarfs and giants, therefore a clear dependence on gravity,
and a well behaved function of temperature. The same is obtained
with the Mgb indices computed from the synthetic spectra, if we
select the same ranges of parameters as shown in Schiavon et al. (2002).
More complicated dependences on parameters appear however
when the whole space of stellar parameters is used, which is possible
with the grid of synthetic spectra.
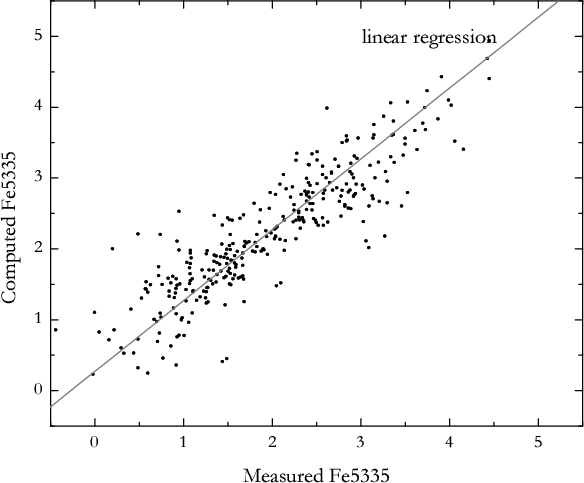 |
Figure 5: Comparison of the index Fe5335 between the measured indices of the Worthey et al. (1994) sample and the computed indices from our fitting functions using the stellar parameters provided for that sample. The systematic shift gives the correction that converts the indices derived by the fitting functions to the Lick system. |
| Open with DEXTER | |
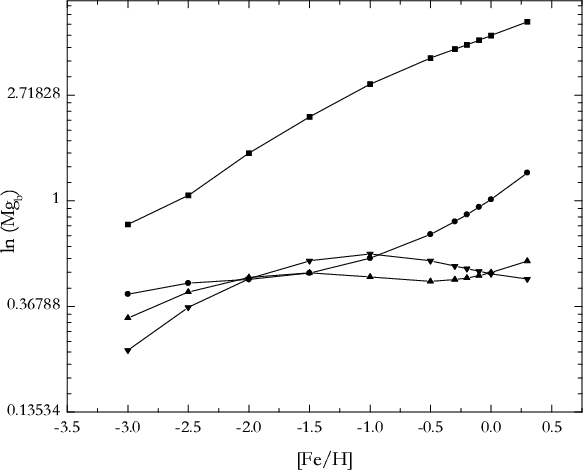 |
Figure 6:
ln(Mgb) vs. [Fe/H] for
|
| Open with DEXTER | |
For the comparison of observed and synthetic indices we used the fitting functions for FWHM = 3.5 Å.
In order to compare the indices measured on the computed
and observed spectra, we assumed the following values
of the ![]() -to-iron ratios, based
on results from the literature
(e.g. McWilliam 1997; Pompéia 2002; Pompéia et al. 2002;
François et al. 2003):
-to-iron ratios, based
on results from the literature
(e.g. McWilliam 1997; Pompéia 2002; Pompéia et al. 2002;
François et al. 2003):
As explained in Sect. 3.1, for the Fe5270 and Fe5335, a constant (see Table A.7) must be subtracted from the computed indices since we verify that the computed indices are stronger than the observed ones.
This behaviour of the computed vs. observed Fe features can be
partly explained by (a) the calculations are carried out in LTE,
therefore the bottom of strong lines are not reproduced, being less
deep in the calculations; (b) even in non-LTE,
as investigated by McWilliam et al. (1995),
the calculation of strong lines are affected by the fact that the
model atmospheres do not account correctly for the upper layers and
the photosphere/chromosphere boundary; the ATLAS models, which we use
here, are
more suitable than the MARCS models (e.g. Plez et al. 1992)
in this respect, due to a more
complete layer coverage. On the other hand, the photosphere/chromosphere
boundary would cause a 0.1 dex underestimation of an FeI line of
equivalent width larger than 100 m![]() ,
for a metal-poor giant, according to McWilliam
et al. (1995) and the same effect is likely to
occur in the present calculations.
Note that effects (a) and (b) are interrelated;
(c) possible uncertainties in the atomic parameters, given that the
Fe indices are composed of several overlapping strong lines,
which makes it difficult to detect discrepancies even at very
high resolution.
,
for a metal-poor giant, according to McWilliam
et al. (1995) and the same effect is likely to
occur in the present calculations.
Note that effects (a) and (b) are interrelated;
(c) possible uncertainties in the atomic parameters, given that the
Fe indices are composed of several overlapping strong lines,
which makes it difficult to detect discrepancies even at very
high resolution.
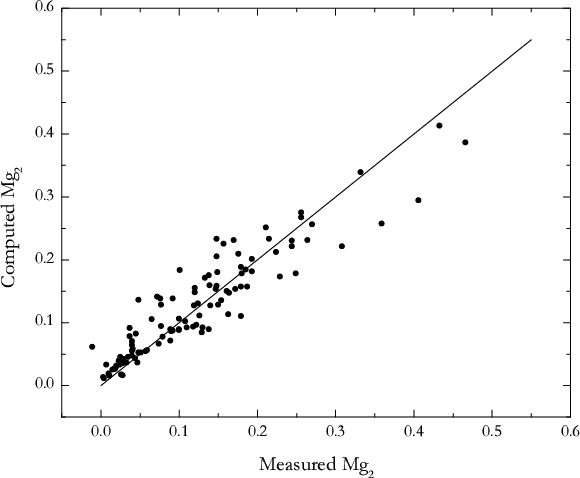 |
Figure 7: Computed vs. measured Mg2 indices for a sample of 97 observed stars listed in Tables B.1-B.3. The solid line is a 1:1 line that would correspond to a perfect match. Standard deviation obtained: 0.006. |
| Open with DEXTER | |
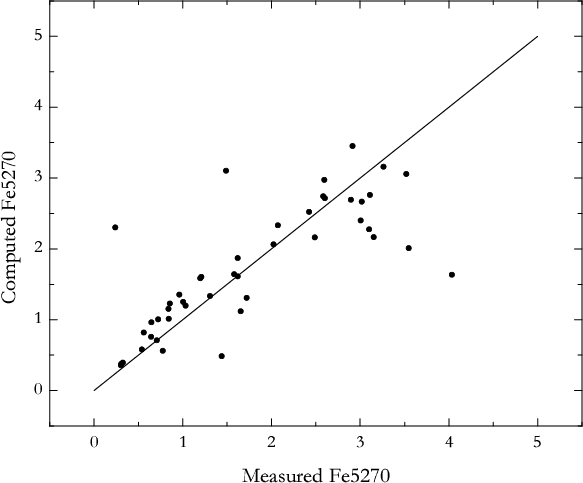 |
Figure 8: Computed vs. measured Fe5270 indices for the stars listed in Table B.3. Solid line: same as in Fig. 7. Standard deviation obtained: 0.07. |
| Open with DEXTER | |
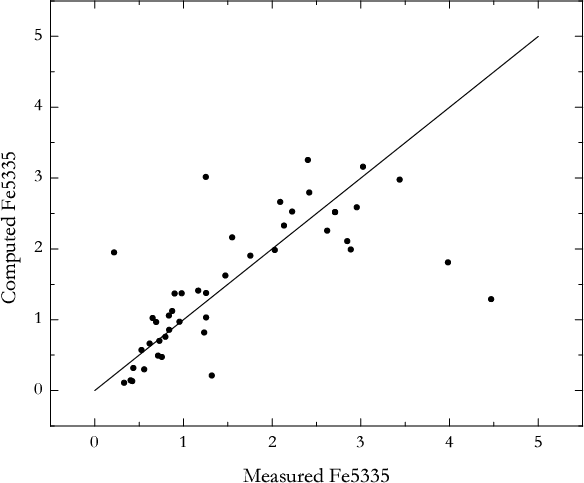 |
Figure 9: Computed vs. measured Fe5270 indices for the stars listed in Table B.3. Solid line: same as in Fig. 7. Standard deviation obtained: 0.09. |
| Open with DEXTER | |
We have computed a grid of synthetic spectra in the wavelength
interval
![]() 4600-5600 Å, for
stellar parameters
in the range of effective temperatures
4600-5600 Å, for
stellar parameters
in the range of effective temperatures
![]() K,
gravities
K,
gravities
![]() ,
metallicities
,
metallicities
![]() ,
-2.5, -2.0, -1.5, -1.0,
-0.5, -0.3, -0.2, -0.1, 0.0 and +0.3, and
,
-2.5, -2.0, -1.5, -1.0,
-0.5, -0.3, -0.2, -0.1, 0.0 and +0.3, and ![]() -elements
to iron
-elements
to iron
![]() and +0.4.
and +0.4.
The Lick indices Fe5270, Fe5335, Mgb and Mg2 were measured
on the grid of synthetic spectra, and a grid of indices was
obtained. Fitting functions for
Fe5270, Fe5335 and Mg2 were then derived describing
the index value as a function
![]() ,
,
![]() ,
,
![]() ). These relations can be
useful for stellar population studies.
). These relations can be
useful for stellar population studies.
A comparison of computed indices to those measured on spectra of reference stars with well-known stellar parameters shows good agreement.
Acknowledgements
We are grateful to the referees A. McWilliam and S. Trager for several important suggestions that considerably improved this paper. BB acknowledges partial financial support from the Observatory of Paris, CNPq/CNRS and Fapesp. PC acknowledges a Fapesp PhD fellowship n2000/05237-9.