 |
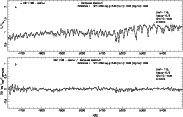
Figure 1: Solar spectrum observed (thick lines) at a resolution of R = 42 000 with the ELODIE spectrograph compared to synthetic spectra (thin lines) computed with revised ATLAS9 models (Sect. 2.1). Damping constants and oscillator strengths were obtained from a fit to the solar spectrum employing a) the HM74 model; b) ATLAS9 solar atmospheric model computed in this work, for which the atomic constants were fitted. |
| Open with DEXTER | |
In the text
 |
Figure 2:
Spectral region containing the MgI triplet lines
computed with
|
| Open with DEXTER | |
In the text
 |
Figure 3:
Comparison of the spectrum of M67: F108 and
synthetic spectrum
computed with
|
| Open with DEXTER | |
In the text
![\begin{figure}
\par\includegraphics[width=14.5cm]{ms10234.f4}\par
\end{figure}](/articles/aa/full/2003/23/aa10234/Timg91.gif) |
Figure 4:
a) Fe5270 and b) Fe5330 (as defined by Worthey et al. 1994) vs. FWHM ( Å) for dwarfs of
|
| Open with DEXTER | |
In the text
 |
Figure 5: Comparison of the index Fe5335 between the measured indices of the Worthey et al. (1994) sample and the computed indices from our fitting functions using the stellar parameters provided for that sample. The systematic shift gives the correction that converts the indices derived by the fitting functions to the Lick system. |
| Open with DEXTER | |
In the text
 |
Figure 6:
ln(Mgb) vs. [Fe/H] for
|
| Open with DEXTER | |
In the text
 |
Figure 7: Computed vs. measured Mg2 indices for a sample of 97 observed stars listed in Tables B.1-B.3. The solid line is a 1:1 line that would correspond to a perfect match. Standard deviation obtained: 0.006. |
| Open with DEXTER | |
In the text
 |
Figure 8: Computed vs. measured Fe5270 indices for the stars listed in Table B.3. Solid line: same as in Fig. 7. Standard deviation obtained: 0.07. |
| Open with DEXTER | |
In the text
 |
Figure 9: Computed vs. measured Fe5270 indices for the stars listed in Table B.3. Solid line: same as in Fig. 7. Standard deviation obtained: 0.09. |
| Open with DEXTER | |
In the text