![\begin{figure}
\par\includegraphics[width=5.7cm,clip]{init.eps}\includegraphics[...
....7cm,clip]{layer.eps}\includegraphics[width=5.cm,clip]{pressure.eps}\end{figure}](/articles/aa/full/2003/20/aa3433/img4.gif) |
Figure 1: The initial perturbation to vy ( left panel), the shear layer ( middle panel), and the pressure evolution throughout the computation at the upper boundary ( right panel). |
| Open with DEXTER | |
A&A 403, 425-432 (2003)
DOI: 10.1051/0004-6361:20030434
M. Terra-Homem - R. Erdélyi
Space and Atmosphere Research Centre, Dept. of Applied Mathematics, University of Sheffield, Hicks Building, Hounsfield Road, Sheffield S3 7RH, UK
Received 20 December 2002 / Accepted 21 March 2003
Abstract
In the present paper we study the absolute and convective nature of instabilities in open shear flows by carrying out fully non-linear adiabatic 2-D hydrodynamic numerical simulations. The purpose is to identify what influences an instability to become from absolutely to convectively unstable or vice-versa. First we study the case of incompressible fluid approximation and compare our results with the analytic solution of Huerre & Monkewitz (1985). Next we derive the effect of compressibility and of viscosity on the transition from absolute to convective instability of an open shear flow. We found, numerically, the value of the mean flow for which perturbations change from absolutely to convectively unstable. We fully recover the results of the approximate analytic solution. We found that an inviscid incompressible fluid is the most unstable configuration. We also found that compressibility and viscosity decrease the value of the mean flow for which the transition from absolute to convective instability occurs, and that viscosity has a stronger influence than compressibility.
Key words: instabilities - convection - hydrodynamics - methods: numerical - plasmas
| |
Figure 1: The initial perturbation to vy ( left panel), the shear layer ( middle panel), and the pressure evolution throughout the computation at the upper boundary ( right panel). |
| Open with DEXTER | |
Shear flows are present in most solar-terrestrial applications and it is of fundamental importance to study their stability. Examples of such flows include plasma flows in the vicinity of the magnetopause of planets (Sauer & Dubinin 2000; Laxton et al. 1997), the boundaries between fast and slow streams of the solar wind (Korzhov et al. 1985), solar differential rotation (Collier Cameron et al. 2002), sunspot penumbrae (Athay et al. 1986) and the flow in the vicinity of the heliopause. To study the stability of shear flows with respect to perturbations finite in space one has to solve an initial-value problem. When the shear flow is unstable there can be two different scenarios. In the first scenario the initial finite perturbation grows exponentially at any spatial position (i.e. the instability is called absolute). Therefore an analysis has to tackle the full time-dependent problem. In the second scenario the initial perturbation also grows exponentially, but it is swept away by the flow so fast that perturbations decay at any fixed spatial position (i.e. the instability is called convective), eventually leaving the flow unperturbed as time approaches large values. In this latter case it is more suitable to study these spatially growing waves. The classification of these instabilities is important for the understanding of the physical processes in solar plasmas and space weather, in particular for the interpretation of in-situ observational data obtained by satellites (e.g. CLUSTER, STEREO or Solar-B).
There have been a few studies of absolute and convective instabilities in astrophysical aspects. Wright et al. (2002) and Mills et al. (2000) studied a boundary with continuous velocity profile and a discontinuous magnetic field which was representative of the flank regions of the Earth's magnetopause. Ruderman et al. (2002) derived analytical solutions for the heliopause geometry and found that it was convectively unstable in the reference frame of the Sun (see also the review by Ruderman 2000). Garnier et al. (2002) carried out numerical experiments for the Eckhaus instability were the spatial-temporal defects were linked with the absolute and convective nature of this instability. Suslov (2001) investigated the boundary layers of a region separating absolute and convective instabilities in the case of mixed convection flows. Wicht et al. (2002) studied the stabilility of zonal flows in rotating spherical shells applying it to Jupiter. They found in their study the presence of convective and shear instabilities, which competed with each other in the rotating spherical shell. This effect offered an explanation for the fact that the Jovian zonal jet structure is much weaker at the higher latitudes.
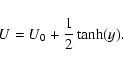
The purpose of our investigation here is to study open shear layers for various physical approximations including the compressible and viscosity description. We establish, numerically, how these approximations influence the separating thresholds of convective and absolute instabilities. We set up a fairly common equilibrium for shear flows where the shear layer is approximated by a hyperbolic tangent velocity profile. Such an equilibrium seems to be convenient mainly because of the smooth properties of the hyperbolic functions. Huerre & Monkewitz (1985) carried out studies of such shear flows in incompressible fluids using the analytic technique of asymptotic theory and the criterion derived by Briggs (1964) and Bers (1975). The analytic asymptotic solution of an incompressible inviscid fluid with free shear layers and varying velocity ratio
![]() ,
where
,
where ![]() is the velocity difference between the two streams and
is the velocity difference between the two streams and ![]() their average velocity, has shown that the layer is convectively unstable for R smaller than Rt=1.3. For values of R bigger than Rt the layer is absolutely unstable.
their average velocity, has shown that the layer is convectively unstable for R smaller than Rt=1.3. For values of R bigger than Rt the layer is absolutely unstable.
In Sect. 2 we present the numerical method used, and the setup of the configuration that was perturbed. The numerical output of the simulations are presented in Sect. 3, and the most important results are summarised in Sect. 4.
The set of adiabatic hydrodynamic equations read as follows:
| (1) | |||
| (2) | |||
| (3) |
After this initial perturbation the evolution with time can be observed throughout the whole computational domain. The boundary conditions are all continuous so that reflections can be minimised in order to simulate the free shear layer. Also the pressure at the boundary must be constant so that it may be considered a free boundary (see Drazin & Reid 1981). This later condition is checked throughout the simulations and is verified by e.g. the right panel of Fig. 1.
![\begin{figure}
\par\resizebox{\hsize}{!}{\includegraphics[clip]{abs.eps}}\\
\vspace{3mm}
\resizebox{\hsize}{!}{\includegraphics[clip]{conv.eps}}\end{figure}](/articles/aa/full/2003/20/aa3433/img17.gif) |
Figure 2: The evolution of the mean vertical component of the velocity. The upper panel depicts an absolute instability while a convectiveinstability can be observed on the lower panel. |
| Open with DEXTER | |
To find the critical value of mean flow for a transition from absolute to convective instability a growth rate ![]() of the perturbation is assigned to each simulation. This growth rate is calculated by assuming that the perturbation has an exponential growth in the form of
of the perturbation is assigned to each simulation. This growth rate is calculated by assuming that the perturbation has an exponential growth in the form of
![]() ,
which should be true as long as the perturbation remains linear. Since
,
which should be true as long as the perturbation remains linear. Since ![]() characterises the evolution with time, if it is positive that means that it is an absolute instability because it grows as time increases. On the other hand, however, if
characterises the evolution with time, if it is positive that means that it is an absolute instability because it grows as time increases. On the other hand, however, if ![]() is negative that means that there is a convective instability, because the perturbation decays as time progresses. To calculate
is negative that means that there is a convective instability, because the perturbation decays as time progresses. To calculate ![]() the mean velocity is plotted with respect to time, as given e.g. in Fig. 2, and an exponential function is fitted.
the mean velocity is plotted with respect to time, as given e.g. in Fig. 2, and an exponential function is fitted.
Because the non-dimensionalisation used in our paper is slightly different from
the one used by Huerre & Monkewitz (1985), a simple transformation
must be used in order to recover the threshold found by Huerre & Monkewitz (1985) in units of mean flow so that a direct comparison can be carried out. Huerre & Monkewitz (1985) found in their analytic studies a threshold
![]() ,
i.e. above that value of a velocity shear perturbations were absolutely unstable. By their definition
,
i.e. above that value of a velocity shear perturbations were absolutely unstable. By their definition
![]() ;
if
;
if ![]() is considered to be unity and R=1.3, then
is considered to be unity and R=1.3, then
![]() .
This means that for mean flows below 0.38 the shear layer is absolutely unstable. Direct comparison can now be made with the threshold value found in the simulations here in the case of an inviscid fluid.
.
This means that for mean flows below 0.38 the shear layer is absolutely unstable. Direct comparison can now be made with the threshold value found in the simulations here in the case of an inviscid fluid.
![\begin{figure}
\par\includegraphics[width=17cm,clip]{evol_inc.eps}\end{figure}](/articles/aa/full/2003/20/aa3433/img26.gif) |
Figure 3: Response of an incompressible flow to an initial perturbation at various snapshots. Streamlines are plotted for two physically distinct behaviours: a) convectively unstable U0=0.4 ( top row), b) and absolutely unstable U0=0.0 ( bottom row). |
| Open with DEXTER | |
![\begin{figure}
\includegraphics[width=11.8cm,clip]{evol_inc2.eps}\end{figure}](/articles/aa/full/2003/20/aa3433/img27.gif) |
Figure 4: Response of an incompressible flow to an initial perturbation. The vertical component of velocity (vy) is plotted for two physically distinct behaviours: convectively unstable U0=0.4 ( left) and absolutely unstable U0=0.0 ( right). |
| Open with DEXTER | |
In the case of incompressible limit the result found by Huerre & Monkewitz (1985) shall be the test case for the validity of the numerical solutions of this paper. In order to assume that these simulations are describing the right physics the asymptotic solution found by Huerre & Monkewitz (1985) must be recovered. In Fig. 5 plots comparing the results of our numerical and the analytical approach by Huerre & Monkewitz (1985), respectively, are shown. In Fig. 5 the dot-dashed vertical line indicates the critical point in which the shear layer changes from being absolute to convectively unstable found by Huerre & Monkewitz (1985), and the solid line represents the numerical result. In fact the results of the two approaches coincide perfectly, i.e.
![]() .
The maximum growth rate is found to be at U0=0, which would be expected since there is no mean flow to sweep away the perturbation. In the incompressible case
.
The maximum growth rate is found to be at U0=0, which would be expected since there is no mean flow to sweep away the perturbation. In the incompressible case
![]() meaning that for stronger mean flows the initial perturbation is swept away and the equilibrium is left intact.
meaning that for stronger mean flows the initial perturbation is swept away and the equilibrium is left intact.
Detailed response of an incompressible and inviscid fluid to the initial perturbations described above at various snapshots is shown in Figs. 3 and 4 for two cases, absolutely unstable, for e.g. U0=0 (i.e.
![]() )
and convectively unstable, for e.g. U0=0.4 (i.e.
)
and convectively unstable, for e.g. U0=0.4 (i.e.
![]() ). Figure 3 shows the time evolution of the flow streamlines while Fig. 4 shows the final snapshot of the vy component of velocity.
). Figure 3 shows the time evolution of the flow streamlines while Fig. 4 shows the final snapshot of the vy component of velocity.
In Fig. 3 it is shown that in a convectively unstable configuration the basic flow is left unperturbed, while in an absolutely unstable configuration the flow is destroyed as expected. In the later case the flow is destroyed by a kind of eddies resembling the eddies in a Kelvin-Helmholtz instability (see Jeong et al. 2000).
![\begin{figure}
\par\resizebox{\hsize}{!}{\includegraphics[clip]{inc_curv.eps}}\end{figure}](/articles/aa/full/2003/20/aa3433/img31.gif) |
Figure 5: Variation of the growth rates with U0 for an incompressible fluid. The dot-dashed line represents the threshold found by Huerre & Monkewitz (1985). Note the excellent agreement found between the numerical and analytical approach. |
| Open with DEXTER | |
![\begin{figure}
\par\resizebox{\hsize}{!}{\includegraphics[clip]{cp_curv.eps}}\end{figure}](/articles/aa/full/2003/20/aa3433/img32.gif) |
Figure 6: Variation of the growth rates with U0 for a compressible fluid (dashed line) and for an incompressible fluid (solid line). |
| Open with DEXTER | |
| |
Figure 7:
Variation of the critical mean flow ( |
| Open with DEXTER | |
Figure 6 shows that compressibility decreases the value of the critical mean flow velocity from
![]() to
to
![]() .
This means that less mean flow is needed to sweep away the initial perturbation, which in turn also means that the growth rate of the perturbation is smaller due to compressibility. It is known that an increase in Mach number reduces the range of angles of propagation of unstable modes and at supersonic speeds parallel propagating modes are stable (see Landau 1944; Syrovatskii 1957; Baranov et al. 1992). Since the Mach number is very close to unity it could be expected that the growth rate be smaller and that would explain the result obtained from these numerical simulations. Note however, this effect is very small. The decrease is only
.
This means that less mean flow is needed to sweep away the initial perturbation, which in turn also means that the growth rate of the perturbation is smaller due to compressibility. It is known that an increase in Mach number reduces the range of angles of propagation of unstable modes and at supersonic speeds parallel propagating modes are stable (see Landau 1944; Syrovatskii 1957; Baranov et al. 1992). Since the Mach number is very close to unity it could be expected that the growth rate be smaller and that would explain the result obtained from these numerical simulations. Note however, this effect is very small. The decrease is only ![]() 2.5% for a sound speed that is an order of magnitude smaller. So it can be said that this threshold is almost constant in relation to the sound speed. The change of
2.5% for a sound speed that is an order of magnitude smaller. So it can be said that this threshold is almost constant in relation to the sound speed. The change of ![]() with Mach number is shown if Fig. 7, where a curve is fitted to the threshold values found in the numerical simulations for different values of
with Mach number is shown if Fig. 7, where a curve is fitted to the threshold values found in the numerical simulations for different values of ![]() ,
where the Mach number is defined as
,
where the Mach number is defined as
![]() ,
,
![]() being the sound speed. The behaviour of the curve in Fig. 6 remains the same and the value of
being the sound speed. The behaviour of the curve in Fig. 6 remains the same and the value of ![]() is equal to its counterpart with no mean flow.
is equal to its counterpart with no mean flow.
Results of the simulations for two distinct physical situations representing absolute and convective instabilities are shown in Figs. 8 and 9. Figure 8 also shows that the eddy-like perturbations are not as strong as in the incompressible case, which might be explained by the elasticity introduced by compressibility.
Finally let us move to study the absolute and convective instability of open shear flows when there is viscosity present. The Reynolds number used in the examples is 103 which is of orders of magnitude below the real Reynolds numbers of astrophysical problems. However at present in 2-D hydrodynamics even such simulations take a few days CPU time on the fastest available AMD Athlon processors. Since the focus here is on the effect that viscosity has on the threshold value of the critical mean flow, the Reynolds number does not need to be realistic as it will give the trend that is the objective of this study. Comparison between the inviscid incompressible and viscous compressible cases is shown in Fig. 12.
Results of simulation for cases of absolute and convective instabilities generated by the initial perturbation described above are shown in Figs. 10 and 11.
![\begin{figure}
\par\includegraphics[width=17cm,clip]{evol_cp.eps}\end{figure}](/articles/aa/full/2003/20/aa3433/img37.gif) |
Figure 8: Response of a compressible flow at various snapshots. Streamlines for two different behaviours: a) convectively unstable, e.g. U0=0.4, ( top row) and b) absolutely unstable, e.g. U0=0.0 ( bottom row). |
| Open with DEXTER | |
![\begin{figure}
\includegraphics[width=12cm,clip]{evol_cp2.eps}\end{figure}](/articles/aa/full/2003/20/aa3433/img38.gif) |
Figure 9: Response of a compressible flow to an initial perturbation. The vertical component of velocity vy for a convectively unstable (U0=0.4, left) and absolutely unstable (U0=0.0, right) shear flow. |
| Open with DEXTER | |
![\begin{figure}
\par\includegraphics[width=17.55cm,clip]{evol_vsc.eps}\end{figure}](/articles/aa/full/2003/20/aa3433/img39.gif) |
Figure 10: Response of a viscous flow at various snapshots with a Reynolds number Re=1000. Streamlines are plotted for a) convectively unstable (e.g. U0=0.4, top row) and b) absolutely unstable (e.g. U0=0.0 bottom row) shear flows, respectively. |
| Open with DEXTER | |
![\begin{figure}
\includegraphics[width=12cm,clip]{evol_vsc2.eps}\end{figure}](/articles/aa/full/2003/20/aa3433/img40.gif) |
Figure 11: Response of a viscous flow with a Reynolds number Re=1000 where the vertical component vy of the velocity is plotted for a) convectively unstable (e.g. U0=0.4, left) and b) absolutely unstable (e.g. U0=0.0, right) shear flows. |
| Open with DEXTER | |
The introduction of viscosity decreases even further the value of the critical
mean flow as it is clearly shown in Fig. 12. The case of the ideal compressible flows discussed in the previous section can actually be considered as a viscous fluid with an infinite Reynolds number. In that case it may be concluded that the critical mean flow needed decreases as the Reynolds number decreases. The trend of this decrease is shown in Fig. 13, where the values of the critical mean flow were found for different values of Reynolds numbers. Another two simulations were carried out for Reynolds numbers of 500 and 104, in order to interpolate a curve to give the wanted variation. The dotted line represents the value of ![]() for the inviscid case, which can be considered as an infinite Reynolds number.
for the inviscid case, which can be considered as an infinite Reynolds number.
![\begin{figure}
\par\resizebox{\hsize}{!}{\includegraphics[clip]{vsc_curv.eps}}\end{figure}](/articles/aa/full/2003/20/aa3433/img41.gif) |
Figure 12: Variation of the growth rates as a function of the mean flow U0 for a viscous compressible fluid with Reynolds number Re=103 (dashed line) and for an inviscid incompressible fluid (solid line). |
| Open with DEXTER | |
![\begin{figure}
\par\resizebox{\hsize}{!}{\includegraphics[clip]{revsuc.eps}}\end{figure}](/articles/aa/full/2003/20/aa3433/img42.gif) |
Figure 13:
Variation of the critical mean flow ( |
| Open with DEXTER | |
The variation of ![]() may be consistent with the reasonable interpretation that as the Reynolds number increases so does the importance of turbulence. Since structures observed in Figs. 10 and 8 are eddy-like configurations it is reasonable to expect that as the Reynolds number is increased the influence of these eddies becomes more prominent. For higher Reynolds numbers stronger flows would be needed to sweep away the initial perturbations and that is in agreement with the results found in the numerical simulations. Figure 10 shows exactly that the eddy-like structures are not so clear in this case. In Fig. 10 it can also be seen that in the convectively unstable configuration the shear layer is broadening with time. This is due to the diffusion introduced by viscosity and that is the reason why this broadening does not appear in the other two cases with no viscosity (i.e. in the cases of inviscid incompressible and compressible limits). This may also lead to the conclusion that the numerical diffusion in the present simulations is indeed very small and does not really influence the outcome.
may be consistent with the reasonable interpretation that as the Reynolds number increases so does the importance of turbulence. Since structures observed in Figs. 10 and 8 are eddy-like configurations it is reasonable to expect that as the Reynolds number is increased the influence of these eddies becomes more prominent. For higher Reynolds numbers stronger flows would be needed to sweep away the initial perturbations and that is in agreement with the results found in the numerical simulations. Figure 10 shows exactly that the eddy-like structures are not so clear in this case. In Fig. 10 it can also be seen that in the convectively unstable configuration the shear layer is broadening with time. This is due to the diffusion introduced by viscosity and that is the reason why this broadening does not appear in the other two cases with no viscosity (i.e. in the cases of inviscid incompressible and compressible limits). This may also lead to the conclusion that the numerical diffusion in the present simulations is indeed very small and does not really influence the outcome.
Table 1 summarises the results found for an open shear layer in the three different cases studied.
The "worst case scenario'' found, meaning the case that requires the strongest flow to become convectively unstable, was the case of an incompressible inviscid fluid.
Table 1: This table shows the critical flow value for which below this value the flow is absolutely unstable and above this value it is convectively unstable, in the three cases studied in the previous sections.
The effects of compressibility and viscosity are similar. Both have a stabilising effect on the shear flow configuration resulting in a lower value of ![]() .
In these two cases the perturbation does not grow as fast as in the case of an incompressible limit resulting in that a smaller mean flow can sweep away the perturbation and leave the flow unperturbed. Viscosity also has a dissipating effect in the flow. When a perturbation is growing, viscosity may dissipate the energy of this perturbation and causes the growth rate of the perturbation to decrease. This mechanism may explain the result obtained in the numerical simulation and clearly represented in Fig. 12. Compressibility introduces elasticity and behaves in a similar manner as diffusion in the viscous case. However, in this latter case the effect is much smaller. All of these findings relate to the eddy-like structures developed during the simulations. We found, as these eddy structures became less evident so did the threshold value decrease indicating that the two mechanisms, i.e. the eddies and the nature of the instability could be related.
.
In these two cases the perturbation does not grow as fast as in the case of an incompressible limit resulting in that a smaller mean flow can sweep away the perturbation and leave the flow unperturbed. Viscosity also has a dissipating effect in the flow. When a perturbation is growing, viscosity may dissipate the energy of this perturbation and causes the growth rate of the perturbation to decrease. This mechanism may explain the result obtained in the numerical simulation and clearly represented in Fig. 12. Compressibility introduces elasticity and behaves in a similar manner as diffusion in the viscous case. However, in this latter case the effect is much smaller. All of these findings relate to the eddy-like structures developed during the simulations. We found, as these eddy structures became less evident so did the threshold value decrease indicating that the two mechanisms, i.e. the eddies and the nature of the instability could be related.
For astrophysical problems the Reynolds numbers used are normally very large,
![]() .
Since at those high Reynolds numbers the value of
.
Since at those high Reynolds numbers the value of ![]() is very close to the inviscid limit, as shown in Fig. 13, it is reasonable to assume inviscid case for the study of absolute and convective instabilities. Also, the effect of compressibility is very small so that the results for the incompressible limit can be used as a very good estimate, generally a difference of only 2.5% as shown if Fig. 7. From this it can be concluded that the case of an incompressible inviscid fluid, used for simplicity in analytical studies, is relevant to astrophysical problems and will give very approximate results in the study of absolute and convective instabilities.
is very close to the inviscid limit, as shown in Fig. 13, it is reasonable to assume inviscid case for the study of absolute and convective instabilities. Also, the effect of compressibility is very small so that the results for the incompressible limit can be used as a very good estimate, generally a difference of only 2.5% as shown if Fig. 7. From this it can be concluded that the case of an incompressible inviscid fluid, used for simplicity in analytical studies, is relevant to astrophysical problems and will give very approximate results in the study of absolute and convective instabilities.
We currently work on the inclusion of magnetic fields to study the absolute and convective instabilities of open shear flows in magnetohydrodynamics (MHD). This will allow us to carry out more rigorous astrophysical applications as MHD is widely used in space, solar, magnetospheric and geophysical plasmas.
Acknowledgements
MTH thanks FCT, Portugal, for its financial support (Ref. No. SFRH/BD/8076/2002). RE acknowledges M. Kéray for patient encouragement and is grateful to NSF Hungary, (OTKA, Ref. No. TO32462). We also acknowledge Drs M.S Ruderman for the many useful discussions and comments and G. Tóth the principal author of VAC.