A&A 403, 187-203 (2003)
DOI: 10.1051/0004-6361:20030305
An XMM-Newton-based X-ray survey of pre-main sequence stellar
emission in the L1551 star-forming complex
F. Favata1 - G. Giardino 1 - G.
Micela2 - S. Sciortino2 - F. Damiani2
1 - Astrophysics Division - Research and Science Support Department of ESA, ESTEC,
Postbus 299, 2200 AG Noordwijk, The Netherlands
2 -
INAF - Osservatorio Astronomico di Palermo, Piazza del Parlamento 1,
90134 Palermo, Italy
Received 11 November 2002 / Accepted 21 February 2003
Abstract
We present a study of the X-ray sources present in the
nearby L1551 star forming region, based on a deep XMM-Newton observation
complemented with Chandra data for the brightest sources.
Most known pre-main sequence stars in the region have been
detected, most of them with sufficient statistics to allow a
detailed study of the temporal and spectral characteristics of their
X-ray emission. Significant temporal (and spectral) variability on
both short and long time scales is visible for most of the stars. In
particular XZ Tau shows large-amplitude variations on time scales of
several hours with large changes in the intervening absorption,
suggestive of the X-ray emission being eclipsed by the accretion
stream (and thus of the X-ray emission being partly or totally
accretion-induced). The coronal metal abundance of the WTTS sources
is clustered around
 ,
while the CTTS sources span
almost two orders of magnitudes in coronal Z, even though the
photospheric abundance of all stars in the L1551 is likely to be
very similar. Some individual elements (notably Ne) appear to be
systematically enhanced with respect to Fe in the WTTS stars. The
significant differences between the spectral and temporal
characteristics of the CTTS and WTTS populations suggest that a
different emission mechanism is (at least partly) responsible for
the X-ray emission of the two types of stars.
,
while the CTTS sources span
almost two orders of magnitudes in coronal Z, even though the
photospheric abundance of all stars in the L1551 is likely to be
very similar. Some individual elements (notably Ne) appear to be
systematically enhanced with respect to Fe in the WTTS stars. The
significant differences between the spectral and temporal
characteristics of the CTTS and WTTS populations suggest that a
different emission mechanism is (at least partly) responsible for
the X-ray emission of the two types of stars.
Key words: ISM: individual objects: L1551 - stars: formation - stars: pre-main
sequence - X-rays: stars
1 Introduction
The usefulness of X-ray observations for studying star formation from
the earlier stages is by now well established. Given that X-ray
emission evolves strongly with age, young stars are very active X-ray
sources, and X-ray surveys of young associations and clusters very
effectively supplement other, more traditional approaches to
membership determination in these regions (see e.g. Feigelson & Montmerle 1999
for an extensive review of recent results in the field). For already
formed, very young stars, the details of the X-ray emission mechanisms
are still unclear; for the Weak-Line T Tauri (WTTS) stars, for which
the disk does not any longer play a prominent role, the X-ray emitting
corona is likely to be similar to the one in other, older, active
stars. In the Classic T Tauri stars (CTTS) signatures of relatively
massive disks are visible in the optical, UV and IR, and accretion
processes often have clearly visible observational signatures.
Whether accretion has a role in determining the X-ray luminosity
(either enhancing or inhibiting it) is still a debated question. Some
studies find no difference in X-ray properties of CTTSs and WTTSs
(e.g. Feigelson et al. 2002), while other authors report significant
differences between the two, with CTTSs being under-luminous in X-rays
with respect to WTTSs (Flaccomio et al. 2003). Also, claims have been made
that a significant fraction of the X-ray luminosity of some CTTSs is
indeed due to accretion (Kastner et al. 2002), and the X-ray emission
of CTTSs appears to be more time-variable with respect to WTTSs
(Flaccomio et al. 2000).
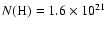
The nearby L1551 star-forming cloud, at a distance
 pc
(Kenyon et al. 1994), is a well studied site of star formation, and its
population has been extensively characterized. Low-mass recently
formed stars have been searched in the cloud through their H
pc
(Kenyon et al. 1994), is a well studied site of star formation, and its
population has been extensively characterized. Low-mass recently
formed stars have been searched in the cloud through their H emission (Jones & Herbig 1979; Feigelson & Kriss 1983; Briceño et al. 1993), through
their proper motion (Jones & Herbig 1979; Gomez et al. 1992), and through
their X-ray emission (Feigelson & Decampli 1981; Feigelson et al. 1987;
Carkner et al. 1996). Most of the phenomenology of low-mass star
formation is present in the cloud, including highly embedded sources
(such as IRS5), CTTSs, WTTSs, and proto-stellar outflows (Herbig Haro
objects).
emission (Jones & Herbig 1979; Feigelson & Kriss 1983; Briceño et al. 1993), through
their proper motion (Jones & Herbig 1979; Gomez et al. 1992), and through
their X-ray emission (Feigelson & Decampli 1981; Feigelson et al. 1987;
Carkner et al. 1996). Most of the phenomenology of low-mass star
formation is present in the cloud, including highly embedded sources
(such as IRS5), CTTSs, WTTSs, and proto-stellar outflows (Herbig Haro
objects).
In this paper we present a deep (nominal 50 ks) XMM-Newton observation of
the L1551 star-forming complex. For the X-ray bright sources we have
also analyzed the Chandra ACIS observation of the same region
obtained from the public archive, limiting ourselves to the temporal
and spectral analysis of these few sources. An initial study of all
the Chandra sources in the region is presented by
Bally et al. (2003). The XMM-Newton observation presented here has been also
discussed by Favata et al. (2002), who did focus onto the X-ray emission
from the Herbig-Haro object HH 154.
The present paper is organized as follow. In Sect. 2 the
XMM-Newton and Chandra observations are presented, with their
analysis; in Sect. 3 we briefly discuss the results for
the X-ray sources which are not known to be pre-main sequence stars,
while in Sect. 4 the results for each known pre-main
sequence star are presented. These results are discussed in
Sect. 5.
2 Observations
The XMM-Newton observation discussed in this paper consists in a deep (50 ks nominal) exposure of the L1551 star-forming cloud, obtained
starting on Sep. 9 2000 at 19:10 UTC. All three EPIC cameras were
active at the time of the observation, in full-frame mode with the
medium filters.
Data have been processed by us with the standard SAS V5.3.1 pipeline
system, concentrating, for the spectral and timing analysis, on the
EPIC-pn camera. As most of the background in XMM-Newton observations is
concentrated in individual, relatively short-lasting proton flares, we
have retained only time intervals in which the count rate for the
whole frame of photons above 8 keV was below a certain threshold (0.5 cts/s in the present case). This effectively reduces the background by
a factor of  4 while omitting only 5% of the
observing time. The effective duration of the observation was 56.8 ks for the MOS cameras and 54.5 ks for the pn camera,
which were reduced to 55 ks and 51 ks respectively after
filtering out the high background intervals. In order to minimize the
unwanted contribution of non-X-ray events we have retained for
analysis only the X-ray photons whose energy is in the 0.3-7.9 keV
range. The details of this process are described in a previous paper
(Favata et al. 2002) and will not be repeated here.
4 while omitting only 5% of the
observing time. The effective duration of the observation was 56.8 ks for the MOS cameras and 54.5 ks for the pn camera,
which were reduced to 55 ks and 51 ks respectively after
filtering out the high background intervals. In order to minimize the
unwanted contribution of non-X-ray events we have retained for
analysis only the X-ray photons whose energy is in the 0.3-7.9 keV
range. The details of this process are described in a previous paper
(Favata et al. 2002) and will not be repeated here.
Source detection (again as described in detail in Favata et al. 2002)
was performed on the summed data set obtained with the two MOS and one
pn EPIC cameras, using the Wavelet Transform detection algorithm
developed at Palermo Astronomical Observatory (PWDETECT,
Damiani et al. 2003, in preparation). The L1551 observation has been
taken with the medium filters; in such a case we have derived that the
value of the relative efficiency of the pn and of the individual MOS
cameras is 2.94, hence the summed data set has a single MOS-equivalent
cleaned exposure time of
 ks. The
threshold for source detection has been taken as to ensure a maximum
of one spurious source per field.
ks. The
threshold for source detection has been taken as to ensure a maximum
of one spurious source per field.
For the 27 sources with sufficient S/N (more than 50 counts)
spectral and timing analysis was performed on the EPIC pn data. Source
and background photons were extracted using a set of scripts
purposely developed at Palermo Observatory. Source and background
regions were defined interactively in the DS9 display
software, with the background extracted from regions on the same CCD
chip and at the same off-axis angle as for the source region.
Response matrices ("RMF and ARF files'')
appropriate for the position and size of the source extraction regions
were computed. The spectral analysis has been performed using the
XSPEC package, after rebinning the source spectra to a minimum of 20
source counts per (variable width) spectral bin.
A total of 81 X-ray sources were detected using PWDETECT. For
each source we report the source position, the count rate for the
combined cameras pn+MOS1+MOS2, and the presence of a possible
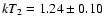
counterpart in the USNO catalog and in SIMBAD![[*]](/icons/foot_motif.gif) . The merged EPIC pn+MOS1+MOS2 image is
shown in Fig. 1. In Table 1 also the
distance between the X-ray source position and the position of the
corresponding (if any) object in the USNO catalog or in
SIMBAD is given, together with the R magnitude and B - R color from the USNO catalog. The "Id'' column provides the name of
the potential counterpart found in the SIMBAD catalog by
searching within a radius of 15 arcsec from the X-ray source position.
. The merged EPIC pn+MOS1+MOS2 image is
shown in Fig. 1. In Table 1 also the
distance between the X-ray source position and the position of the
corresponding (if any) object in the USNO catalog or in
SIMBAD is given, together with the R magnitude and B - R color from the USNO catalog. The "Id'' column provides the name of
the potential counterpart found in the SIMBAD catalog by
searching within a radius of 15 arcsec from the X-ray source position.
Among the 81 sources detected within the combined data set (pn, MOS1,
MOS2), 27 have enough counts in the pn camera for their spectra to be
analyzed. The X-ray image is shown in Fig. 1. The
characteristics of the X-ray bright sources are listed in
Table 2, the last column in Table 1 giving
the number of the corresponding source in Table 2.
![\begin{figure}
\par\includegraphics[height=8.2cm,width=18cm,clip]{xrayoptimg.ps} \end{figure}](/articles/aa/full/2003/19/aah4098/Timg10.gif) |
Figure 1:
Left panel: merged EPIC pn+MOS1+MOS2 image of the L1551
region. Right panel: the same region (to scale) in the red Palomar
plates (from the Digital Sky Survey). The bright nebulosity near
the center of the optical image is the outflow from the IRS5
embedded protostar. |
All X-ray sources with a known counterpart have been detected with
enough photons to allow for their pn spectrum to be studied, with the
exception of sources 12, 28, 73, 77 and 80. Sources 77 and 80 fall
outside the field of view of the pn camera (and their faintness and
large offset angle prevent their MOS spectrum to be usefully
analyzed), while sources 12 and 73 are too weak for a reliable
spectrum to be extracted from the pn camera. In addition, source 28
lies in a region of high background due to its proximity to source 29
(the bright T Tau star HL Tau). Of these 5 sources, source 28
(CoKu Tau 2, or LkH 358) is a known late-type pre-main sequence
star (Bertout 1989), while source 77 ([CFK96] RX29) has been
detected in X-rays by Carkner et al. (1996), who report that the star has no
H
emission or Li I
 absorption (although
the S/N of their spectra is low). However, it falls among the T Tau
stars in the X-ray/optical brightness diagram and has proper motion
not inconsistent with the cloud, so that they classify it as possible
newly detected T Tauri in the star-forming complex.
absorption (although
the S/N of their spectra is low). However, it falls among the T Tau
stars in the X-ray/optical brightness diagram and has proper motion
not inconsistent with the cloud, so that they classify it as possible
newly detected T Tauri in the star-forming complex.
Table 2 gives the background-corrected count rate in the
0.3-7.9 keV band for the pn camera and, for the sources previously
detected with ROSAT, the table provides ROSAT PSPC count rates as
derived from the study by Carkner et al. (1996). The name of the optical
counterpart is also given.
2.2 Chandra data
The Chandra ACIS observation of the L1551 cloud was taken
starting on July 23 2001, with a nominal exposure time of 80 ks. The
data were retrieved from the public data archive, with no
re-processing done on the archival data. Source and background regions
for the four bright X-ray sources discussed here (XZ Tau, HL Tau, HD
285845 and JH 188) were defined in DS9, and light curves and
spectra were extracted from the cleaned photon list using CIAO
V. 2.2.1 threads, which were also used for the generation of the
relative response matrices. Spectral analysis was performed in
XSPEC in the same way as for the XMM-Newton spectra.
The Chandra observation is discussed in detail by
Bally et al. (2003), who list all the sources detected within the
Chandra field. All bright X-ray sources listed in
Table 2 are also present in the list of Chandra
sources, except for the ones which fall outside the Chandra
field of view.
The results of the spectral analysis of the Chandra spectra
performed here consistently result in very high absorbing column
density, significantly higher than the one derived from the XMM-Newton
EPIC-pn data (which, for the foreground sources, is in fair agreement
with the interstellar column density expected on the basis of the
source's distance). This is consistent with the known presence of
(likely carbon-based) contamination on the ACIS chips, causing
additional low-energy absorption (up to 50% near the C edge) not
accounted for in the current response matrices (Plucinsky et al. 2003).
Therefore the
 values derived from the Chandra spectra
are known to be consistently overestimated and will not be discussed
further in this work.
values derived from the Chandra spectra
are known to be consistently overestimated and will not be discussed
further in this work.
3 Spectral and timing analysis of sources
unrelated to the L1551 cloud
Of the 27 X-ray bright sources detected in the XMM-Newton observation, 17
have a cataloged optical or radio counterpart. Of these, 9 are
previously known pre-main sequence (PMS) stars and will be discussed
in detail in the Sect. 4, while the remaining 8 without
a previously known PMS counterpart are discussed here together with
the bright X-ray sources without any visible counterpart. The best-fit
parameters for the spectral analysis of all the sources are reported
in Table 3.
Source S1 This faint X-ray source has a clearly visible optical
counterpart in the Palomar plates (which appears in the USNO-A2.0
catalog with number 1050-01299961) at a distance of 1.8 arcsec from
the X-ray source centroid. Its X-ray spectrum cannot be satisfactorily
fit with a power-law, while it is well described (P = 0.45, where
P is the null hypothesis probability of the fit) by an absorbed
thermal spectrum with
 and
and  keV. Using the USNO B and R magnitudes
(respectively 16.2 and 14.5) and the best fit value of
the
intrinsic B-R index of the source was derived. For
keV. Using the USNO B and R magnitudes
(respectively 16.2 and 14.5) and the best fit value of
the
intrinsic B-R index of the source was derived. For
 ,
the intrinsic B-R implies a main sequence star hotter than
a F8, shining through the L1551 cloud, at a distance greater than
,
the intrinsic B-R implies a main sequence star hotter than
a F8, shining through the L1551 cloud, at a distance greater than
 900 pc.
Source S10 This faint X-ray source does not have a cataloged
counterpart in SIMBAD or the USNO A2.0 catalog.
Nevertheless it appears to have a very faint counterpart in the
digitized red Palomar plate, which Bally et al. (2003) identify as a star.
The XMM-Newton spectrum is very hard and cannot be fit with an absorbed
thermal emission model, but, as shown in Table 3, it is
well described by an absorbed power law with a spectral index
 ,
pointing to the likelihood of the source being of
extra-galactic origin (AGN or the like).
,
pointing to the likelihood of the source being of
extra-galactic origin (AGN or the like).
Source S12 This faint X-ray source lies at 5 arcsec
from [SB86] L1551 3, a radio source detected by Snell & Bally (1986) in
their study of compact radio sources associated with molecular
outflows. [SB86] L1551 3 has no IR counterpart and no radio
spectral information is available, so that the authors exclude it from
the list of likely radio-emitting stellar sources embedded within the
molecular cloud. Giovanardi et al. (2000) have also made radio observations
of this field; beside L1551 IRS 5, they detect 25 other radio
sources including [SB86] L1551 3. From extra-galactic source counts,
they conclude that most of these radio sources are likely to be of
extra-galactic origin. The X-ray spectrum can in principle be fit
with a thermal spectrum, with a very high best fit temperature (kT =
44 keV), but it is also well described by an absorbed power-law
spectrum with spectral index
 (see
Table 3). This, together with the absence of an optical
counterpart in the Palomar plate indicates that this source is most
likely extra-galactic.
(see
Table 3). This, together with the absence of an optical
counterpart in the Palomar plate indicates that this source is most
likely extra-galactic.
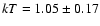
Source S13 This faint X-ray source lies within 1.3 arcsec
from the GSC star 01269-00641, which corresponds to star
[FK83] LDN 1551 9 in Feigelson & Kriss (1983). They classify it as K6 and
exclude it from their list of potential pre-main sequence stars since
it does not show H
emission (EW(H)
 Å). This
however would not rule it out as a WTTS, which may not show H
emission. By using the values provided by Feigelson & Kriss (1983) for the
magnitude, V=13.5, and absorption,
Å). This
however would not rule it out as a WTTS, which may not show H
emission. By using the values provided by Feigelson & Kriss (1983) for the
magnitude, V=13.5, and absorption,
 ,
we derive for
this star a photometric parallax of 120 pc, which is not
inconsistent with the star being part of the L1551 star-forming
complex. The X-ray spectrum of the star is well described (P=0.89)
by an absorbed one temperature spectrum with
,
we derive for
this star a photometric parallax of 120 pc, which is not
inconsistent with the star being part of the L1551 star-forming
complex. The X-ray spectrum of the star is well described (P=0.89)
by an absorbed one temperature spectrum with
 cm-2 and
 (with a fixed relative
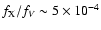
metal abundance at Z=0.3). The flux
of the star in the 0.35-7.5 keV band is 7.09
(with a fixed relative
metal abundance at Z=0.3). The flux
of the star in the 0.35-7.5 keV band is 7.09
 erg cm-2 s-1.
Since the absorbing column density is low, this value can be used
directly with V to derive a ratio of X-ray flux over optical flux of
erg cm-2 s-1.
Since the absorbing column density is low, this value can be used
directly with V to derive a ratio of X-ray flux over optical flux of
 ,
typical of a relatively
high-activity coronal source, not inconsistent with its being a
pre-main sequence star. Further optical observations are needed in
order to establish the nature of this star and its location with
respect to the cloud.
,
typical of a relatively
high-activity coronal source, not inconsistent with its being a
pre-main sequence star. Further optical observations are needed in
order to establish the nature of this star and its location with
respect to the cloud.
Source S16 This faint X-ray source lies at 1.5 arcsec
from [SB86] L1551 2b, a component of the radio source
[SB86] L1551 2 detected by Snell & Bally (1986). [SB86] L1551 2 has a
non-thermal radio spectrum (
 )
and no IR counterpart
therefore the authors classifies it as probable extra-galactic object.
The source does not have an optical counterpart in the Palomar plates,
and its X-ray spectrum is well described by an absorbed power law
model with a spectral index
)
and no IR counterpart
therefore the authors classifies it as probable extra-galactic object.
The source does not have an optical counterpart in the Palomar plates,
and its X-ray spectrum is well described by an absorbed power law
model with a spectral index

 0.7, while it cannot be
satisfactorily fit by a thermal model, so that the source is most
likely extra-galactic.
0.7, while it cannot be
satisfactorily fit by a thermal model, so that the source is most
likely extra-galactic.
Source S20 This is the X-ray source associated with
HH 154, the proto-stellar jet emanating from the L1551 IRS5 protostar,
discussed in detail by Favata et al. (2002).
Source S22 This bright X-ray source is identified with the
the binary system HD 285845 which lies at 2.4 arcsec from the X-ray
source. The star, also known as V1073 Tau, is excluded from cloud
membership by its radial velocity and proper motion by Walter et al. (1988).
According to the same study the primary star of the system does not
appear to be a PMS since it does not show detectable Li
I
.
The spectral type is G8, with color indices
U-B=0.23 and B-V=0.77, consistent with the ones of a main sequence
star, and a projected rotational velocity of
 km s-1(Walter et al. 1988). Schneider et al. (1998) report, using HST FGS observations,
a separation for the binary companion of 73 mas and a magnitude
difference among the components of 1.19 mag. The apparent magnitude
V=10.28 implies a photometric parallax of 90 pc, indicating that
HD 285845 likely is an active binary system in the foreground of
L1551. Its mean intrinsic X-ray luminosity in the XMM-Newton observation
(at the assumed distance of 90 pc) is
km s-1(Walter et al. 1988). Schneider et al. (1998) report, using HST FGS observations,
a separation for the binary companion of 73 mas and a magnitude
difference among the components of 1.19 mag. The apparent magnitude
V=10.28 implies a photometric parallax of 90 pc, indicating that
HD 285845 likely is an active binary system in the foreground of
L1551. Its mean intrinsic X-ray luminosity in the XMM-Newton observation
(at the assumed distance of 90 pc) is
 erg s-1, typical of active binary stars.
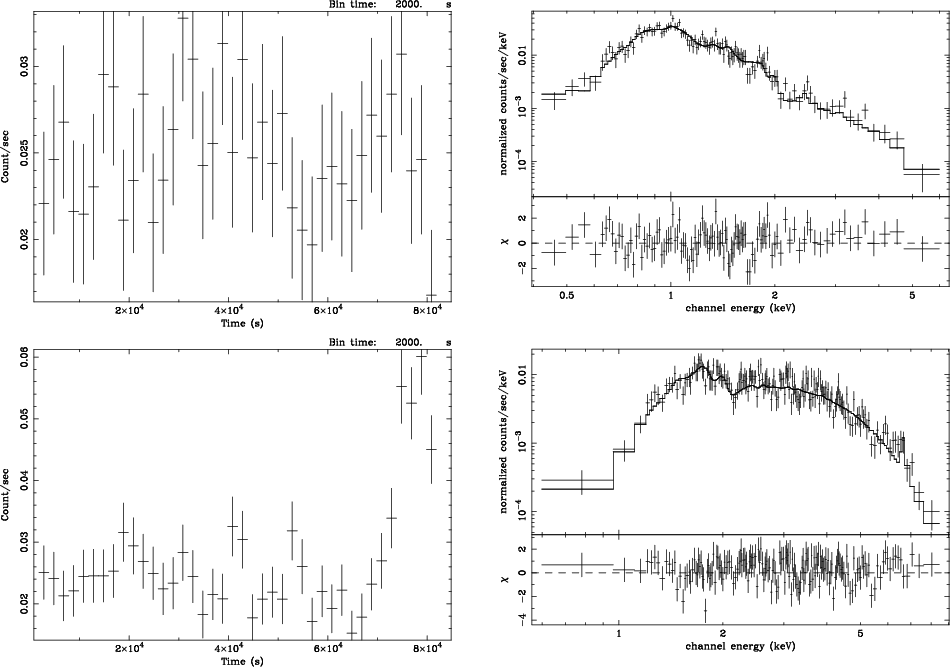
![\begin{figure}
\par\includegraphics[angle=270,width=8cm,clip]{src22_HD285845_lc....
...ace*{8mm}
\includegraphics[angle=270,width=8cm,clip]{hd282tvxpec.ps}\end{figure}](/articles/aa/full/2003/19/aah4098/Timg35.gif) |
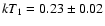
Figure 2:
Top: X-ray light curve of HD 285845 during the XMM-Newton and
Chandra observations. Bottom: XMM-Newton and Chandra
X-ray spectra of HD 285845. The fits to the spectra with
absorbed 2-temperature plasma models with varying metal
abundances are also shown. |
HD 285845 shows remarkable X-ray variability during the XMM-Newton
observation, with its flux decreasing by a factor 2 in less
than 30 ks (Fig. 2), in what could be interpreted
as the decay of a long-lasting flare. However, the light curve is far
from being a simple exponential decay, with very significant
shorter-term variability superimposed over a longer-term decaying
trend. The good statistics of the source allows the
variability to be studied in detail.
The X-ray spectrum cannot be satisfactorily fit with a "classic'' 2
temperature plasma model (
 ). The presence of large fit
residuals at energies where metal lines are expected suggests that a 2
temperature plasma model with varying metal abundances may provide a
better description of the spectrum of HD 285845. This is indeed the
case; as shown in Fig. 2 a model with individually
varying metal abundances provide a good fit to the source spectrum
(P=0.31), with comparable emission measure for the two temperature
components. The best-fit values of the model parameters are summarized in
Table 8 and indicate a significant over-abundance of
Ne and Ca. The best-fit value for
is low and therefore consistent
with the source being in front of the L1551 cloud.
). The presence of large fit
residuals at energies where metal lines are expected suggests that a 2
temperature plasma model with varying metal abundances may provide a
better description of the spectrum of HD 285845. This is indeed the
case; as shown in Fig. 2 a model with individually
varying metal abundances provide a good fit to the source spectrum
(P=0.31), with comparable emission measure for the two temperature
components. The best-fit values of the model parameters are summarized in
Table 8 and indicate a significant over-abundance of
Ne and Ca. The best-fit value for
is low and therefore consistent
with the source being in front of the L1551 cloud.
As shown in Fig. 2, the light curve of HD 285845
during the Chandra observation also shows significant
variability on typical time scales comparable to the ones apparent in
the XMM-Newton data. The Chandra spectrum also requires individually
varying metal abundances to be fit, with best-fit metal abundances
very similar to the ones derived from the XMM-Newton data, with the only
exception of Ca, for which the ACIS data imply an upper limit of 1, in
contrast with the high value (as evident by the strong Ca line visible
in the spectrum) derived from the XMM-Newton spectrum. An other
discrepancy present between the XMM-Newton and Chandra spectra is
the absorbing column density, in agreement with the consistently too
high
values derived on ACIS spectra (see
Sect. 2.2).
Source S26 This X-ray source lies at 2.1 arcsec
from the star JH 188, which appears in the Jones & Herbig (1979) proper motion
catalog of T Tau variables and other stars associated with the
Taurus-Auriga dark clouds. The star is characterized by a large proper
motion, significantly different from the cloud members' typical
motion. No other references to JH 188 are present in SIMBAD.
Nevertheless this bright X-ray source appears to be source 13 observed
with ROSAT by Carkner et al. (1996), which they identify with LP 415-1165, a
M2 star in the Luyten proper motion catalog of 1971, which presumably
is a foreground dwarf unrelated to the cloud again because of its
large motion (Cudworth & Herbig 1979). We conclude that JH 188 and LP 415-1165
are most likely the same star.
The X-ray emission of source S26 does not show significant variability
during our observations, and its X-ray spectrum is well described
(P=0.93) by a 2 temperature plasma model, with
 keV,
keV,
 keV (with comparable emission
measure),
keV (with comparable emission
measure),
 and
and
 cm-2. The low value for the hydrogen column density is
consistent with the star being in front of the cloud.
cm-2. The low value for the hydrogen column density is
consistent with the star being in front of the cloud.
In summary, of the 8 X-ray sources with a radio or optical counterpart
which are not previously known pre-main sequence stars, 4 are stars, 3
of which unrelated to the L1551 cloud, while one (source S13) could be
a pre-main sequence star belonging to the cloud and deserves further
investigation. The other 3 are likely to be extra-galactic background
sources and one is related to the proto-stellar jet HH 154.
We have analyzed the spectra of the remaining 10 X-ray bright sources
with no optical or radio counterpart. Each of them is satisfactorily
fit by an absorbed power law spectrum (although in many cases, as
reported in Table 3, a thermal fit also provides an
acceptable description to the spectrum), with best fit values
summarized in Table 3. This, together to the absence of
an optical counterpart in the USNO catalog indicates that these
sources are most likely of extra-galactic origin.
Together with the 3 sources with optical or radio counterpart, 13 of
the bright sources are thus likely to be extra-galactic. The presence
of 13 extra-galactic serendipitous X-ray sources in the XMM-Newton field of
view at a flux level of the order to 10-14 erg cm-2 s-1 is in rough
agreement with the expected number density of background sources
determined on the basis of the
 relationship for X-ray
sources (see e.g. Hasinger et al. 2001), which predicts that at this
flux limit 100-200 sources per square degree should be present in any
given X-ray observation. The area covered by XMM-Newton field of view is
approximately of 0.2 square deg, so that the expected number of
serendipitous extra-galactic sources for a low absorption field is 20
to 40.
relationship for X-ray
sources (see e.g. Hasinger et al. 2001), which predicts that at this
flux limit 100-200 sources per square degree should be present in any
given X-ray observation. The area covered by XMM-Newton field of view is
approximately of 0.2 square deg, so that the expected number of
serendipitous extra-galactic sources for a low absorption field is 20
to 40.
4 X-ray sources associated with pre-main sequence stars in L1551
In this section we summarize our results on the previously known
pre-main sequence stars that have been detected in the XMM-Newton
observations of the L1551 star-forming complex. The EPIC-pn spectra of
all these sources have been fit with absorbed two-temperature models;
the fits are shown together with the spectra in Fig. 3.
The best-fit model parameters are listed in Table 7. For
the sources with enough statistics (and which showed visible
systematic deviations in the fit residuals) spectral fits with
two-temperature plasma models with varying individual metal abundance
were performed. The procedure followed was to first fit the data with
a variable Z model, and then allow individual elements to vary
individually, in order of atomic weight. If the best fit abundance for
the given element was more than 1  away from the one of Fe the
element would be left free to vary, else it would be coupled back to
Fe (which was always allowed to vary). The results of these fits are
summarized in Table 8.
away from the one of Fe the
element would be left free to vary, else it would be coupled back to
Fe (which was always allowed to vary). The results of these fits are
summarized in Table 8.
 |
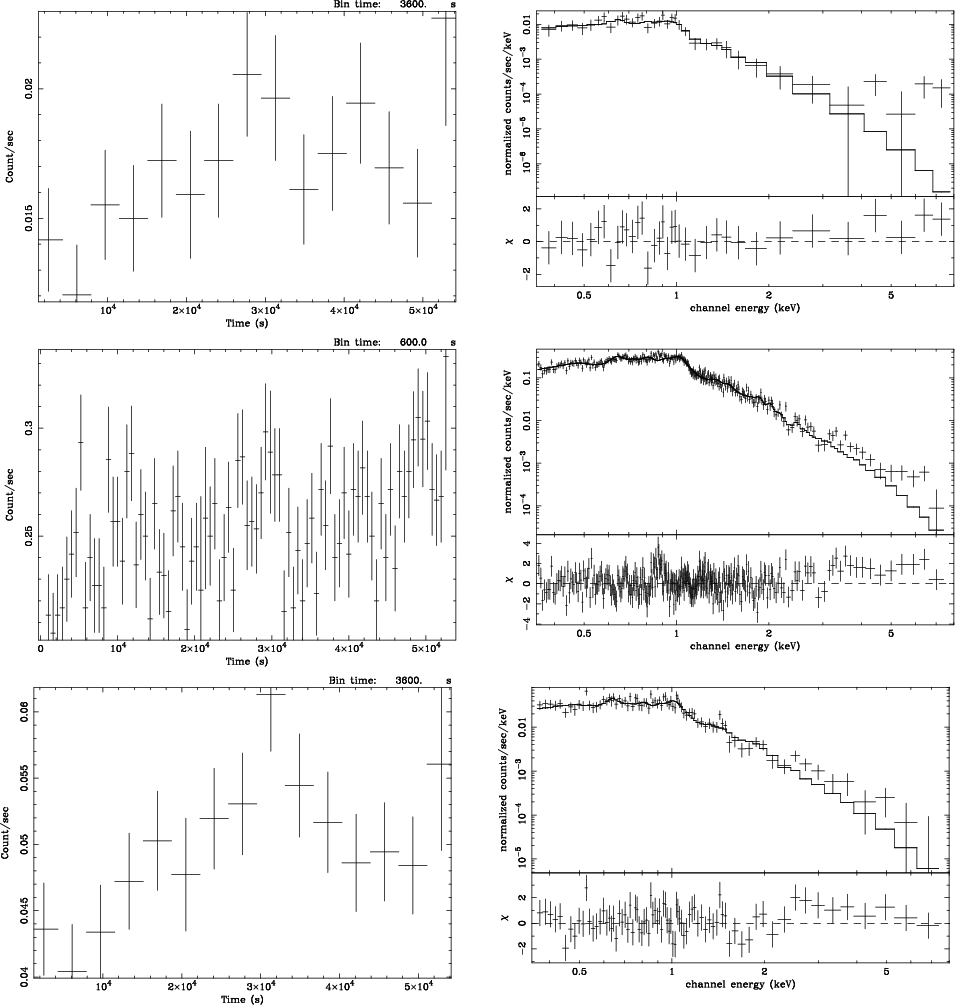
Figure 3:
EPIC-pn light curves and spectra for the pre-main sequence
stars detected in the XMM-Newton observations of the star-forming
complex L1551. Best fit 2-T spectra are also plotted with the
spectra. From top to bottom: [BHS98] MHO 5, V826 Tau, V827 Tau. |
 |
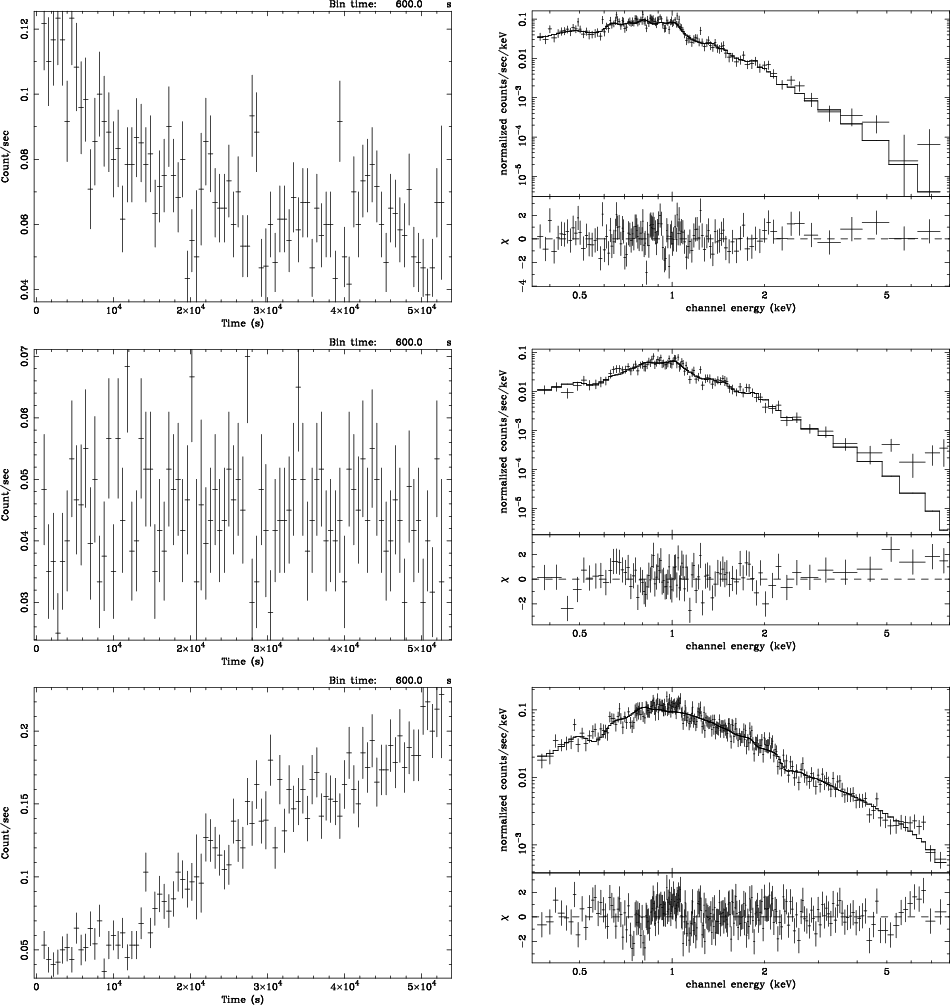
Figure 3:
continued. From top to bottom: V1075 Tau, V710 Tau, XZ Tau. |
 |
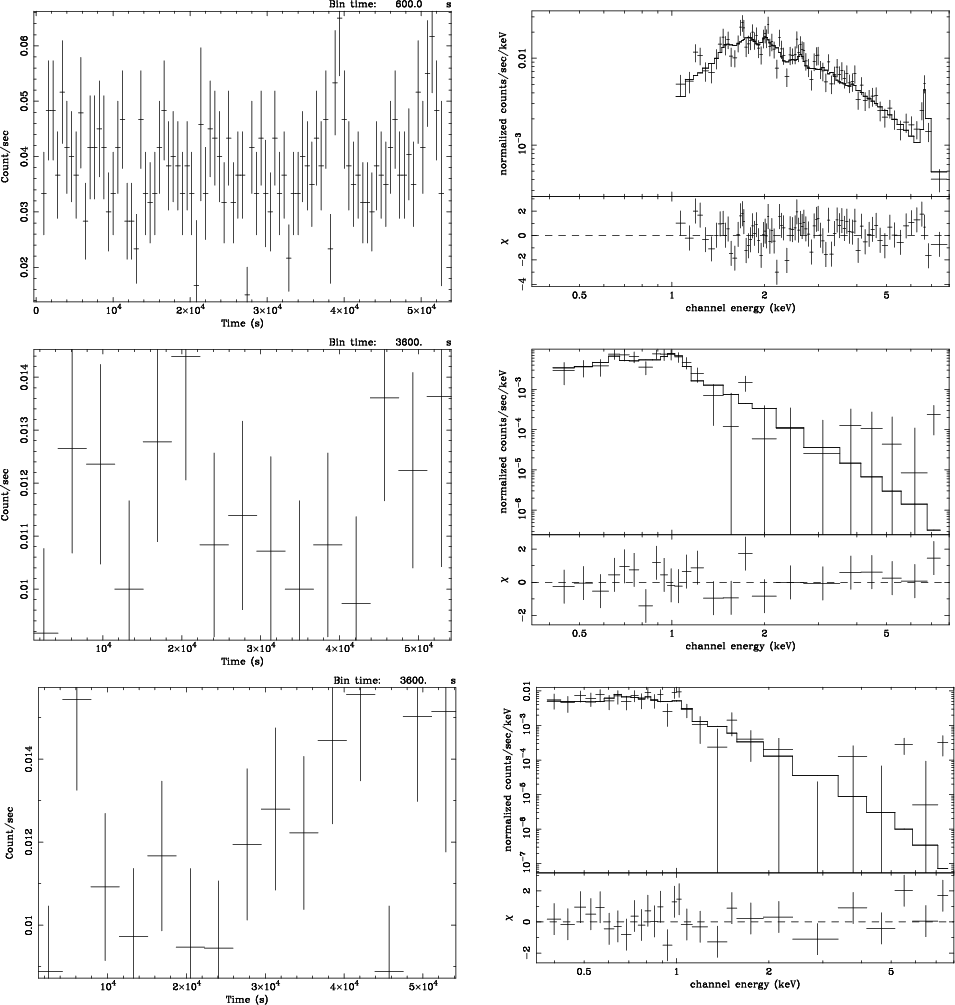
Figure 3:
continued. From top to bottom: HL Tau, [BHS98] MHO 4, [BHS98] MHO 9. |
The light curves of the PMS X-ray sources are shown in
Fig. 3. In order to evaluate the presence of X-ray
variability, the Kolmogorov-Smirnov (K-S) test, which measures the
maximum deviation of the integral photon arrival times from a constant
source model, was applied. Table 9 summarizes the
results of these statistical tests, providing also the source average
flux during the XMM-Newton observations and the ROSAT and ASCA
observations, as given by Carkner et al. (1996). The ROSAT and ASCA
observations were spaced by 1 year. Below we discuss each star
individually.
This late type star (M6) star is identified here with source S2, with
a 1.4 arcsec offset between the optical and X-ray position.
[BHS98] MHO 5 is identified as a member of the L1551 star-forming
complex on the basis of the strong Li I
feature
in the optical spectrum (Briceño et al. 1998). The He
I
 and the forbidden [O I]
 and
and
 lines in emission allow Briceño et al. (1998) to confirm
[BHS98] MHO 5 as a CTTS, and the strong H
emission is
indicative of high activity (Briceño et al. 1998).
lines in emission allow Briceño et al. (1998) to confirm
[BHS98] MHO 5 as a CTTS, and the strong H
emission is
indicative of high activity (Briceño et al. 1998).
The star was not detected in the ROSAT observations of the L1551 cloud
(Carkner et al. 1996; Wichmann et al. 1996; König et al. 2001) and does not
fall in the field of view of the Chandra observation
(Bally et al. 2003).
The X-ray light curve shows an apparent increase of the X-ray count
rate by approximately 50% over a 30 ks time. Nevertheless this
variation is not statistically compelling, since the source has a
probability of constancy greater than 50%.
The X-ray spectrum is well fit with an absorbed two-temperature model,
with
 keV and
 keV and a low
coronal metal abundance
keV and a low
coronal metal abundance
 .
.
V826 Tau (identified here with source S3 with a 1.0 arcsec offset
between X-ray and optical position) is a spectroscopic binary WTTS
(Mundt et al. 1983) of K7 spectral type and a known member of the L1551
star-forming complex. X-ray emission from the star was first detected
in Einstein X-ray data (Feigelson & Decampli 1981; Reipurth et al. 1990), and
seen again with ASCA and ROSAT by Carkner et al. (1996) who report of a large
flare during the ASCA observations, with the source X-ray luminosity
increasing by a factor 5.
The X-ray emission from V826 Tau varies during the XMM-Newton observation,
with its flux slightly increasing during 50 ks. This slow rise is
statistically significant and the source probability of constancy is
10-5. The source flux was
 erg cm-2 s-1
(0.2-2.0 keV) in the ROSAT observations and
erg cm-2 s-1
(0.2-2.0 keV) in the ROSAT observations and
 erg cm-2 s-1 (0.5-3.0 keV) in the ASCA one. We derive an average flux in
the XMM-Newton observation of
erg cm-2 s-1 (0.5-3.0 keV) in the ASCA one. We derive an average flux in
the XMM-Newton observation of
 erg cm-2 s-1 in both of
the two above energy ranges, indicating lack of strong long term
variability.
erg cm-2 s-1 in both of
the two above energy ranges, indicating lack of strong long term
variability.
The X-ray spectrum of V826 Tau is not well described by the simple
absorbed two-temperature model, with a reduced  of the fit not
acceptable (P=0.0015). Indeed the residuals to the fit show
significant structure, in particular around
of the fit not
acceptable (P=0.0015). Indeed the residuals to the fit show
significant structure, in particular around
 keV, where
the Ne K
complex is located. Letting the abundance of some
elements with strong lines free to vary individually improves the fit
significantly (P = 0.16), as shown in Table 8. The
resulting abundance values are
keV, where
the Ne K
complex is located. Letting the abundance of some
elements with strong lines free to vary individually improves the fit
significantly (P = 0.16), as shown in Table 8. The
resulting abundance values are
 0.12,
0.12,
 0.71 and
 0.31, all significantly higher
than the Fe metal abundance (
0.31, all significantly higher
than the Fe metal abundance (
 0.02).
![\begin{figure}
\par\includegraphics[angle=270,width=8.2cm,clip]{src7_V1075_seg1....
...m}
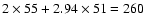
\includegraphics[angle=270,width=8.2cm,clip]{src7_V1075_seg2.ps} \end{figure}](/articles/aa/full/2003/19/aah4098/Timg63.gif) |
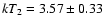
Figure 4:
Left: the spectrum of V1075 Tau
from the first 30 ks of observation; right: the spectrum from
the last 24 ks. The fits to the spectra with an absorbed 2-T model are also shown. |
V827 Tau (identified here with source S6, with a 8.9 arcsec offset)
also is a known X-ray bright WTTS member of the L1551 star-forming
complex of K7 spectral type. It was first detected in X-ray in
Einstein data by Feigelson & Kriss (1981) and subsequently observed by ASCA
and ROSAT (Carkner et al. 1996). The X-ray emission from the star appears
to vary by about 50% over a 40 ks time during the XMM-Newton
observation, with a source probability of constancy of 0.04 according
to the K-S test.
The ROSAT and ASCA fluxes estimate for V827 Tau reported by
Carkner et al. (1996) are
 erg cm-2 s-1 (0.2-2.0 keV) and
 erg cm-2 s-1 (0.8-3.5 keV). The difference in the source
flux between ROSAT and ASCA observations is likely to be due to the
difference in energy range over which the flux is estimated;
Carkner et al. (1996) compare the ROSAT and ASCA spectra and do not find any
significant difference between the two. Over the same energy ranges
used by Carkner et al. (1996), the fluxes derived from the XMM-Newton data are
1.9 and
erg cm-2 s-1 (0.8-3.5 keV). The difference in the source
flux between ROSAT and ASCA observations is likely to be due to the
difference in energy range over which the flux is estimated;
Carkner et al. (1996) compare the ROSAT and ASCA spectra and do not find any
significant difference between the two. Over the same energy ranges
used by Carkner et al. (1996), the fluxes derived from the XMM-Newton data are
1.9 and
 erg cm-2 s-1, respectively, significantly lower
than the values found by Carkner et al. (1996), indicating long term
variability of the X-ray emission from V827 Tau.
erg cm-2 s-1, respectively, significantly lower
than the values found by Carkner et al. (1996), indicating long term
variability of the X-ray emission from V827 Tau.
The X-ray spectrum is well described by an absorbed two-temperature
model, with
 keV and
 keV
and a low coronal metal abundance of
keV
and a low coronal metal abundance of
 .
Since the
spectrum has good S/N a fit with a variable abundance 2-temperature
plasma model was also performed, finding S and Ni to be significantly
over-abundant with respect to the other elements
(Table 8).
.
Since the
spectrum has good S/N a fit with a variable abundance 2-temperature
plasma model was also performed, finding S and Ni to be significantly
over-abundant with respect to the other elements
(Table 8).
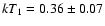
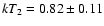
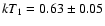
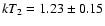
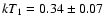
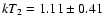
V1075 Tau (identified here with source S7 with a 1.8 arcsec offset) is
a binary WTTS of spectral type K7, and a known member of the L1551
star-forming complex. Its bright X-ray emission was first detected in
Einstein X-ray data by Feigelson & Kriss (1981) and it has been
subsequently observed by ASCA and ROSAT (Carkner et al. 1996).
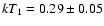
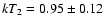
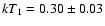
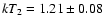
The average spectrum of the source is well described by an absorbed
two-temperature model, with
kT1 = 0.35
0.03 keV and kT2 1.03
0.04 keV and a low coronal metal abundance Z = 0.15
0.03. The fit however shows significant residuals around
 keV likely to be due to an overabundance of Ne in the star's
corona. A variable abundance fit indeed shows that a higher Ne
abundance of
keV likely to be due to an overabundance of Ne in the star's
corona. A variable abundance fit indeed shows that a higher Ne
abundance of
 improves the fit, eliminating the
structure in the residuals around 0.9 keV.
improves the fit, eliminating the
structure in the residuals around 0.9 keV.
The temporal variability of V1075 Tau during the XMM-Newton observation is
significant, with the source counts decreasing by a factor of 2in about 30 ks. The good statistics of the light curve allowed the
spectrum to be analyzed during 2 phases of the observations, which was
split into the first 30 ks and the last 24 ks. The two spectra are
showed in Fig. 4. While the temperatures in the spectrum
do not change significantly, the change in the source flux is
dominated by a decrease in the emission measure for the cooler
temperature. Also, a higher absorption is seen when the source flux is
more intense. The best-fit parameters for the two fits are summarized
in Table 4.
The flux levels in ASCA and ROSAT data are similar:
 erg cm-2 s-1 (0.5-3.0 keV) for ASCA and
 erg cm-2 s-1, (0.2-2.0) keV for ROSAT. In these two energy ranges the
average flux in the XMM-Newton observation is
erg cm-2 s-1, (0.2-2.0) keV for ROSAT. In these two energy ranges the
average flux in the XMM-Newton observation is
 erg cm-2 s-1
and
erg cm-2 s-1
and
 erg cm-2 s-1, respectively, indicating a lack of
significant long term variability.
erg cm-2 s-1, respectively, indicating a lack of
significant long term variability.
V710 Tau (identified with source S14 with a 3.7 arcsec offset) is a
binary system composed of a CTTS and a WTTS (Carkner et al. 1996) and a
known X-ray luminous member of the star-forming complex with spectral
types M1 and M3. X-ray emission from V710 Tau was detected in
Einstein data (Damiani et al. 1995) and it has been subsequently
observed with ROSAT (Carkner et al. 1996). The two stars are not resolved
in the XMM-Newton observations. V710 Tau is not seen to vary during ROSAT
observations, and it does not show significant variability in our
data.
The X-ray spectrum is well fit by an absorbed two-temperature model,
with
 keV and
 keV and a
coronal metal abundance
keV and a
coronal metal abundance
 .
The fit can be improved
by letting the relative abundance of metals free to vary individually.
This results in a high Ne abundance of
.
The fit can be improved
by letting the relative abundance of metals free to vary individually.
This results in a high Ne abundance of
 ,
with a change
in the model null hypothesis probability from 0.37 to 0.45.
,
with a change
in the model null hypothesis probability from 0.37 to 0.45.
4.6 XZ Tau
XZ Tau (identified here with source S18 with a 1.4 arcsec offset) is a
well known M3 CTTS belonging to L1551 star-forming complex. The star
has been resolved as a binary in the infrared, with a 0.3 arcsec
separation (Haas et al. 1990). It is associated, together with HL Tau,
with a complex set of bipolar jets and Herbig-Haro outflows
(Mundt et al. 1990). X-ray emission from XZ Tau was detected in
Einstein data (Damiani et al. 1995) and it has been subsequently
observed with ROSAT and ASCA (Carkner et al. 1996). In the XMM-Newton
observations the X-ray emission from this source is for the first time
clearly resolved from the nearby HL Tau (discussed below).
The average spectrum of XZ Tau is well described by an absorbed
two-temperature model with
 keV and
 keV and a very low coronal metal abundance of
 .
Allowing individual abundances to vary does not provide a
significantly better description to the time integrated spectral data.
.
Allowing individual abundances to vary does not provide a
significantly better description to the time integrated spectral data.
![\begin{figure}
\par\includegraphics[angle=270,width=5.8cm,clip]{src18_XZTau_seg1...
...}
\includegraphics[angle=270,width=5.8cm,clip]{src18_XZTau_seg3.ps} \end{figure}](/articles/aa/full/2003/19/aah4098/Timg98.gif) |
Figure 5:
The spectra of
XZ Tau during three different intervals of the XMM-Newton
observation. From left to right: the spectrum from the first 20 ks, the spectrum from the subsequent 20 ks and the spectrum from
the last 14 ks. The fits to the spectra with an absorbed 2-T model are also shown. |
The short-term temporal variability of XZ Tau during the XMM-Newton
observation is remarkable: its X-ray count rate increases in an
approximately linear fashion along the duration of the observation,
brightening by a factor of 4 in 50 ks (see
Fig. 3). Given the significant temporal variability and
the statistics of the XMM-Newton data we have also performed a
time-resolved spectral analysis, dividing the observation in three
segments of 20, 20 and 15 ks each. The three spectra are
shown in Fig. 5, and their best-fit parameters are
listed in Table 5. The hydrogen column density
decreases, during the XMM observation, from
 cm-2 to
 cm-2, while the
temperatures of the two components increases from kT1=0.14 keV and
kT2=2.29 keV to kT1=1.00 keV and kT2=4.98 keV. The metal
abundance remains constantly low, and the intrinsic variability is
driven by the evolution of the emission measure of the cooler
component.
cm-2, while the
temperatures of the two components increases from kT1=0.14 keV and
kT2=2.29 keV to kT1=1.00 keV and kT2=4.98 keV. The metal
abundance remains constantly low, and the intrinsic variability is
driven by the evolution of the emission measure of the cooler
component.
Although XZ Tau is not resolved from the nearby HL Tau in the ROSAT
observations nor in the ASCA ones, the amount of contamination in the
determination of the flux is likely to be negligible in the ROSAT
data, given the very absorbed spectrum of HL Tau, which results in a
very small flux in the soft ROSAT passband. In fact, HL Tau is not
visible even in the ROSAT HRI data, which have sufficient spatial
resolution to in principle resolve it.
The contamination could be more sizable in the ASCA spectra, given
that HL Tau has a very hard spectrum. However, Carkner et al. (1996) quote
the ASCA flux in the same energy band as the ROSAT one (0.5-2.0 keV),
where, again, the contribution from HL Tau is likely to be negligible.
During the Chandra observation the temporal behavior of XZ Tau
is unremarkable, with a quite constant light curve
(Fig. 6). The spectral analysis of the ACIS data shows
the source to be well fit by a simple 2-temperature model with
parameters
 keV, and comparable
emission measure for the two components. The flux in the 0.5-2.0 keV
range is
keV, and comparable
emission measure for the two components. The flux in the 0.5-2.0 keV
range is
 ,
about 3 times lower than during the
XMM-Newton observation (although the problem with large absorption in the
Chandra data likely makes the flux somewhat underestimated),
and comparable to the flux reported by Carkner et al. (1996) for the ROSAT
PSPC observation. During the Chandra observation XZ Tau is
softer than during the XMM-Newton one, and the best-fit metal abundance
appears to be higher, at
,
about 3 times lower than during the
XMM-Newton observation (although the problem with large absorption in the
Chandra data likely makes the flux somewhat underestimated),
and comparable to the flux reported by Carkner et al. (1996) for the ROSAT
PSPC observation. During the Chandra observation XZ Tau is
softer than during the XMM-Newton one, and the best-fit metal abundance
appears to be higher, at
 ;
whether this is a real
effect, or partly due to the different characteristics (and
calibration issues) of the Chandra and XMM-Newton detectors, is not
clear. Nevertheless, the good agreement between the metal abundance
determined with the Chandra and XMM-Newton data for HD 285845 and
JH 188 would point to the changes in metal abundance in the XZ Tau
spectrum to be real.
;
whether this is a real
effect, or partly due to the different characteristics (and
calibration issues) of the Chandra and XMM-Newton detectors, is not
clear. Nevertheless, the good agreement between the metal abundance
determined with the Chandra and XMM-Newton data for HD 285845 and
JH 188 would point to the changes in metal abundance in the XZ Tau
spectrum to be real.
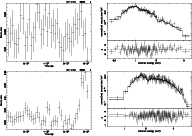 |
Figure 6:
Chandra ACIS light curves and spectra (together with
best-fitting 2-T spectra) of (from top to bottom): XZ Tau, HL
Tau. |
In addition to the short term variability visible in the XMM-Newton
observation, XZ Tau exhibits also significant long term variability.
Carkner et al. (1996) report a variation of a factor 15 between
their ROSAT and ASCA observations (which includes the contribution
from the nearby and unresolved HL Tau, Sect. 4.6), with
source flux increasing from 10-13 to
 erg cm-2 s-1 over the energy range 0.5-2.0 keV. During the XMM-Newton
observation, over the same energy range, the average source flux of
erg cm-2 s-1 over the energy range 0.5-2.0 keV. During the XMM-Newton
observation, over the same energy range, the average source flux of
 erg cm-2 s-1 is about three times the ROSAT level,
while during the Chandra observation the source flux
erg cm-2 s-1 is about three times the ROSAT level,
while during the Chandra observation the source flux
 erg cm-2 s-1 is again close to the level observed by
ROSAT.
erg cm-2 s-1 is again close to the level observed by
ROSAT.
Given this large variability and the significant difference between
the XMM-Newton and Chandra observations discussed here, we also
examined the long-term behavior of XZ Tau by looking at the other
ROSAT (PSPC and HRI) observations not already reported in the
literature as well as at the Einstein observation. The results
are summarized in Table 6. With the exception of the
ASCA observation the X-ray flux from XZ Tau spans a factor of 3. During the ASCA observation the star was in an unusual state,
which does not appear to be a flare, given that its light curve was
very flat and featureless Carkner et al. (1996).
Table 6:
Count rate (in counts per second) and flux level in the 0.5-2.0 keV band for all known X-ray observations of XZ Tau.
Flux in units of 10-13 erg cm-2 s-1.
| Date |
Instr. |
Rate |
Flux |
| 1981-31-01 |
IPC |
0.017 |
1.82 |
| 1994-23-02 |
ASCA (SIS) |
0.06 |
15 |
| 1996-12-31 |
PSPC |
0.023 |
1.13 |
| 1997-02-10 |
PSPC |
0.021 |
1.05 |
| 1997-05-31 |
HRI |
0.0132 |
1.69 |
| 1999-12-14 |
HRI |
0.0162 |
2.07 |
| 2000-09-09 |
XMM (pn) |
0.13 |
2.9 |
| 2001-07-23 |
Chandra |
0.024 |
0.96 |
HL Tau (identified here with source S19 with a 2.3 arcsec offset) lies
about 23 arcsec from XZ Tau and its X-ray emission has not been
resolved from its brighter nearby companion before. HL Tau is an
embedded young stellar object (spectral type K7) often considered a
prototype very young low-mass star, with a circumstellar disk that
resembles the solar nebula at the early stages of planet formation
(Men'shchikov et al. 1999). Together with XZ Tau it is associated with bipolar
jets and Herbig-Haro outflows (Mundt et al. 1990). It does not show
significant variability during the XMM-Newton observation.
HL Tau is visible in the XMM-Newton image only at energies above 1 keV, and
therefore we analyzed the source spectrum in the energy range
1.0-7.5 keV. The spectrum is well described by an absorbed thermal
model with a single temperature component with high absorption,
 cm-2, a temperature
 keV
and a metal abundance
keV
and a metal abundance
 .
.
The light curve of the Chandra observation of HL Tau shows
evidence for a small short duration flare. The ACIS spectrum of the
source has very similar spectral parameters as the EPIC pn one, with
T=2.86
0.26 keV and a coronal metal abundance of Z=0.22
0.08. The metal abundance is nominally lower in the Chandra
data than in the XMM-Newton ones, and indeed the strong Fe K line visible
in the EPIC data is not prominent in the ACIS ones; whether this
difference is significant, given the two different instruments
involved, is not clear.
[BHS98] MHO 4 is identified with source S23 with a 3.2 arcsec offset.
The spectrum of this star obtained by Briceño et al. (1998) shows Li
I
strongly in absorption. He I
,
[O I]
and [O I]
 are also
detected, confirming this very late type star (M6) as a CTTS. The star
appears located in a high extinction region about 8 arcmin south of
L1551 IRS 5 (Briceño et al. 1998).
are also
detected, confirming this very late type star (M6) as a CTTS. The star
appears located in a high extinction region about 8 arcmin south of
L1551 IRS 5 (Briceño et al. 1998).
X-ray emission from this star was first detected by Carkner et al. (1996) in
ROSAT observations of the field. Although they did not have the study
by Briceño et al. (1998) available they correctly identified it as a new
X-ray emitting T Tauri star. The source flux does not appear to have
changed significantly since the ROSAT observation. [BHS98] MHO 4
also does not show significant variability during XMM-Newton observations.
The X-ray spectrum is well described by an absorbed two-temperature
model, with
 keV and
 keV
and a coronal metal abundance only loosely constrained by the upper
limit Z < 2.92. The spectral fit does not strongly constrains the
hydrogen column density,
keV
and a coronal metal abundance only loosely constrained by the upper
limit Z < 2.92. The spectral fit does not strongly constrains the
hydrogen column density,
 cm-2.
cm-2.
[BHS98] MHO 9 (identified here with source S25 with a 2.5 arcsec
offset) is an other of the new WTTS cataloged by Briceño et al. (1998) in
L1551, who attributed it spectral type M4.
X-ray emission from [BHS98] MHO 9 was not detected in the
observations of L1551 made by ROSAT (Carkner et al. 1996;
Wichmann et al. 1996; König et al. 2001). During the XMM-Newton observation the
star does not exhibit significant variability. Its X-ray spectrum is
also well described with an absorbed two-temperature model with
 and
and
 and a coronal metal
abundance only loosely constrained by the upper limit Z < 0.97. The
hydrogen column density is also loosely constrained,
.
and a coronal metal
abundance only loosely constrained by the upper limit Z < 0.97. The
hydrogen column density is also loosely constrained,
.
5 Discussion
Most known pre-main sequence stars belonging to the L1551 cloud and
falling within the XMM-Newton field of view have been detected in the 50 ks
observation discussed in the present paper, so that our survey can be
considered to be nearly complete. X-ray emission from two of the new
pre-main sequence stars discovered in the region by Briceño et al. (1998),
MHO 5 and MHO 9, has been detected for the first time, bringing to
nine the total number of T Tauri stars belonging to the cloud for
which optical and X-ray data are available. Four of these (V826 Tau,
V1075 Tau, V710 Tau and XZ Tau) are known binaries. Thanks to the
large collecting area of XMM-Newton we were able to derive and analyze
CCD-resolution X-ray spectra and light curves for all of these 9
pre-main sequence stars. While this sample of T Tau stars is too
small to carry out a statistical study of correlations between X-ray
emission and stellar properties, several interesting individual
properties of their X-ray emission have been uncovered by the
observation discussed here.
Few of the known pre-main sequence stars in the region are not
detected, in particular the parent star of the HH 30 bipolar jet;
given the "edge-on'' position of the disk, very well visible in e.g.
HST images (Burrows et al. 1996), it is possible that intrinsic X-ray
emission is effectively shadowed by the disk itself.
The target stars are all very young, and have recently formed from the
same cloud, so that their photospheric abundances are likely to be
very similar. At the same time, their coronal metal abundances deduced
from the analysis of their X-ray spectra show a broad range of values.
The metal abundance in the coronae of the WTTSs is clustered around
with a narrow spread, while the abundance derived for the
CTTSs systems spans a much wider range (
 to
to
 ,
i.e. almost two orders of magnitude).
,
i.e. almost two orders of magnitude).
In the cases in which the X-ray spectra have sufficient statistics,
individual metal abundances were derived, showing that a number of
elements tend to be consistently enhanced over Fe (which normally
dominates, with the large number of Fe L lines, the determination of
metal abundance from CCD-resolution spectra). This is in particular
true for Ne, which shows, in V826 Tau, V1075 Tau and V710 Tau a
consistent enhancement over Fe of a factor of 3 to 4. All
three of these stars are binary systems, with V826 Tau and V1075 Tau
being WTTS, and V710 Tau having a WTTS and a CTTS component. No Ne
enhancement is seen in the CTTSs in the sample. The same Ne
enhancement is found in HD 285845, which is an active binary system
past the PMS stage. This general enhancement of Ne over Fe is
consistent with the coronal enhancement of noble gases found in high
resolution spectra in active binaries (Drake et al. 2001).
Whatever the mechanism causing such a large range of coronal metal
abundances starting from the same photospheric abundance, it appears
to consistently enhance some elemental abundances in the WTTS systems
(for which the X-ray emission mechanism is likely to be similar to the
one in older, high-activity stars). Also, in some cases the coronal
abundance appear to vary in time, as shown by the different abundances
derived from the XMM-Newton and Chandra spectra for XZ Tau.
The high temporal variability of X-ray emission from very young stars
is known since the first Einstein observations (e.g.
Montmerle et al. 1983), however the limited collecting area and spectral
resolution of the previous generation of X-ray telescopes did not
allow to study this temporal variability in detail. In our sample two
sources show significant variability over short time scales: XZ Tau
and V1075 Tau. For these we are able to derive spectral information
during different phases of their light curve.
The X-ray flux of XZ Tau, a particularly interesting source because of
its extreme young age (estimated at 55 000 yr, Beckwith et al. 1990), is
seen to increase by a factor 4 during the 50 ks of XMM-Newton
observations, while staying nearly constant during the 80 ks
Chandra observation one year later. During the XMM-Newton
observation the spectrum of the source also changes, with the
absorbing column density decreasing by a factor 4 and hotter
plasma appearing, with the high temperature going from 2 keV
to 5 keV. It is difficult to explain the flux variation in
XMM-Newton data with a stellar flare, which would normally present a faster
and more impulsive rise phase, with a faster increase in plasma
temperature.
Most likely, the decrease in absorbing column density as the flux
increases is not physically linked to the emitting region; its inverse
correlation with the total count rate points to the variation being
due, at least in part, to a "shadow'' effect from material passing in
front of the source. As reported by Carkner et al. (1996), at the time of the
ASCA observation, when the source was at its brightest, the best-fit
absorbing column density (at
 )
was also
lower than during the XMM-Newton observation. In parallel with this
possible shadow effect significant variations in the intrinsic X-ray
emission can of course take place. Unfortunately, the Chandra
data, given the impossibility of accurately determining the absorbing
column density, do not allow to test the presence of a correlation
between apparent source luminosity and absorbing column density in
XZ Tau.
)
was also
lower than during the XMM-Newton observation. In parallel with this
possible shadow effect significant variations in the intrinsic X-ray
emission can of course take place. Unfortunately, the Chandra
data, given the impossibility of accurately determining the absorbing
column density, do not allow to test the presence of a correlation
between apparent source luminosity and absorbing column density in
XZ Tau.
One possible explanation of the spectral variation observed in XZ Tau
is that one is actually observing the shadowing from the stream of
accreting material along the star magnetic field lines, ending in the
hot accretion spot on the star's photosphere. The value for peak
column density determined from the XMM observations is compatible with
the column density expected for the accretion stream in low-mass CTTS.
In this case most of the X-ray emission, to be effectively eclipsed,
should originate from the accretion spot itself, and thus be accretion
driven, rather than coronal in origin. In this case, rotational
modulation of the X-ray emission should also be present, if the
accretion spot(s) are self-eclipsed by the star itself.
6 Conclusions
The high S/N ratio afforded by the XMM-Newton EPIC observations discussed
here allows to study the emission characteristics of the target
population at a level of detail not possible before. Although the
number of pre-main sequence targets with high statistics is small,
significant differences are visible in the X-ray emission of the WTTS
and CTTS population. The metal abundance of the plasma responsible for
the X-ray emission of the two groups shows a different behavior, with
the WTTS clustering tightly around
,
and showing the
same Ne overabundance which is seen in the spectra of very active
stars. At the same time the CTTS span a much wider range in Z, and
show no evidence for Ne overabundance. Thus, while the X-ray spectra
of the WTTS population are indistinguishable from the ones of older
highly active stars (such as active binaries), the spectra of the CTTS
population are different, supporting a different underlying emission
mechanism between the two groups.
The CTTS XZ Tau shows a very peculiar temporal variability, not
reported previously. The inverse correlation between the X-ray flux
and the absorbing column density points towards a "shadow'' effect,
compatible with a scenario in which the emission is shadowed by the
accretion stream being brought between the emitting region and the
observer, perhaps by the stellar rotation. The attendant implication
is that the emission (to be effectively shadowed) must be spatially
concentrated in a small region, suggestive of its being associated
with the accretion spot(s), itself the most likely region on the
stellar surface to be shadowed by the accretion stream.
Kastner et al. (2002), based on the very peaked emission measure they
derive for the high-resolution Chandra X-ray spectrum of the
CTTS TW Hya also claim that its X-ray luminosity is likely to be
(mostly) accretion driven.
While further observations are required to confirm the scenario
described above, both the difference in metallicity and the difference
in temporal variability point toward a difference in the underlying
emission mechanism between the two populations. Such difference is in
agreement with the result of Flaccomio et al. (2003), who find a systematic
difference in the X-ray luminosity between CTTS and WTTS stars, with
the former being less luminous at a given mass. The WTTS emit X-rays
at a level close to (or at) the saturation level observed for older
stars, supporting a scenario in which the underlying emission
mechanism does not change as the star evolves from the WTTS stage onto
the main sequence. The difference in the X-ray spectra and temporal
behavior between CTTS and WTTS found here, together with the general
lower emission levels reported by Flaccomio et al. (2003), are also indicative
of a different underlying emission mechanism, which the shadowing
observed for XZ Tau suggests to be (at least for a significant
fraction) accretion driven.
Acknowledgements
GM, SS acknowledge the partial support of ASI and MIUR. This paper
is based on observations obtained with XMM-Newton, an ESA science mission
with instruments and contributions directly funded by ESA Member
States and the USA (NASA). FF would like to thank I. Pillitteri for
the support in the reduction of XMM-Newton data, J. J. Drake and the
Harvard-Smithsonian Center for Astrophysics for the hospitality and
for the help in analyzing the Chandra data, and L. Hartmann
for the useful discussions.
-
Bally, J., Feigelson, E. D., & Reipurth, B. 2003, ApJ, 584, 843
NASA ADS
-
Beckwith, S. V. W., Sargent, A. I., Chini, R. S., & Guesten, R. 1990, AJ, 99, 924
NASA ADS
-
Bertout, C. 1989, ARA&A, 27, 351
NASA ADS
-
Briceño, C., Calvet, N., Gomez, M., et al. 1993, PASP, 105, 686
NASA ADS
-
Briceño, C., Hartmann, L. W., Stauffer, J. R., et al. 1998, AJ, 115, 2074
NASA ADS
-
Burrows, C. J., Stapelfeldt, K. R., Watson, A. M., et al. 1996, ApJ, 473, 437
NASA ADS
-
Carkner, L., Feigelson, E. D., Koyama, K., et al. 1996, ApJ, 464, 286
NASA ADS
-
Cox, A. N., (ed.) 2000, Allen's astrophysical quantities (Springer)
-
Cudworth, K. M., & Herbig, G. 1979, AJ, 84, 548
NASA ADS
-
Damiani, F., Micela, G., Sciortino, S., & Harnden, F. R. J. 1995, ApJ, 446, 331
NASA ADS
-
Drake, J. J., Brickhouse, N. S., Kashyap, V., et al. 2001, ApJ, 548, L81
NASA ADS
-
Favata, F., Fridlund, C. V. M., Micela, G., Sciortino, S., & Kaas, A. A. 2002, A&A, 386, 204
NASA ADS
-
Feigelson, E. D., Broos, P., Gaffney, J. A., et al. 2002, ApJ, 574, 258
NASA ADS
-
Feigelson, E. D., & Decampli, W. M. 1981, ApJ, 243, L89
NASA ADS
-
Feigelson, E. D., Jackson, J. M., Mathieu, R. D., et al. 1987, AJ, 94, 1251
NASA ADS
-
Feigelson, E. D., & Kriss, G. A. 1981, ApJ, 248, L35
NASA ADS
-
Feigelson, E. D., & Kriss, G. A. 1983, AJ, 88, 431
NASA ADS
-
Feigelson, E. D., & Montmerle, T. 1999, ARA&A, 37, 363
NASA ADS
-
Flaccomio, E., Micela, G., & Sciortino, S. 2003, A&A, 397, 611
NASA ADS
-
Flaccomio, E., Micela, G., Sciortino, S., et al. 2000, A&A, 355, 651
NASA ADS
-
Giovanardi, C., Rodríguez, L. F., Lizano, S., et al. 2000, ApJ, 538, 728
NASA ADS
-
Gomez, M., Jones, B. F., Hartmann, L., et al. 1992, AJ, 104, 762
NASA ADS
-
Haas, M., Leinert, C., & Zinnecker, H. 1990, A&A, 230, L1
NASA ADS
-
Hasinger, G., Altieri, B., Arnaud, M., et al. 2001, A&A, 365, L45
NASA ADS
-
Jones, B. F., & Herbig, G. H. 1979, AJ, 84, 1872
NASA ADS
-
König, B., Neuhäuser, R., & Stelzer, B. 2001, A&A, 369, 971
NASA ADS
-
Kastner, J. H., Huenemoerder, D. P., Schulz, N. S., Canizares, C. R., & Weintraub, D. A. 2002, ApJ, 567, 434
NASA ADS
-
Kenyon, S. J., Dobrzycka, D., & Hartmann, L. 1994, AJ, 108, 1872
NASA ADS
-
Men'shchikov, A. B., Henning, T., & Fischer, O. 1999, ApJ, 519, 257
NASA ADS
-
Montmerle, T., Koch-Miramond, L., Falgarone, E., & Grindlay, J. E. 1983, ApJ, 269, 182
NASA ADS
-
Mundt, R., Ray, T., Bührke, T., Raga, A., & Solf, J. 1990, A&A, 232, 37
NASA ADS
-
Mundt, R., Walter, F. M., Feigelson, E. D., et al. 1983, ApJ, 269, 229
NASA ADS
-
Plucinsky, P. P., Schulz, N. S., Marshall, H. L., et al. 2003, in Astronomical Telescopes
and Instrumentation 2002, ed. J. Truemper, & H. Tananbaum, SPIE Conf. Proc., 4851, 89
-
Reipurth, B., Lindgren, H., Nordstrom, B., et al. 1990, A&A, 235, 197
NASA ADS
-
Schneider, G., Hershey, J. L., & Wenz, M. T. 1998, PASP, 110, 1012
NASA ADS
-
Snell, R. L., & Bally, J. 1986, ApJ, 303, 683
NASA ADS
-
Walter, F. M., Brown, A., Mathieu, R. D., et al. 1988, AJ, 1, 297
-
Wichmann, R., Krautter, J., Schmitt, J. H. M. M., et al. 1996, A&A, 312, 439
NASA ADS
Copyright ESO 2003
![\begin{figure}
\par\includegraphics[height=8.2cm,width=18cm,clip]{xrayoptimg.ps} \end{figure}](/articles/aa/full/2003/19/aah4098/img10.gif)
![\begin{figure}
\par\includegraphics[angle=270,width=8cm,clip]{src22_HD285845_lc....
...ace*{8mm}
\includegraphics[angle=270,width=8cm,clip]{hd282tvxpec.ps}\end{figure}](/articles/aa/full/2003/19/aah4098/img35.gif)
![\begin{figure}
\par\includegraphics[angle=270,width=8.2cm,clip]{src7_V1075_seg1....
...m}
\includegraphics[angle=270,width=8.2cm,clip]{src7_V1075_seg2.ps} \end{figure}](/articles/aa/full/2003/19/aah4098/img63.gif)