A&A 402, 465-476 (2003)
DOI: 10.1051/0004-6361:20030275
XMM-Newton observations of four high-z quasars
E. Ferrero1 - W. Brinkmann2
1 - Max-Planck-Institut für extraterrestrische Physik,
Postfach 1312, 85741 Garching, Germany
2 - Centre for Interdisciplinary Plasma Science,
Max-Planck-Institut für extraterrestrische Physik,
Postfach 1312, 85741 Garching, Germany
Received 7 November 2002 / Accepted 18 February 2003
Abstract
We present the results of XMM-Newton observations of four high-z quasars, two radio-loud
and two radio-quiet. One of the radio-loud objects, PKS 2126-158, clearly shows absorption
in excess of the galactic value as claimed before from ASCA and ROSAT observations.
For PKS 2149-306 the evidence for excess
absorption is only marginal in contrast to previous results.
The location of the absorber in PKS 2126-158 is compatible with the
redshift of the source.
Both, a warm and a cold absorber are allowed by the X-ray data.
Both quasars have very flat photon spectra (
 )
and
the high photon statistics reveal small deviations from a simple power law form.
For the two radio-quiet objects, Q 0000-263 and Q 1442+2931, we determine, for
the first time, reliable spectral parameters. Both quasars have steeper power laws
(
)
and
the high photon statistics reveal small deviations from a simple power law form.
For the two radio-quiet objects, Q 0000-263 and Q 1442+2931, we determine, for
the first time, reliable spectral parameters. Both quasars have steeper power laws
(
 )
and show absorption consistent with the galactic value, similar to
radio-quiet quasars at low redshifts.
In the case of Q 0000-263 the presence of the damped Ly
)
and show absorption consistent with the galactic value, similar to
radio-quiet quasars at low redshifts.
In the case of Q 0000-263 the presence of the damped Ly system
(
system
(
 cm-2 at z = 3.39) cannot be examined further due to the
limited photon statistics in all instruments.
cm-2 at z = 3.39) cannot be examined further due to the
limited photon statistics in all instruments.
Key words: galaxies: active - quasars: general -
X-rays: galaxies
High redshift quasars are the most luminous and most distant,
continuously emitting sources of electromagnetic radiation
in the observable Universe.
In particular at X-ray energies luminosities greater than 10 erg
s
erg
s are observed for some objects (Brinkmann et al.1995).
These extreme luminosities imply the presence
of super-massive black holes (
are observed for some objects (Brinkmann et al.1995).
These extreme luminosities imply the presence
of super-massive black holes (

 )
in the
centers of the sources and therefore provide severe constraints on
theories of structure formation in the early Universe.
High redshift quasars are key objects to understand the cosmological
evolution of the physical properties in and around quasars
on the longest possible time scales and they present rare,
directly observable tracers of the physical conditions of the
early Universe.
)
in the
centers of the sources and therefore provide severe constraints on
theories of structure formation in the early Universe.
High redshift quasars are key objects to understand the cosmological
evolution of the physical properties in and around quasars
on the longest possible time scales and they present rare,
directly observable tracers of the physical conditions of the
early Universe.
The X-ray band is important for at least two reasons: the X-ray luminosity
represents a large fraction of the bolometric luminosity of quasars
(Elvis et al.1994a) and it is known from variability and spectral
studies (e.g. Mushotzky et al. 1993; Yuan et al. 1998a;
Yuan & Brinkmann 1998) that the X-rays
are emitted very close to the central engine - a region which is not accessible
at any other wavelength with current instrumentation.
To understand quasars a detailed knowledge is required about
the mechanisms of the quasar emission and
about the cosmical evolution of the objects.
Radio, optical, and X-ray luminosity functions indicate that the typical
luminosity of a quasar at  is higher by a factor of
50-100 compared to a local one (Boyle et al.1993), but the result
is dominated by a few high redshift quasars with extreme luminosities.
How are these enormous amounts of radiative energy produced and do
these properties evolve with time?
What is the origin of the radio-loud / radio-quiet dichotomy, i.e., the fact
that about 10% of the quasars show significant radio emission, are
brighter at high energies and more variable?
is higher by a factor of
50-100 compared to a local one (Boyle et al.1993), but the result
is dominated by a few high redshift quasars with extreme luminosities.
How are these enormous amounts of radiative energy produced and do
these properties evolve with time?
What is the origin of the radio-loud / radio-quiet dichotomy, i.e., the fact
that about 10% of the quasars show significant radio emission, are
brighter at high energies and more variable?
Early studies of low-z quasars by the Einstein
observatory (Zamorani et al. 1981; Wilkes & Elvis 1987)
and ROSAT (Brinkmann et al. 1997; Yuan et al. 1998a) revealed
X-ray luminosities up to
 1047 erg s-1, which are roughly proportional to the
corresponding optical luminosities, with a large dispersion.
The X-ray spectra in the soft band can be described
by power laws with a wide range of slopes with averages
around
1047 erg s-1, which are roughly proportional to the
corresponding optical luminosities, with a large dispersion.
The X-ray spectra in the soft band can be described
by power laws with a wide range of slopes with averages
around
 for radio-loud quasars and
 for radio-quiet quasars, both flattening with
increasing redshift.
In the harder ASCA energy band
radio-loud quasars have approximately
for radio-quiet quasars, both flattening with
increasing redshift.
In the harder ASCA energy band
radio-loud quasars have approximately
 and
radio-quiet quasars
and
radio-quiet quasars
 (Reeves & Turner 2000).
At a given optical luminosity radio-loud
quasars are typically 3 times more X-ray luminous than radio-quiet
quasars.
A measure for this luminosity ratio is the X-ray loudness
(Reeves & Turner 2000).
At a given optical luminosity radio-loud
quasars are typically 3 times more X-ray luminous than radio-quiet
quasars.
A measure for this luminosity ratio is the X-ray loudness
 ,
the broad spectral index of a nominal power law from the optical to
the X-ray band.
From Einstein and ROSAT observations (Zamorani et al. 1981;
Wilkes & Elvis 1987; Brinkmann et al. 1997; Yuan et al. 1998a) it is seen
that this quantity is smaller for radio-loud quasars
(
,
the broad spectral index of a nominal power law from the optical to
the X-ray band.
From Einstein and ROSAT observations (Zamorani et al. 1981;
Wilkes & Elvis 1987; Brinkmann et al. 1997; Yuan et al. 1998a) it is seen
that this quantity is smaller for radio-loud quasars
(
 )
than for radio-quiet quasars
(
)
than for radio-quiet quasars
(
 ).
The observationally found dependence of
on redshift and optical luminosity, where the primary correlation is
that on optical luminosity (Avni & Tananbaum 1982, 1986; Wilkes et al. 1994;
Yuan et al. 1998a), would imply a different evolution in the optical and
X-ray regime. However, Brinkmann et al. (1997) and Yuan et al. (1998b)
argue that this dependence is not a physical property of the population
but can be introduced by selection effects and the luminosity
dispersions of the samples in the optical and X-ray band.
).
The observationally found dependence of
on redshift and optical luminosity, where the primary correlation is
that on optical luminosity (Avni & Tananbaum 1982, 1986; Wilkes et al. 1994;
Yuan et al. 1998a), would imply a different evolution in the optical and
X-ray regime. However, Brinkmann et al. (1997) and Yuan et al. (1998b)
argue that this dependence is not a physical property of the population
but can be introduced by selection effects and the luminosity
dispersions of the samples in the optical and X-ray band.
The differences between the two classes of quasars
can be explained in a two component emission model
(Zamorani et al. 1981; Wilkes & Elvis 1987),
where a steep soft component, linked to the optical
emission, is present in all quasars and a second
flat spectrum hard component linked to the radio emission through the SSC
mechanism dominates the X-ray emission of radio-loud quasars.
The question of whether quasars do exhibit spectral evolution or not is
fundamental and has direct impact on quasar formation models.
The question of whether the observed difference between radio-quiet and
radio-loud quasars at low redshifts persists
to high redshifts cannot be answered conclusively with current data, which
tentatively indicate that no evolution takes place in radio-loud quasars,
but the number of objects is still very low. Spectra for high redshift
radio-quiet quasars with reasonable quality hardly exist.
A study of the
currently unknown spectral properties of high redshift radio-quiet quasars
is also relevant for our understanding of the cosmic X-ray background and
the contribution of these objects.
One of the major results of the ROSAT and ASCA observations of high redshift
radio-loud quasars was the detection of absorption in excess of what
is expected from the galactic  -value (Elvis et al.1994b;
Siebert et al.1996; Brinkmann et al.1997; Cappi et al.1997; Yuan et al.2000).
However, due to the low
signal-to-noise of the spectra and the insufficient energy resolution of
the instruments, it is impossible to unambiguously determine whether the
absorption is galactic, inter galactic or intrinsic
to the quasar and, in some cases, the absorption appears to be even temporarily
variable (Schartel et al.1997).
Current observations
tentatively indicate an intrinsic absorption site. Related to this is the
question, whether excess absorption is also a feature of radio-quiet
quasars (Yuan et al.1998a; Yuan & Brinkmann 1998).
Up to now, the answer is no, but the data are far from being conclusive.
Any systematic differences in the spectral and/or absorption properties
between radio-loud
and radio-quiet quasars can be extremely important for an
understanding of the formation processes for quasars and the
radio-loud/radio-quiet dichotomy.
-value (Elvis et al.1994b;
Siebert et al.1996; Brinkmann et al.1997; Cappi et al.1997; Yuan et al.2000).
However, due to the low
signal-to-noise of the spectra and the insufficient energy resolution of
the instruments, it is impossible to unambiguously determine whether the
absorption is galactic, inter galactic or intrinsic
to the quasar and, in some cases, the absorption appears to be even temporarily
variable (Schartel et al.1997).
Current observations
tentatively indicate an intrinsic absorption site. Related to this is the
question, whether excess absorption is also a feature of radio-quiet
quasars (Yuan et al.1998a; Yuan & Brinkmann 1998).
Up to now, the answer is no, but the data are far from being conclusive.
Any systematic differences in the spectral and/or absorption properties
between radio-loud
and radio-quiet quasars can be extremely important for an
understanding of the formation processes for quasars and the
radio-loud/radio-quiet dichotomy.
Furthermore, if damped Ly
systems are in the line-of-sight, it should be
possible, with the help of X-ray observations, to determine the ionization
state of these systems and thus derive limits on the size, temperature and
density for them (Fang & Canizares 2000). However, so far
current data do not give significant constraints (Fang et al.2001).
In this paper we present the results of XMM-Newton observations of four
high redshift quasars. Two are radio-loud, PKS 2126-158(z = 3.27)
and PKS 2149-306(z = 2.34) and two are radio-quiet, Q 1442+2931(z = 2.64) and Q 0000-263(z = 4.10).
All of them have been observed in X-rays before. From ASCA data
(as well as ROSAT data in the case of PKS 2126-158) Cappi et al.(1997) claim
excess absorption towards the radio-loud objects.
No excess absorption towards the radio-quiet objects was found
from ROSAT observations (Bechtold et al. 1994a; Reimers et al. 1995;
Kaspi et al. 2000).
Q 0000-263was observed by ROSAT in a PSPC pointed observation on November 30,
1991. From this observation Bechtold et al. (1994a) found an energy
index
 and no indications for extra absorption.
From this observation and from a second PSPC pointing
on November 26, 1991 Kaspi et al. (2000) determined an unabsorbed
flux in the 0.1-2.0 keV band of
and no indications for extra absorption.
From this observation and from a second PSPC pointing
on November 26, 1991 Kaspi et al. (2000) determined an unabsorbed
flux in the 0.1-2.0 keV band of
 erg cm-2 s-1
and an optical - to - X-ray index
erg cm-2 s-1
and an optical - to - X-ray index
 .
However, they had to assume a photon index
.
However, they had to assume a photon index
 and galactic absorption as the data were insufficient
to perform a spectral fit.
and galactic absorption as the data were insufficient
to perform a spectral fit.
The discovery of Q 1442+2931was reported by Sanduleak & Pesch (1989) and the source
was first observed in X-rays by the ROSAT PSPC in November 1992 and
in July 1993 (Reimers et al. 1995). The accumulated net counts were not sufficient
to allow a spectral analysis, however Reimers et al. (1995) find no
indications for excess absorption as the photons were distributed
over the whole ROSAT energy band.
PKS 2126-158was detected in X-rays by Einstein (Zamorani et al.1981).
The ROSAT PSPC spectrum was presented in Elvis et al.(1994b) and
from ASCA observations Serlemitsos et al.(1994) constrained the
redshift of the absorber at z < 0.4.
However, Cappi et al.(1997) could not reproduce these results and
attribute them to the use of older response matrices by
Serlemitsos et al.(1994).
With a 2-10 keV X-ray luminosity of
 erg s-1PKS 2149-306is one of the most luminous radio-loud quasars in the Universe.
The ROSAT All Sky Survey data and the ASCA observations of PKS 2149-306
were first discussed in Siebert et al.(1996).
The absorption column density found by Cappi et al.(1997) is slightly higher,
but consistent, with that given by Siebert et al.(1996).
However, the extra absorption (
erg s-1PKS 2149-306is one of the most luminous radio-loud quasars in the Universe.
The ROSAT All Sky Survey data and the ASCA observations of PKS 2149-306
were first discussed in Siebert et al.(1996).
The absorption column density found by Cappi et al.(1997) is slightly higher,
but consistent, with that given by Siebert et al.(1996).
However, the extra absorption (
 cm-2) is not large and the deduced value
could be affected significantly by calibration
uncertainties of the SIS detectors.
cm-2) is not large and the deduced value
could be affected significantly by calibration
uncertainties of the SIS detectors.
The 2-10 keV flux of
 erg cm-2 s-1 reported
from a BeppoSAX observation in October 1997 (Elvis et al. 2000) is
only 80% of the ASCA flux in 1994 (Cappi et al. 1997).
The hard power law index of
erg cm-2 s-1 reported
from a BeppoSAX observation in October 1997 (Elvis et al. 2000) is
only 80% of the ASCA flux in 1994 (Cappi et al. 1997).
The hard power law index of
 is similar to
the values found by ASCA (
is similar to
the values found by ASCA (
 ,
Cappi et al. 1997),
however, the LECS showed an excess of counts
below 1 keV and the absorption had to be fixed to the galactic
value.
No evidence for a red-shifted Fe-K emission line was seen in the spectrum
and an upper limit of 63 eV for the equivalent width of a line at
5 keV claimed by Yaqoob et al.(1999) was given.
,
Cappi et al. 1997),
however, the LECS showed an excess of counts
below 1 keV and the absorption had to be fixed to the galactic
value.
No evidence for a red-shifted Fe-K emission line was seen in the spectrum
and an upper limit of 63 eV for the equivalent width of a line at
5 keV claimed by Yaqoob et al.(1999) was given.
In recent Chandra observations Fang et al.(2001) do not find significant
excess absorption towards PKS 2149-306. The source flux has decreased by about 30%
compared to the ASCA observation and the deduced power law index
 is significantly lower than the value of
 seen by ASCA. Further, the emission feature around 5 keV
reported by Yaqoob et al.(1999) was not found in the Chandra data.
seen by ASCA. Further, the emission feature around 5 keV
reported by Yaqoob et al.(1999) was not found in the Chandra data.
In this paper we will present the results of XMM-Newton observations
of these four quasars.
In the next section we will give details on the observations and discuss the
temporal behavior of the objects.
We will then present the spectral analyses of the objects and discuss in Sect. 4
their broad band properties, in particular the amount of absorption towards the
sources.
A general discussion and a summary will be given in Sect. 5.
Table 1:
Data of observations.
The observational details for the four sources are reported
in Table 1.
All PN and MOS data were reprocessed using XMMSAS version 5.3.0; for the
RGS data XMMSAS version 5.3.3 has been used.
![\begin{figure}
\par\includegraphics[width=8.8cm,clip]{3275f1.eps}\end{figure}](/articles/aa/full/2003/17/aa3275/Timg35.gif) |
Figure 1:
Combined PN+MOS, background subtracted, 0.2-10 keV lightcurves
of the four quasars. The time binning is 500 s for the radio-loud
quasars and 1000 s for the radio-quiet quasars. |
| Open with DEXTER |
We calculated the 0.2-10 keV light curves for all four objects by
extracting the photons from a
circular region centered on the source with a radius of 45
 .
This extraction radius was chosen to avoid contamination
from nearby objects and it contains about 90% of the
source photons,
using the encircled energy function given by Ghizzardi & Molendi (2001).
Only single and double events (i.e. with pattern 0-4 for the PN camera
and 0-12 for the MOS cameras) and with quality flag 0 were chosen.
The time bin size was set to be 500 s for the radio-loud objects
and to 1000 s for the radio-quiet ones and
we used only the time range for which all EPIC cameras were switched on.
.
This extraction radius was chosen to avoid contamination
from nearby objects and it contains about 90% of the
source photons,
using the encircled energy function given by Ghizzardi & Molendi (2001).
Only single and double events (i.e. with pattern 0-4 for the PN camera
and 0-12 for the MOS cameras) and with quality flag 0 were chosen.
The time bin size was set to be 500 s for the radio-loud objects
and to 1000 s for the radio-quiet ones and
we used only the time range for which all EPIC cameras were switched on.
The backgrounds were determined with the same selection criteria
from source free regions on the same chips and subtracted from the
source light curves.
The co - added PN and MOS net light curves for the four objects are shown
in Fig. 1.
The light curve of PKS 2149-306is consistent with a constant average
flux during the observation period.
A Kolmogorov-Smirnov test gives a  15% probability that
the short time variability is only that expected from purely statistical
fluctuations.
However, no definite time scale can be deduced from the
relatively noisy data.
15% probability that
the short time variability is only that expected from purely statistical
fluctuations.
However, no definite time scale can be deduced from the
relatively noisy data.
PKS 2126-158shows a slight increase of the count rate with time of
 cts s-2 as well as
short time flux variations of 5% on time scales of 1 ksec.
These variations seem to occur in a well organized linear
fashion but the counting statistics are insufficient for
a more detailed analysis.
In both cases these variations are moderate and not unusual amongst
radio loud quasars. From the observed variability we can estimate
a lower limit to the radiative efficiency
cts s-2 as well as
short time flux variations of 5% on time scales of 1 ksec.
These variations seem to occur in a well organized linear
fashion but the counting statistics are insufficient for
a more detailed analysis.
In both cases these variations are moderate and not unusual amongst
radio loud quasars. From the observed variability we can estimate
a lower limit to the radiative efficiency
 (Fabian 1979).
With the above given time scale and the luminosity
determined from the spectral analysis (see Sect. 3) we
obtain
(Fabian 1979).
With the above given time scale and the luminosity
determined from the spectral analysis (see Sect. 3) we
obtain  .
This value largely exceeds the theoretical
limit of accretion onto a black hole implying enhancement of
the emission by relativistic beaming.
.
This value largely exceeds the theoretical
limit of accretion onto a black hole implying enhancement of
the emission by relativistic beaming.
The light curves of the two radio-quiet objects Q 0000-263and Q 1442+2931are consistent with a constant flux
and show no statistically significant variations.
The drop of the count rate at the end of the Q 1442+2931observation and the
one exceptional low point coincide with strong flaring activity of
the background and are thus very likely not source intrinsic
intensity variations.
3 Spectral analysis
We have performed the spectral analysis of PN, MOS and RGS data
for both radio-loud quasars
using the latest available versions of the response matrices,
released in April 2002 (PN) and in March 2002 (MOS).
The RGS response matrices were created with the SAS package
rgsrmfgen.
In the case of the radio-quiet quasars we have analyzed only
the PN and MOS data, because of the low photon statistics in the
RGS spectra.
As a preliminary step, we have created Good Time Interval (GTI)
files to check for time intervals with high background which
could contaminate significantly the source photons.
For both the radio-loud sources the background remained low during the
whole observation, so that no time intervals had to be excluded from
the subsequent analysis.
During the observations of the two radio-quiet objects
several background flares were found and
the flaring time intervals were excluded in the spectral analysis.
We also checked for pile up exploiting the XMMSAS task epatplot, both
for the PN and the MOS cameras. We found no indications for it
in the radio-quiet sources and in PKS 2149-306,
whereas for PKS 2126-158signs for pile up are present for the PN camera
with a count rate of 2.7 cts/s which is close to the critical value
for a point source in the Extended Full Window mode.
No pile up was found for the MOS cameras.
For the PN camera we extracted the photons from a
circular region of radius 45'' centered on the X-ray positions
of all four quasars.
This extraction radius corresponds to the maximum allowed to avoid
the chip boundaries.
In the case of PKS 2126-158we also excluded from the analysis the four
central (RAW-) pixels in order to avoid pile up.
The same extraction radius as for the PN was used for the MOS cameras.
The backgrounds were extracted from source free regions
with the same radius from positions near the source.
Only single and double events with flag 0 were selected for the PN,
whereas only photons with pattern 0-12 and flag 0
were chosen for the MOS (for details on the XMM detectors
see Ehle et al.2001).
Finally, the produced spectra were binned to contain at least 50 and 30
photons
per energy channel for the radio-loud and radio-quiet sources,
respectively, in order to have a sufficient signal to noise ratio
and to allow
the use of the  statistics for the fit.
To perform the spectral analysis of RGS data we have used the
standard science data files created by the RGS Pipeline Processing
binned to contain at least 30 photons per energy channel.
With the above selection criteria we obtained a total of  43 200 net
counts from the PN camera for a spectral fit.
The hardness ratios of the counts in the 0.2-1 keV / 2.5-10 keV
band show slight variations over the observation, not obviously
correlated with the count rate. We therefore checked the spectral
changes by dividing the observation interval in three parts.
In all three intervals the fitted spectral power law
slopes, assuming galactic
or fitting the absorbing column density,
remained the same inside the statistical uncertainties.
The differences were marginal and therefore
we combined the whole data set for the spectral analysis.
43 200 net
counts from the PN camera for a spectral fit.
The hardness ratios of the counts in the 0.2-1 keV / 2.5-10 keV
band show slight variations over the observation, not obviously
correlated with the count rate. We therefore checked the spectral
changes by dividing the observation interval in three parts.
In all three intervals the fitted spectral power law
slopes, assuming galactic
or fitting the absorbing column density,
remained the same inside the statistical uncertainties.
The differences were marginal and therefore
we combined the whole data set for the spectral analysis.
We first fitted the PN data (see Table 2)
with a simple power law model with free absorption
for the 0.2-8 keV energy range, leaving out the inherently noisy data
above 8 keV. The fit and the resulting residuals, as ratio between model and
data, are given in Fig. 2.
This fit yielded a photon index
 and
and
 cm-2, slightly in excess
of the galactic
value of
cm-2, slightly in excess
of the galactic
value of
 cm-2.
The fit is acceptable with a reduced
cm-2.
The fit is acceptable with a reduced
 /528 d.o.f.
A similar fit with
fixed to the galactic value is
worse with
/528 d.o.f.
A similar fit with
fixed to the galactic value is
worse with
 and a
reduced
and a
reduced
 .
We further tried a broken power law model and obtained
a very flat slope (
.
We further tried a broken power law model and obtained
a very flat slope (
 )
at
low energies, a slope of
)
at
low energies, a slope of
 at high energies,
similar to the value of the single power law fit,
a break energy of
at high energies,
similar to the value of the single power law fit,
a break energy of
 keV, but with an
lower
than the galactic value, with a reduced
keV, but with an
lower
than the galactic value, with a reduced
 .
Fixing the absorption at the
galactic value yields an equally acceptable fit
(
.
Fixing the absorption at the
galactic value yields an equally acceptable fit
(
 )
with
nearly identical parameters, except for a steeper slope
(
)
with
nearly identical parameters, except for a steeper slope
(
 )
at low energies.
An F-test gives an improvement for the
broken power law fit at only the 86% confidence
level, therefore we will from
now on only consider single power law fits.
)
at low energies.
An F-test gives an improvement for the
broken power law fit at only the 86% confidence
level, therefore we will from
now on only consider single power law fits.
![\begin{figure}
\par\includegraphics[width=8.8cm,clip]{aa3275f2.eps}
\end{figure}](/articles/aa/full/2003/17/aa3275/Timg55.gif) |
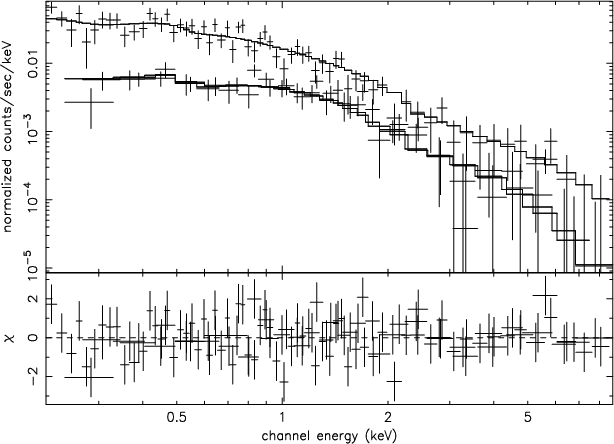
Figure 2:
Power law fit with free absorption for PKS 2149-306in the 0.2-8 keV energy range. The upper panel shows the PN fit, the middle panel
the ratio between data and model; the lower panel gives for a comparison
the ratios for the power law fit to the combined MOS1 plus MOS2 data. |
| Open with DEXTER |
The power law fit to the MOS data gave slightly different results, summarized
in Table 2.
As can be seen, the reduced
are larger
for MOS2 and for both MOS1 and MOS2 the fitted slopes are
considerably flatter than those for the PN, more than usually found
when comparing MOS and PN data. Deviations from a simple power law spectrum
could be responsible for the observed differences.
For the MOS2 we also get a column density lower than the galactic value.
To improve the statistics, we combined the MOS1 and MOS2 data.
The power law fits yielded similar results as above, with slopes
still flatter than obtained for the PN (see Fig. 2).
Interestingly, the slopes found for the simple power law fit to the MOS
data are very similar to the values of the low-energy slopes of the
broken power law fit to the PN data (with galactic ).
However, the quality of the MOS data appears to be lower,
the residuals are much noisier and the obtained s are
worse than those from the fits to the PN data, which can be
seen in Fig. 2 where the lower panel shows the
ratios for the MOS fit.
Whether remaining calibration uncertainties or an intrinsic
source spectrum which cannot adequately be described by a simple
power law, account for the observed discrepancies cannot be
distinguished with the current data.
We further fitted the RGS data with an absorbed power law
in the 0.35-2 keV energy range.
The fits to the RGS1 and RGS2 data yielded different results,
with power law slopes
 (
(
 d.o.f.) and
 (
(
 d.o.f.)
assuming galactic absorption for RGS1 and RGS2,
respectively. The fits with free absorption gave similar slopes
with
consistent with the galactic value
for the RGS1 whereas in the case of the RGS2
a flatter slope (
d.o.f.)
assuming galactic absorption for RGS1 and RGS2,
respectively. The fits with free absorption gave similar slopes
with
consistent with the galactic value
for the RGS1 whereas in the case of the RGS2
a flatter slope (
 )
with
lower than the galactic value is found.
Due to the discrepancies between the two instruments, and
to improve the photon statistics, we combined the RGS1 and RGS2
data, tolerating some data degradation and inferior resolution
compared to the separate fits.
The results yielded flat slopes, in between those from the analogous fits
to the MOS and PN data (
)
with
lower than the galactic value is found.
Due to the discrepancies between the two instruments, and
to improve the photon statistics, we combined the RGS1 and RGS2
data, tolerating some data degradation and inferior resolution
compared to the separate fits.
The results yielded flat slopes, in between those from the analogous fits
to the MOS and PN data (
 ,
,
 /81 d.o.f. for galactic ;
 ,
,
 /80 d.o.f.
with an
value compatible with zero).
There are no obvious structures to be seen in the residuals, but the
quality of the RGS data is rather low.
Considering the discrepancies among the various
instruments, we did not attempt to combine and fit the PN and MOS data or the PN and RGS data together,
but rely in the following mainly on the PN data.
/80 d.o.f.
with an
value compatible with zero).
There are no obvious structures to be seen in the residuals, but the
quality of the RGS data is rather low.
Considering the discrepancies among the various
instruments, we did not attempt to combine and fit the PN and MOS data or the PN and RGS data together,
but rely in the following mainly on the PN data.
Table 2:
Results for power law fits for PKS 2149-306in the energy band 0.2-8.0 keV.
We tried other models like a thermal
bremsstrahlung and a constant density ionized disk model
(Ballantyne et al.2001).
The thermal bremsstrahlung model yielded a temperature of
kT=9.8 keV; however, the fit is unacceptable with a
reduced
 d.o.f.
The ionized disk model (assuming galactic )
resulted in an
ionization parameter
d.o.f.
The ionized disk model (assuming galactic )
resulted in an
ionization parameter
 ,
a photon index of the incident power law
,
a photon index of the incident power law
 ,
a reflection fraction
,
a reflection fraction
 ,
and a reduced
,
and a reduced
 d.o.f.
Thus, the ionized disk model provides only a poor fit,
the reflection fraction is very small, and the obtained slope is
very similar to that of the power law fit.
d.o.f.
Thus, the ionized disk model provides only a poor fit,
the reflection fraction is very small, and the obtained slope is
very similar to that of the power law fit.
Single power law fits to the data in the hard energy band (2 keV)
result in excellent fits with slightly flatter slopes (see Table 3).
An extrapolation
of those power laws to lower energies seem to indicate a deficit of
flux below 1 keV. However, small changes in the energy range
used for the fit (especially when the inherently noisy data 8 keV
are left out from the fit) result in acceptable fits (
 )
with slightly differing power law slopes and fitted
values in accordance to the galactic absorption.
)
with slightly differing power law slopes and fitted
values in accordance to the galactic absorption.
The addition of an extra emission component to the power law,
for example a black body with
 keV, contributing about
5-8% to the flux at 1 keV, provides an acceptable fit
over the whole 0.2-10.0 keV energy band (
keV, contributing about
5-8% to the flux at 1 keV, provides an acceptable fit
over the whole 0.2-10.0 keV energy band (
 /528 d.o.f.) with a power law slope of
 and fixed galactic absorption.
Finally, we tried a power law with fixed galactic absorption over the whole
energy band, allowing for extra absorption at the redshift of the source.
The fit is acceptable (
 d.o.f.)
with
and an intrinsic column density of
d.o.f.)
with
and an intrinsic column density of
 cm-2.
A similar fit could be achieved with galactic absorption plus an intrinsic
warm absorber (absori model in XSPEC).
The fit is acceptable (
cm-2.
A similar fit could be achieved with galactic absorption plus an intrinsic
warm absorber (absori model in XSPEC).
The fit is acceptable (
 d.o.f.) with
 .
The column density of the warm
absorber
.
The column density of the warm
absorber
 cm-2is rather ill determined.
To investigate the presence of a Gaussian line around 5 keV
(17 keV in the quasar rest frame) claimed
by Yaqoob et al.(1999) from an ASCA observation,
we restricted our analysis to the hard energy band (2-8 keV).
We fitted a power law with galactic absorption
and an additional narrow (
 keV) Gaussian line.
The result for the fit is given in Table 3.
The equivalent width of this narrow line would be about 12 eV
in the quasar's rest frame,
much below the 300 eV claimed by Yaqoob et al.(1999).
Leaving the width of the line free in the fit resulted as well in
a narrow line with nearly identical parameters and large errors.
We further tried a power law fit with inclusion of
an absorption edge at 5 keV and obtained an equally
acceptable fit (see Table 3).
keV) Gaussian line.
The result for the fit is given in Table 3.
The equivalent width of this narrow line would be about 12 eV
in the quasar's rest frame,
much below the 300 eV claimed by Yaqoob et al.(1999).
Leaving the width of the line free in the fit resulted as well in
a narrow line with nearly identical parameters and large errors.
We further tried a power law fit with inclusion of
an absorption edge at 5 keV and obtained an equally
acceptable fit (see Table 3).
Table 3:
PN spectral fits for PKS 2149-306in the hard energy band 2-8 keV and galactic absorption.
Both, the fit with a Gaussian line and an absorption edge,
improve the
 only marginally,
the normalizations of the models are small and
not well constrained and the improvements are
statistically not significant.
We also tried to add a Gaussian line to the model of a power law plus
black body and galactic absorption, resulting in kT = 0.25 keV,
only marginally,
the normalizations of the models are small and
not well constrained and the improvements are
statistically not significant.
We also tried to add a Gaussian line to the model of a power law plus
black body and galactic absorption, resulting in kT = 0.25 keV,
 ,
a narrow line at E=4.95 keV
and
,
a narrow line at E=4.95 keV
and
 d.o.f.
Also in this case the introduction of the line
does not improve the fit significantly.
d.o.f.
Also in this case the introduction of the line
does not improve the fit significantly.
From the simple power law fit with free
in the whole energy
band we obtain a 2-10 keV flux and luminosity of
 erg cm-2 s-1 and
 erg s-1, respectively.
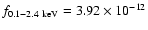
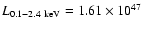
For the ROSAT band we get
erg s-1, respectively.
For the ROSAT band we get
 erg cm-2 s-1
and
erg cm-2 s-1
and
 erg s-1.
Applying the same selection criteria as for PKS 2149-306, we collected
a total of 44 300 net counts from the PN camera. We started fitting
a simple power law model in the
0.2-10.0 keV range and
obtained a photon index
 ,
an
,
an
 cm-2, in excess of the galactic value and
a
cm-2, in excess of the galactic value and
a
 d.o.f.
(see Table 4).
A single power law fit with fixed galactic absorption
is not acceptable with
d.o.f.
(see Table 4).
A single power law fit with fixed galactic absorption
is not acceptable with
 d.o.f.
A power law fit, limited to the hard energy band (
2.0-10.0 keV),
with absorption fixed to the galactic value is acceptable
(
 d.o.f.) with
 .
The extrapolation of this power law fit to lower energies
(see Fig. 3) clearly demonstrates the necessity for
more absorption at low energies.
.
The extrapolation of this power law fit to lower energies
(see Fig. 3) clearly demonstrates the necessity for
more absorption at low energies.
![\begin{figure}
\par\includegraphics[width=8.8cm,clip]{3275f3.eps}
\end{figure}](/articles/aa/full/2003/17/aa3275/Timg115.gif) |
Figure 3:
Power law fit with galactic absorption for PKS 2126-158over
the restricted energy band 2-10 keV, extrapolated to lower energies. |
| Open with DEXTER |
The fit further indicates that, although excellent power law fits
can be achieved, there might be spectral deviations from this
simple model.
As an indication for this we notice, that
the same fit, limited to the hard energy band (
3.0-10.0 keV),
with fixed galactic absorption is acceptable
(
 d.o.f.) with a different slope
of
d.o.f.) with a different slope
of
 .
.
Fitting a power law over the whole energy band, fixing the galactic absorption
and allowing for extra absorption at the redshift of the source,
gives a good fit (
 d.o.f.) with extra
 cm-2 and
 .
Allowing the redshift of the absorber to vary results in a value
in agreement with the redshift of the quasar.
We checked if a warm absorber could be responsible for the
extra absorption, performing a fit with the absori model.
The ratios between the data and the model of the resulting fit are
shown in the lower panel of Fig. 4 with extra
.
Allowing the redshift of the absorber to vary results in a value
in agreement with the redshift of the quasar.
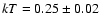
We checked if a warm absorber could be responsible for the
extra absorption, performing a fit with the absori model.
The ratios between the data and the model of the resulting fit are
shown in the lower panel of Fig. 4 with extra
 cm-2 at the redshift of the
source,
,
the absorber temperature fixed
at
cm-2 at the redshift of the
source,
,
the absorber temperature fixed
at
 K and
K and
 d.o.f.
However, the ionization parameter is not well
constrained and the fit is statistically equivalent to the
one with a neutral absorber at the source's redshift.
d.o.f.
However, the ionization parameter is not well
constrained and the fit is statistically equivalent to the
one with a neutral absorber at the source's redshift.
Table 4:
Results for power law fits for PKS 2126-158.
The results of the power law fits for the MOS data are shown
in Table 4.
As in the case of PKS 2149-306the fits are systematically worse than
those for the PN, with significantly flatter slopes
and larger s. Apart from these differences, the MOS
data show evidence for excess absorption in PKS 2126-158as well.
A simple power law fit with excess absorption doesn't
provide a good description of the spectrum and
the remaining residuals indicate
a more complicated structure, but the photon statistics
of the MOS data are insufficient for a more detailed modeling.
Fitting the same models to the RGS data gives results consistent
with those obtained for the PN, but with flatter slopes
and lower excess absorption
(
 cm-2 for RGS1,
 cm-2 for RGS2,
 cm-2
for the combined fit).
The residuals show an excess of emission around 1.7 keV
which we further tried to model with a Gaussian line with fixed
energy (E=1.72 keV) and width (
cm-2
for the combined fit).
The residuals show an excess of emission around 1.7 keV
which we further tried to model with a Gaussian line with fixed
energy (E=1.72 keV) and width (
 keV),
with equivalent widths of 129 eV for the RGS1 and 67 eV for the RGS2.
This allowed us to recover values of the parameters similar
to the PN case both
for the absorption (
keV),
with equivalent widths of 129 eV for the RGS1 and 67 eV for the RGS2.
This allowed us to recover values of the parameters similar
to the PN case both
for the absorption (
 cm-2) and
the power law slope (
cm-2) and
the power law slope (
 ).
However, the rest frame energy of the line would be
7.3 keV, not immediately recognizable as any known feature.
).
However, the rest frame energy of the line would be
7.3 keV, not immediately recognizable as any known feature.
We tried additional models relying again on the PN data alone.
An ionized disk model yielded
acceptable results with the following best fit parameters:
 cm-2, ionization parameter
 ,
,
 ,
reflection fraction R=0.11,
redshift z=3.262 (consistent with the source's redshift)
and
,
reflection fraction R=0.11,
redshift z=3.262 (consistent with the source's redshift)
and
 d.o.f.
But the errors on the parameters are large so that this
fit is not reliable.
d.o.f.
But the errors on the parameters are large so that this
fit is not reliable.
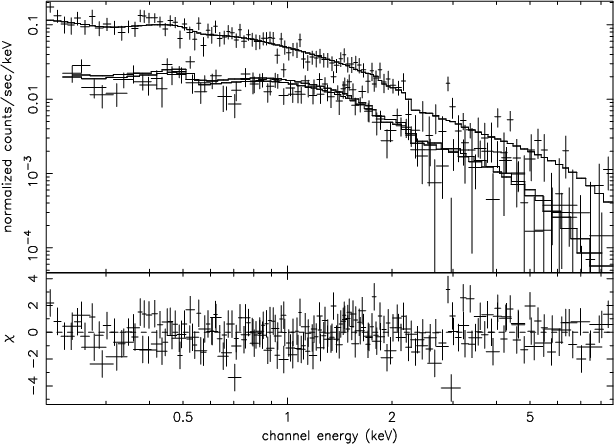
![\begin{figure}
\par\includegraphics[width=8.8cm,clip]{3275f4.eps}
\end{figure}](/articles/aa/full/2003/17/aa3275/Timg160.gif) |
Figure 4:
Power law fit with free absorption to the PN data for PKS 2126-158
(upper and middle panel). The lower panel shows the ratios between
data and model for the warm absorber fit with galactic absorption
to the PN data. |
| Open with DEXTER |
A thermal bremsstrahlung model with free
gives a slightly worse
fit than the power law (
 d.o.f.),
whereas a broken power law fit results in very low values
of the soft photon index (
d.o.f.),
whereas a broken power law fit results in very low values
of the soft photon index (
 for free )
and huge errors.
for free )
and huge errors.
Using the results from the simple power law fit with free absorption
in the whole energy band we obtain the following fluxes and
luminosities:
 erg cm-2 s-1,
 erg s-1,
 erg cm-2 s-1 and
 erg s-1.
From the 40 ksec observation
we collected only 1400 net source counts from the PN camera.
We tried simple power law fits in the whole energy band
for the PN and MOS cameras separately.
In all three cases the fitted
was consistent with the galactic
value, so we fixed it to reduce the number of fit parameters.
The resulting photon indices are given in Table 5.
As they are consistent with each other within the errors, we combined
the PN and MOS spectra to improve the statistics. A simple power law
fit with galactic absorption yielded a photon index
 and
and
 d.o.f. (see Fig. 5).
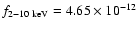
No Fe line (expected at 1.2 keV in the observer's frame) is required
by the data. Thus, a simple power law with galactic absorption seems to be
a sufficient model to describe the data.
Some deviations are visible in the residuals at 0.9 keV, which
we tried to model with a broad Gaussian line, however the line's
parameters are not well constrained. The photon counts are insufficient
to model this feature.
d.o.f. (see Fig. 5).
No Fe line (expected at 1.2 keV in the observer's frame) is required
by the data. Thus, a simple power law with galactic absorption seems to be
a sufficient model to describe the data.
Some deviations are visible in the residuals at 0.9 keV, which
we tried to model with a broad Gaussian line, however the line's
parameters are not well constrained. The photon counts are insufficient
to model this feature.
With the above parameters for the PN fits we obtain a 2-10 keV flux of
 erg cm-2 s-1 which results in a luminosity of
 erg s-1
of the source. In the ROSAT band we get
erg s-1
of the source. In the ROSAT band we get
 erg cm-2 s-1 and
 erg s-1, consistent with the
values found by Bechtold et al. (1994a) and Kaspi et al. (2000) within
the errors.
erg s-1, consistent with the
values found by Bechtold et al. (1994a) and Kaspi et al. (2000) within
the errors.
Table 5:
Results for power law fits and galactic
absorption (
 cm-2) for Q 0000-263
in the energy band 0.2-9.0 keV.
cm-2) for Q 0000-263
in the energy band 0.2-9.0 keV.
 |
Figure 5:
Combined PN+MOS power law fit with galactic absorption
for Q 0000-263in the 0.2 - 9 keV energy range. The lower panel gives the
 per channel.
 |
| Open with DEXTER |
A total of 3800 net counts were collected for the source in the
PN camera. Again, we first tried simple power
law fits for the PN and MOS instruments separately, which resulted
in absorption column densities
consistent with the galactic value. We therefore fixed
the
to the galactic value and obtained the results
given in Table 6.
The fit to the very noisy MOS1 data gave a high
,
in contrast to the
fit for the MOS2 camera. The MOS1 data could also be responsible for the high
of the combined PN + MOS fit
(see Fig. 6). All fits indicate
that a power law describes the spectrum of the source quite well
and that no excess absorption is required. The MOS data, but not the PN data,
seem to require an extra emission component at 1.5 keV,
which we tried to model as a broad Gaussian line.
From the fit of the co-added MOS1 and MOS2 data we obtained a line
energy
 keV; however the line width is not constrained
and the fit doesn't improve significantly after the addition of the line.
The low quality of the MOS data and the small number of counts argue against
the real presence of this feature. The addition of the PN data leads to
a shift of the free fitted line center to an energy
below 0.2 keV, with large errors on both the
energy of the line and its width.
We note that a redshifted Fe line would be expected at
1.7 keV, where no feature is observed.
keV; however the line width is not constrained
and the fit doesn't improve significantly after the addition of the line.
The low quality of the MOS data and the small number of counts argue against
the real presence of this feature. The addition of the PN data leads to
a shift of the free fitted line center to an energy
below 0.2 keV, with large errors on both the
energy of the line and its width.
We note that a redshifted Fe line would be expected at
1.7 keV, where no feature is observed.
The 2-10 keV flux and luminosity resulting from the PN fit are
 erg cm-2 s-1 and
 erg s-1, respectively.
For the ROSAT band
they are
erg s-1, respectively.
For the ROSAT band
they are
 erg cm-2 s-1 and
 erg s-1, consistent
inside the errors with no flux variations between the ROSAT
(Reimers et al. 1995)
and XMM
observations ten years apart.
erg s-1, consistent
inside the errors with no flux variations between the ROSAT
(Reimers et al. 1995)
and XMM
observations ten years apart.
Table 6:
Results for power law fits and galactic
absorption (
 cm-2) for Q 1442+2931
in the energy band 0.2-9.0 keV.
cm-2) for Q 1442+2931
in the energy band 0.2-9.0 keV.
 |
Figure 6:
Combined PN+MOS power law fit with galactic absorption
for Q 1442+2931in the 0.2 - 9 keV energy range. The lower panel gives the
per channel. |
| Open with DEXTER |
We have presented the results of detailed spectral analysis of two high-z,
very luminous, radio-loud quasars and two high-z radio-quiet quasars.
XMM's high sensitivity and wide energy band allowed a reliable determination of
the quasars' spectra over a source intrinsic energy band up to 50 keV
and to address the question of intrinsic absorption in the objects.
A simple power law with a slope of
 provides a
reasonably good fit to the data from PKS 2149-306,
with absorption near the galactic value. However, the fact that MOS and PN
data yield different slopes, that fits over restricted energy ranges
for the same instrument yield slightly different power law
indices, and that the residuals show some "systematic''
variations indicates, that a simple power law is perhaps not the best
description for the spectrum.
But the deviations from a straight power law are small and statistically
only separable by increasing the signal to noise ratio in a longer
observation.
provides a
reasonably good fit to the data from PKS 2149-306,
with absorption near the galactic value. However, the fact that MOS and PN
data yield different slopes, that fits over restricted energy ranges
for the same instrument yield slightly different power law
indices, and that the residuals show some "systematic''
variations indicates, that a simple power law is perhaps not the best
description for the spectrum.
But the deviations from a straight power law are small and statistically
only separable by increasing the signal to noise ratio in a longer
observation.
Depending on the models fitted to the data the results for the absorption
column density change slightly. Adding a small black body component
with
 keV, which might be a reflection component in the
rest frame of the source, to the power law gives an acceptable fit with
galactic absorption.
Another interesting possibility could be that we are seeing the soft
X-ray bump, never observed up to now, produced in blazars
by the Comptonization of external UV radiation by electrons in the jet
(Sikora et al. 1997).
keV, which might be a reflection component in the
rest frame of the source, to the power law gives an acceptable fit with
galactic absorption.
Another interesting possibility could be that we are seeing the soft
X-ray bump, never observed up to now, produced in blazars
by the Comptonization of external UV radiation by electrons in the jet
(Sikora et al. 1997).
Source intrinsic, extra warm or cold absorption models predict
a column density
of 1021 cm-2 in the rest frame of the source.
Considering the quality of the available data we conclude, however, that
there is no strong evidence for substantial absorption in excess of
the galactic value towards PKS 2149-306.
The source was previously observed by ROSAT and ASCA (Siebert et al.1996;
Cappi et al.1997), BeppoSAX (Elvis et al.2000), and Chandra (Fang et al.2001).
A comparison between the different instruments indicates spectral and
flux variability. The ASCA power law slopes are comparable
to ours and the spectra show indications of excess absorption of a
few times 1020 cm-2. BeppoSAX claims a broken power law with
a similar flat slope and soft excess emission below 0.8 keV,
while the Chandra spectra are in agreement
with galactic absorption, and a very flat power law slope
(
 ).
The 2-10 keV flux measured in October 1994
by ASCA is about 30% higher than that obtained by Chandra, BeppoSAX (in 1997),
and XMM (
).
The 2-10 keV flux measured in October 1994
by ASCA is about 30% higher than that obtained by Chandra, BeppoSAX (in 1997),
and XMM (
 erg cm-2 s-1).
The RASS flux in 1990/91 seems to have been a factor of two lower
(Schartel et al.1996). However, the rather uncertain spectral slope
makes an exact comparison problematic.
erg cm-2 s-1).
The RASS flux in 1990/91 seems to have been a factor of two lower
(Schartel et al.1996). However, the rather uncertain spectral slope
makes an exact comparison problematic.
In none of the recent observations (BeppoSAX, Chandra, and XMM-Newton)
the claimed detection of a line at 5 keV could be confirmed,
nor is there evidence for line emission at other energies.
PKS 2126-158 clearly shows the presence of extra absorption of the order
of
 cm-2.
At the redshift of the source this corresponds to
cm-2.
At the redshift of the source this corresponds to
 cm-2 and a power law
model with galactic absorption plus an intrinsic cold or a
warm absorber, results in excellent fits.
cm-2 and a power law
model with galactic absorption plus an intrinsic cold or a
warm absorber, results in excellent fits.
The object has been observed four times between 1991-1993 with the
ROSAT PSPC (Elvis et al.1994b; Cappi et al.1997) and in 1993 by ASCA
(Cappi et al.1997). For all observations the fitted power law slopes
and the values
of excess absorption are consistent with our results inside the errors
with no indications of temporal variations.
The measured fluxes, even from the early Einstein IPC observation
(Worrall & Wilkes 1990) are identical inside the statistical
uncertainties,
 erg cm-2 s-1.
The constancy of this flux level is relatively unusual for such a
bright radio-loud quasar.
erg cm-2 s-1.
The constancy of this flux level is relatively unusual for such a
bright radio-loud quasar.
4.1.1 X-ray and broad band spectral properties
The power law fits with free absorption in the whole energy band
yielded for both quasars a slope
.
This value is typical of
those from Einstein observations (Wilkes & Elvis 1987)
but is at the lower limit of the range commonly found
for radio-loud quasars from ROSAT and ASCA observations
(Brinkmann et al. 1997; Reeves & Turner 2000).
Similar flat slopes for PKS 2149-306and PKS 2126-158were reported from previous
ASCA and ROSAT
observations (Elvis et al. 1994b; Cappi et al. 1997; Siebert et al. 1996)
and in a Chandra observation Fang et al. (2001) found an even
flatter slope for PKS 2149-306.
In the frame of the two-emission components model
an explanation would be that the emission is dominated by
the beamed, flat blazar-like component.
The high X-ray luminosities of the
two objects (
 erg s-1 and
 erg s-1 for PKS 2126-158and PKS 2149-306,
respectively) would be in accordance with this hypothesis.
In the case of PKS 2126-158we also find indication of beaming in the
extremely high radiative efficiency ()
of accretion onto
a black hole exceeding the maximum theoretical value.
erg s-1 for PKS 2126-158and PKS 2149-306,
respectively) would be in accordance with this hypothesis.
In the case of PKS 2126-158we also find indication of beaming in the
extremely high radiative efficiency ()
of accretion onto
a black hole exceeding the maximum theoretical value.
In order to get more insight into the properties of our sources
we calculated the broad band spectral indices
between 5 GHz, 2500 Å and 2 keV, which are
good indicators of the SED's shape.
The values we obtained are
 ,
,
 ,
,
 for PKS 2126-158, and
 ,
,
,
,
 for PKS 2149-306.
Considering the uncertainty on the X-ray fluxes (
for PKS 2149-306.
Considering the uncertainty on the X-ray fluxes ( 30%)
resulting from
the errors of the spectral fit parameters we estimate a typical
error for the
and
30%)
resulting from
the errors of the spectral fit parameters we estimate a typical
error for the
and
 of the order of
5%.
Padovani et al. (2002) recently studied a sample
of FSRQ characterized by a synchrotron peak at X-ray energies in the
same way as HBL BL Lacs. We checked if our sources could
belong to this class and thus explain their X-ray loudness.
However, the above values of the broad band spectral indices place
our sources in the "normal'' FSRQ region (see Fig. 1 of Padovani et al.
2002),
pointing at an inverse Compton origin for the X-ray emission from the
sources.
Indeed, PKS 2149-306is known to have a blazar-like SED (Elvis et al. 2000)
with the synchrotron peak at 0.3 mm and the inverse Compton
peak at 4 MeV, providing strong support to its FSRQ classification.
of the order of
5%.
Padovani et al. (2002) recently studied a sample
of FSRQ characterized by a synchrotron peak at X-ray energies in the
same way as HBL BL Lacs. We checked if our sources could
belong to this class and thus explain their X-ray loudness.
However, the above values of the broad band spectral indices place
our sources in the "normal'' FSRQ region (see Fig. 1 of Padovani et al.
2002),
pointing at an inverse Compton origin for the X-ray emission from the
sources.
Indeed, PKS 2149-306is known to have a blazar-like SED (Elvis et al. 2000)
with the synchrotron peak at 0.3 mm and the inverse Compton
peak at 4 MeV, providing strong support to its FSRQ classification.
On the other hand, PKS 2126-158is known to be a GPS source (de Vries et al. 1997;
Stanghellini et al. 1998). These powerful radio sources are characterized
by extreme compactness (1 kpc), low polarization and a convex
spectrum at radio frequencies with a turn-over between 500 MHz
and 10 GHz. This characteristic shape of the spectrum
is commonly interpreted in terms of synchrotron self-absorption
(O' Dea 1998).
Due to their double-lobed radio morphologies, GPS
sources are thought to be lying in the plane of the sky, so that beaming
shouldn't play any role. This makes the tentative classification
of PKS 2126-158as a FSRQ rather problematic as already discussed by
Elvis et al. (1994b). However, new VLBA observations of
several GPS sources (Lister et al. 2002) revealed some atypical features
for this class of objects,
like core-jet structures, super-luminal motion, variability and
polarization and this, together with the radiative efficiency
argument (see above),
suggest relativistic
beaming at least for some of the GPS sources.
Moreover, these properties seem to agree better
with a free-free absorption model from a surrounding ionized medium
than with the synchrotron absorption model (Lister et al. 2002).
Interestingly, this absorbing medium could also account for the extra
absorption we detect in PKS 2126-158(see below).
Although excess absorption was previously reported (Cappi et al. 1997;
Siebert et al. 1996) for PKS 2149-306, we find no strong evidence for
extra absorption for this source.
Depending on the assumed spectral form the fits predict absorbing
column densities ranging from the galactic value to an additional
source intrinsic value of
 cm-2in case of a single power law fit over the whole energy range.
As the residuals of the fits indicate a more complex spectral
form than a simple power law the existence of any strong extra absorption must be
regarded as uncertain.
cm-2in case of a single power law fit over the whole energy range.
As the residuals of the fits indicate a more complex spectral
form than a simple power law the existence of any strong extra absorption must be
regarded as uncertain.
For PKS 2126-158we find additional absorption of
 cm-2 in excess of the galactic value.
For this object extra absorption has been claimed before from ASCA
and ROSAT observations (Elvis et al. 1994; Serlemitsos et al. 1994;
Cappi et al. 1997; Reeves & Turner 2000). Their results are in
agreement with ours.
cm-2 in excess of the galactic value.
For this object extra absorption has been claimed before from ASCA
and ROSAT observations (Elvis et al. 1994; Serlemitsos et al. 1994;
Cappi et al. 1997; Reeves & Turner 2000). Their results are in
agreement with ours.
The absence of extra absorption in PKS 2149-306argues against its ubiquity in
high redshift quasars (Yuan & Brinkmann 1998).
On the other hand, the presence of extra
absorption in PKS 2126-158rises the question of the location of the
absorbing material. In fact, our fits are compatible with an absorber
at the redshift of the source, but other redshifts are equally
allowed by the data, so that this issue remains open.
A galactic origin of the extra absorption by means of molecular
clouds and dust has been excluded for this source by local CO
surveys and IRAS measurements (Cappi et al. 1997).
The absorption could then be due to intervening matter along the
line of sight. Damped Ly
systems with column densities
of the order of
1020-1021 cm-2 or intervening
galaxies could provide the necessary amount of absorption.
However, no damped Ly
systems have been detected in the
optical spectrum of PKS 2126-158, but only the Ly
forest
(Giallongo et al. 1993) with much lower column densities
(
 cm-2), which cannot account
for the observed absorption. Moreover, some absorption variability
seems to be present in PKS 2126-158, not explicable by damped Lysystems, which are believed to be stable over long time scales.
cm-2), which cannot account
for the observed absorption. Moreover, some absorption variability
seems to be present in PKS 2126-158, not explicable by damped Lysystems, which are believed to be stable over long time scales.
It thus seems likely that the absorber is at the quasar's position.
Then a possible site for the absorber could be the torus invoked in the unified
model for AGNs or, allowing for variable absorption, dusty clouds.
A further alternative could be a cooling flow in a cluster of galaxies.
As PKS 2126-158is classified as a GPS source, an interesting possibility is that
the proposed ionized medium (Lister et al. 2002) responsible for
the GPS phenomenon through free-free absorption, could be
the same absorbing medium we detect in the X-ray band.
Our data do not allow to distinguish between a cold, neutral and a warm,
ionized absorber as we cannot see in the spectrum the
typical features of a warm absorber, i.e. the OVII and OVIII edges
at 0.7-1.0 keV and an extra emission component below 0.7
keV in the rest frame; these energies are redshifted below
0.2 keV, outside the XMM band.
However, if the absorbing matter can be related to the Ly
clouds along the line of sight the temperature of the
gas as determined from high resolution optical observations
(D'Odorico et al. 1998) is around
 K.
The findings of Brinkmann et al. (1997) that the majority of the
high redshift objects in their sample are GPS sources
and that they show excess
absorption further supports the connection between the X-ray absorber and
the conceivable free-free absorber of Lister et al. (2002).
K.
The findings of Brinkmann et al. (1997) that the majority of the
high redshift objects in their sample are GPS sources
and that they show excess
absorption further supports the connection between the X-ray absorber and
the conceivable free-free absorber of Lister et al. (2002).
Table 7:
Summary of source properties.
A simple power law fit to the combined PN + MOS data of Q 0000-263
gives a statistically acceptable representation of the spectrum and
no absorption in excess of the galactic is found.
Unfortunately, the available number of photons is insufficient for
a more complex modeling of the remaining residuals.
Our findings are consistent with those from previous ROSAT observations
within the errors. We obtain from the combined PN+MOS fit a photon index of
,
whereas Bechtold et al. (1994) find for the 0.1-2.4 keV band a spectral index
 and galactic absorption.
From this fit they deduced a broad spectral index
and galactic absorption.
From this fit they deduced a broad spectral index
 whereas we find a slightly different value
 .
Kaspi et al. (2000) give a broad spectral index
.
The errors on the
have been estimated
to be 5% as in Sect. 4.1.1.
The discrepancies in these values can be explained by the
different spectral slopes used in the
calculations and the restricted ROSAT energy range compared to XMM.
.
Kaspi et al. (2000) give a broad spectral index
.
The errors on the
have been estimated
to be 5% as in Sect. 4.1.1.
The discrepancies in these values can be explained by the
different spectral slopes used in the
calculations and the restricted ROSAT energy range compared to XMM.
Similar results hold for Q 1442+2931, for which an acceptable fit is again
provided by a simple power law and galactic absorption. The power law
slope for the combined PN+MOS fit is
 .
Due to the low number of counts no spectral analysis of ROSAT observations
could be performed by Reimers et al. (1995) for a
comparison with our results but the deduced fluxes are consistent
inside their errors. For this quasar we obtain a broad spectral
index
.
Due to the low number of counts no spectral analysis of ROSAT observations
could be performed by Reimers et al. (1995) for a
comparison with our results but the deduced fluxes are consistent
inside their errors. For this quasar we obtain a broad spectral
index
 .
.
The power law slopes we get for the two high redshift
radio-quiet quasars are in agreement
with the typical values found at low redshifts (Yuan et al. 1998a),
suggesting the absence of spectral evolution for this class of AGN
and the presence of a constant spectral form over a wide band width.
Further, the slopes are also considerably steeper than those of the two radio-loud
quasars of our sample, supporting the spectral dependence
on the radio-loud/radio-quiet classification observed
at low redshifts (Brinkmann et al. 1997; Yuan et al. 1998a).
The
for these two high redshift quasars are consistent
with values found in previous studies for z>2 and
they are larger than the average values found at z<0.2 (Yuan et al. 1998a).
This indicates that high redshift radio-quiet quasars are more X-ray quiet
than their low-redshift counterparts. However, it is found
(Avni & Tananbaum 1982; Avni & Tananbaum 1986; Wilkes et al. 1994;
Yuan et al. 1998a)
that the X-ray loudness is independent of redshift and that instead a
correlation is present between
and log  ,
where is the luminosity at 2500 Å. Thus the larger
would arise from a higher
at high redshift for these
optically selected quasars.
From the broad spectral indices it is also inferred
that radio-loud quasars are X-ray louder than radio-quiet quasars
at high redshifts (Brinkmann et al. 1997) as well as
at low redshifts (Zamorani et al. 1981). This is supported
by our data, suggesting that an additional component contributes to
the X-ray emission in radio-loud quasars and that radio-quiet and radio-loud
quasars have distinct physical emission mechanisms.
However the "X-ray quietness'' of radio-quiet quasars makes a detailed
spectral analysis rather difficult, and the small number of well
studied radio-quiet high-z quasars make definite conclusions rather
uncertain.
,
where is the luminosity at 2500 Å. Thus the larger
would arise from a higher
at high redshift for these
optically selected quasars.
From the broad spectral indices it is also inferred
that radio-loud quasars are X-ray louder than radio-quiet quasars
at high redshifts (Brinkmann et al. 1997) as well as
at low redshifts (Zamorani et al. 1981). This is supported
by our data, suggesting that an additional component contributes to
the X-ray emission in radio-loud quasars and that radio-quiet and radio-loud
quasars have distinct physical emission mechanisms.
However the "X-ray quietness'' of radio-quiet quasars makes a detailed
spectral analysis rather difficult, and the small number of well
studied radio-quiet high-z quasars make definite conclusions rather
uncertain.
No excess absorption has been found in the radio-quiet objects
confirming that this property is common only in the
high redshift, radio-loud quasars, even if not ubiquitous.
A larger sample of high redshift radio-quiet quasars is needed
to study this issue properly.
As already mentioned for PKS 2126-158, damped Ly
systems
have been discussed as possible X-rays absorbers for radio-loud
high redshift quasars.
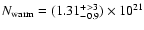
Since its discovery Q 0000-263is known to have a damped Ly
system
lying along its line of sight at z=3.39 with
 cm-2 (Levshakov et al. 2000).
We added the above fixed amount of absorbing material at the
Ly
system's redshift to the power law fit of Q 0000-263and could not
find any statistically significant differences in the fit parameters
from a fit with galactic absorption only. The main differences in the two models
occur at lowest energies (0.3 keV) where the PN is not sensitive
enough. As the count rates for Q 0000-263are quite low, especially for the RGS,
this means
that the data are insufficient to determine
the amount of absorbing material at high redshift for this source.
cm-2 (Levshakov et al. 2000).
We added the above fixed amount of absorbing material at the
Ly
system's redshift to the power law fit of Q 0000-263and could not
find any statistically significant differences in the fit parameters
from a fit with galactic absorption only. The main differences in the two models
occur at lowest energies (0.3 keV) where the PN is not sensitive
enough. As the count rates for Q 0000-263are quite low, especially for the RGS,
this means
that the data are insufficient to determine
the amount of absorbing material at high redshift for this source.
A brief summary of source properties and results of the spectral analyses are
given in Table 7.
Please note that we give, for a comparison, the power
law slope for the PN fit with free absorption; the resulting
,
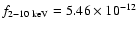
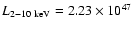
given in the last column, indicates the quality of the fit.
A simple power law fit for PKS 2149-306 with
and
 cm-2, slightly in excess of the
galactic value, provides an acceptable description of the data
in the 0.2-10 keV energy band.
Allowing for extra cold or warm absorption at the redshift of the
source results
in equally acceptable fits with an identical slope and
cm-2, slightly in excess of the
galactic value, provides an acceptable description of the data
in the 0.2-10 keV energy band.
Allowing for extra cold or warm absorption at the redshift of the
source results
in equally acceptable fits with an identical slope and
 cm-2. However the
 is
ill-determined and other redshifts of the absorber are compatible
with the data.
With the high signal to noise ratio from the EPIC data there is evidence
for substantial deviations
from a simple power law, such as a slightly curved shape of the
residuals at soft energies, which can be modeled as a black body component
with
keV, different power law slopes when different
energy ranges are used for the fits, and the flatter slopes found from
the MOS fit. We conclude that there is no strong evidence for extra absorption
for this quasar.
The addition of a narrow line at 5 keV as claimed by Yaqoob et al.
(1995) with a rest frame equivalent width of 12 eV is not significant.
Only a further improved signal to noise ratio would allow
to separate different components in the spectrum.
is
ill-determined and other redshifts of the absorber are compatible
with the data.
With the high signal to noise ratio from the EPIC data there is evidence
for substantial deviations
from a simple power law, such as a slightly curved shape of the
residuals at soft energies, which can be modeled as a black body component
with
keV, different power law slopes when different
energy ranges are used for the fits, and the flatter slopes found from
the MOS fit. We conclude that there is no strong evidence for extra absorption
for this quasar.
The addition of a narrow line at 5 keV as claimed by Yaqoob et al.
(1995) with a rest frame equivalent width of 12 eV is not significant.
Only a further improved signal to noise ratio would allow
to separate different components in the spectrum.
For PKS 2126-158extra absorption was found with
cm-2 and a power law slope of
 .
In fits with extra absorption in the source frame,
either neutral or through a warm absorber, values of
.
In fits with extra absorption in the source frame,
either neutral or through a warm absorber, values of
 cm-2 and
 were found. However the redshift of the absorbing
medium is poorly constrained. Further, deviations from the
simple power law which cannot be modeled properly due to
the still insufficient number of detected photons, seem to be present.
A higher signal to noise ratio is needed, both to study
the presence of the various spectral components and to determine
the redshift of the absorber.
were found. However the redshift of the absorbing
medium is poorly constrained. Further, deviations from the
simple power law which cannot be modeled properly due to
the still insufficient number of detected photons, seem to be present.
A higher signal to noise ratio is needed, both to study
the presence of the various spectral components and to determine
the redshift of the absorber.
Both radio-loud quasars have high 2-10 keV luminosities of
the order of 1047 erg s-1 and they are X-ray loud
with
 .
The X-ray emission of PKS 2149-306is dominated by
a beamed, flat blazar-like component produced by inverse
Compton scattering; the shape of the SED similar to that of
a blazar confirms this view.
.
The X-ray emission of PKS 2149-306is dominated by
a beamed, flat blazar-like component produced by inverse
Compton scattering; the shape of the SED similar to that of
a blazar confirms this view.
PKS 2126-158is a GPS source and the absorber we detect in X-rays
might be the same as that assumed
in the free-free absorption model for GPS sources (O' Dea 1998;
Lister et al. 2002).
From its spectral properties, PKS 2126-158seems
to have blazar-like characteristics similar to those of
PKS 2149-306, apparently in contrast with
being a GPS source, with a jet oriented at a large angle
to the line of sight. However, some GPS sources exist which
show signs of relativistic beaming as typically found in blazars
(Lister et al. 2002).
For both radio-quiet objects a simple power law with
and
galactic absorption gives a good description of the data.
The power law slopes we found are consistent with typical values
at low redshifts.
No iron lines have been detected.
The 2-10 keV luminosities are of the order of
1045 erg s-1, much lower than for their radio-loud
counterparts. The
of about 1.7 are
considerably larger than for the two radio-loud quasars.
Being much X-ray weaker
than radio-loud quasars, the low signal to noise ratios inhibit the
detection of possible deviations from a simple power law slope.
The two radio-loud objects are found in the upper - left
region of the
 diagram, slightly
offset from the average of the low-z radio-loud quasars,
similar to the z>4 quasars of Fabian et al. (1999).
They are thus X-ray brighter than their low-z counterparts and
follow the
-
relation of radio-loud quasars
(Brinkmann et al. 1997).
The two radio-quiet objects are significantly more X-ray quiet
than those at low redshifts and their
and their
spectral power law slopes are nicely in line with the
redshift dependence of these objects (Bechtold et al. 2002).
diagram, slightly
offset from the average of the low-z radio-loud quasars,
similar to the z>4 quasars of Fabian et al. (1999).
They are thus X-ray brighter than their low-z counterparts and
follow the
-
relation of radio-loud quasars
(Brinkmann et al. 1997).
The two radio-quiet objects are significantly more X-ray quiet
than those at low redshifts and their
and their
spectral power law slopes are nicely in line with the
redshift dependence of these objects (Bechtold et al. 2002).
Overall, our sources follow the general trends observed for other
high-z quasars.
However, in contrast to previous work, the spectral parameters could be
determined with much higher accuracy.
The great advantage of the XMM-Newton instruments for studies of
high redshift quasars is the large sensitivity of the instrument.
This allows not only the detection but even a spectral study of these
objects and,
in the case of more luminous sources, to study small
spectral deviations from a simple power law which are indicators
of the physical conditions governing the
emission of radiation over the wide energy band accessible
in high-z objects.
Acknowledgements
This research has made use of the NASA/IPAC Extragalactic Data Base
(NED) which is operated by the Jet Propulsion Laboratory,
California Institute of Technology, under contract with the National
Aeronautics and Space Administration.
This work is based on observations with XMM-Newton, an ESA science mission
with instruments and contributions directly funded by ESA Member States
and the USA (NASA).
- Avni, Y., & Tananbaum, H. 1982, ApJ, 262, L17
In the text
NASA ADS
- Avni, Y., & Tananbaum, H. 1986, ApJ, 305, 83
In the text
NASA ADS
- Ballantyne, D. R., Iwasawa, K., & Fabian, A. C. 2001, MNRAS, 323, 506
In the text
NASA ADS
- Bechtold, J., Elvis, M., Fiore, F., et al. 1994a, AJ, 108, 374
In the text
NASA ADS
- Bechtold, J., Siemiginowska, A.,
Shields, J., et al. 2002, Proc. of the meeting "Active Galactic Nuclei: from Central
Engine to Host Galaxy''
In the text
- Brinkmann, W., Siebert, J., Reich, W., et al. 1995,
AAS, 109, 147
In the text
- Brinkmann, W., Yuan, W., & Siebert, J. 1997, A&A, 319, 413
In the text
NASA ADS
- Boyle, B. J., Griffiths, R. E., Shanks, T., Stewart, G. C., & Georgantopoulos, I. 1993, MNRAS, 260, 49
In the text
NASA ADS
- Cappi, M., Matsuoka, M., Comastri, A., et al. 1997, ApJ, 478, 492
In the text
NASA ADS
- de Vries, W. H., O'Dea, C. P., Baum, S. A., & Barthel, P. D. 1997, A&AS, 191.2204D
In the text
- D'Odorico, V., Christiani, S., D'Odorico, S., Fontana, A., & Giallongo, E.
1998, A&AS, 127, 217
In the text
NASA ADS
- Ehle, M., Breitfellner, M., Dahlem, M., et al. 2001,
XMM-Newton Users' Handbook,
In the text
http://xmm.vilspa.esa.es/xmm_user_support/external/documentation/uhb_frame.shtml
- Elvis, M., Wilkes, B. J., McDowell, J. C.,
et al. 1994a, ApJS, 95, 1
In the text
NASA ADS
- Elvis, M., Fiore, F., Wilkes, B. J., McDowell, J., & Bechtold, J. 1994b, ApJ, 422, 60
In the text
NASA ADS
- Elvis, M., Fiore, F., Siemiginowska, A., Bechtold, J., Mathur, S., et al. 2000, ApJ, 543, 545
In the text
NASA ADS
- Fabian, A. C. 1979, Proc. R. Soc. London, Ser. A, 366, 449
In the text
- Fabian, A. C., Celotti, A., & Pooley, G. 1999, MNRAS, 308, L6
In the text
NASA ADS
- Fang, T., & Canizares, C. 2000, ApJ, 532, 539
In the text
- Fang, T., Marshall, H. L., Bryan, G. L., & Canizares, C. 2001, ApJ, 555, 536
In the text
- Ghizzardi, S., & Molendi, S. Proc. of the conference
"New Visions of the X-ray Universe'', ESTEC Nov. 2001
In the text
- Giallongo, E., Cristiani, S., Fontana, A., & Trevese, D. 1993, ApJ, 416, 137
In the text
NASA ADS
- Kaspi, S., Brandt, W. N., & Schneider, D. P. 2000, AJ, 119, 2031
In the text
NASA ADS
- Lister, M. L., Kellermann, K. I., & Pauliny-Toth, I. I. K. 2002,
Proc. of the 6th European VLBI Network Symposium on New
Developments in VLBI Science and
Technology
In the text
- Levshakov, S. A., Molaro, P., Centurion, M., et al. 2000, A&A, 361, 803
In the text
NASA ADS
- Mushotzky, R. F., Done, C., & Pounds, K. A. 1993, ARA&A, 31, 717
In the text
NASA ADS
- O'Dea, C. P. 1998, PASP, 110, 493
In the text
NASA ADS
- Padovani, P., Costamante, L., Ghisellini, G., Giommi, P.,
& Perlman, E. 2002, ApJ, 581, 895
In the text
NASA ADS
- Reimers, D., Bade, N., Schartel, N., et al. 1995, A&A, 296, L49
In the text
NASA ADS
- Reeves, J. N., & Turner, M. J. L. 2000, MNRAS, 316, 234
In the text
NASA ADS
- Sanduleak, N., & Pesch, P. 1989, PASP, 101, 1081
In the text
NASA ADS
- Schartel, N., Walter, R., Fink, H. H., & Trümper, J. 1996,
A&A, 307, 33
In the text
NASA ADS
- Schartel, N., Komossa, S., Brinkmann, W., et al. 1997, A&A, 320, 421
In the text
NASA ADS
- Serlemitsos, P., Yaqoob, T., Ricker, G., et al. 1994, PASJ, 46, L43
In the text
NASA ADS
- Siebert, J., Matsuoka, M., Brinkmann, W., et al. 1996, A&A, 307, 8
In the text
NASA ADS
- Sikora, M., Madejski, G., Moderski, R., & Poutanen, J. 1997, ApJ, 484, 108
In the text
NASA ADS
- Stanghellini, C., O'Dea, C. P., Dallacasa, D., et al. 1998, A&AS, 131, 303
In the text
NASA ADS
- Wilkes, B. J., & Elvis, M. 1987, ApJ, 323, 243
In the text
NASA ADS
- Wilkes, B. J., Tananbaum, H., Worrall, D .M., Avni, et al. 1994, ApJS, 92, 53
In the text
NASA ADS
- Worrall, D. M., & Wilkes, B. J. 1990, ApJ, 360, 396
In the text
NASA ADS
- Yaqoob, T., George, I. M., Nandra, K., et al. 1999, ApJ, 525, L9
In the text
NASA ADS
- Yuan, W., Brinkmann, W., Siebert, J., & Voges, W. 1998a,
A&A, 330, 108
In the text
NASA ADS
- Yuan, W., & Brinkmann, W. 1998, in Highlights in X-ray Astronomy,
ed. B. Aschenbach, & M. J. Freyberg, MPE Report, 272, 240
In the text
- Yuan, W., Siebert, J., & Brinkmann, W. 1998b, A&A, 334, 498
In the text
NASA ADS
- Yuan, W., Matsuoka, M., Wang, T., Ueno, S., Kubo, H., et al. 2000, ApJ, 545, 625
In the text
NASA ADS
- Zamorani, G., Henry, J. P., Maccacaro, T., et al. 1981, ApJ, 245, 357
In the text
NASA ADS
Copyright ESO 2003
![\begin{figure}
\par\includegraphics[width=8.8cm,clip]{3275f1.eps}\end{figure}](/articles/aa/full/2003/17/aa3275/img35.gif)
![\begin{figure}
\par\includegraphics[width=8.8cm,clip]{aa3275f2.eps}
\end{figure}](/articles/aa/full/2003/17/aa3275/img55.gif)
![\begin{figure}
\par\includegraphics[width=8.8cm,clip]{3275f3.eps}
\end{figure}](/articles/aa/full/2003/17/aa3275/img115.gif)
![\begin{figure}
\par\includegraphics[width=8.8cm,clip]{3275f4.eps}
\end{figure}](/articles/aa/full/2003/17/aa3275/img160.gif)