A&A 401, 289-296 (2003)
DOI: 10.1051/0004-6361:20030122
S. Falter1 - U. Heber1 - S. Dreizler2 - S. L. Schuh2 - O. Cordes3 - H. Edelmann1
1 - Dr. Remeis-Sternwarte, Astronomisches Institut der Universität
Erlangen-Nürnberg, Sternwartstr. 7, 96049 Bamberg, Germany
2 -
Institut für Astronomie und Astrophysik, Universität Tübingen, Sand 1,
72076 Tübingen, Germany
3 -
Sternwarte der Universität Bonn, Auf dem Hügel 71, 53121 Bonn, Germany
Received 11 December 2002 / Accepted 15 January 2003
Abstract
We present time-series spectroscopy and multi-band photometry of the sdBV
PG 1605+072 carried out simultaneously at the Calar Alto 2.2-m and 3.5-m
telescopes. The periodogram analysis of the radial velocity curves reveals three
frequencies at 2.078, 2.756, and 1.985 mHz for
![]() and at 2.076,
2.753, and 1.978 mHz for
and at 2.076,
2.753, and 1.978 mHz for
![]() .
The corresponding radial velocity
amplitudes are 12.7, 8.0, and 7.9 km s-1 for
.
The corresponding radial velocity
amplitudes are 12.7, 8.0, and 7.9 km s-1 for
![]() and 14.3,
6.5, and 7.2 km s-1 for
and 14.3,
6.5, and 7.2 km s-1 for
![]() .
Furthermore, we found five
frequencies that are present in all wavelength bands of the BUSCA photometer.
The frequencies detected in the radial velocity curves are recovered by the
photometric measurements. Moreover, additional frequencies were present in the
periodograms which could not be identified in all four bands simultaneously. The
comparison of the amplitudes presented here with previous results from radial
velocity and photometric observations of PG 1605+072 shows a significant
change or even switch in the power of the modes within short time scales, i.e.
about one year. No changes in frequency were registered and the phases of
the modes show no wavelength dependency within our multi-band photometry.
.
Furthermore, we found five
frequencies that are present in all wavelength bands of the BUSCA photometer.
The frequencies detected in the radial velocity curves are recovered by the
photometric measurements. Moreover, additional frequencies were present in the
periodograms which could not be identified in all four bands simultaneously. The
comparison of the amplitudes presented here with previous results from radial
velocity and photometric observations of PG 1605+072 shows a significant
change or even switch in the power of the modes within short time scales, i.e.
about one year. No changes in frequency were registered and the phases of
the modes show no wavelength dependency within our multi-band photometry.
Key words: stars: subdwarfs - stars: oscillations - stars: horizontal branch - stars: individual: PG 1605+072
It is generally accepted that sdB stars can be identified with models of the extended Horizontal Branch (EHB) burning He in their core (Heber 1986; Saffer et al. 1994). The hydrogen envelope surrounding the core of about half a solar mass is very thin (<2 % by mass) and therefore inert. These EHB stars will continue their evolution directly towards the white dwarf graveyard avoiding the AGB and planetary nebula phases (Dorman et al. 1993).
How sdB stars evolve towards the EHB with effective temperatures of up to
40 000 K remains a puzzle. The star must have lost all but a tiny fraction of
the hydrogen envelope at the same time as the He core has attained the minimum
mass (![]() 0.5
0.5 ![]() )
required for the He flash. This challenges every
mass loss mechanism in aspects of timing and effectivity. Recent findings
(Maxted et al. 2001; Saffer et al. 2001; Heber et al.
2002a) emphasize the significance of close binary evolution.
)
required for the He flash. This challenges every
mass loss mechanism in aspects of timing and effectivity. Recent findings
(Maxted et al. 2001; Saffer et al. 2001; Heber et al.
2002a) emphasize the significance of close binary evolution.
Some of the sdB stars were recently found to exhibit rapid multi-periodic light
variations (![]() 80-600 s) of low amplitudes (a few mmag). They form
a new class of pulsating stars named after the prototype EC 14026 stars
80-600 s) of low amplitudes (a few mmag). They form
a new class of pulsating stars named after the prototype EC 14026 stars![]() (Kilkenny et al. 1997). Since then a relatively large number of new sdB pulsators
has been discovered. 31 are known today (Charpinet 2001; Piccioni et al. 2000; Silvotti et al. 2000). The
observed brightness variations are caused by radial and non-radial, low degree
and low order acoustic pulsation modes. The pulsations in these stars are driven
by an opacity bump due to Fe and other metallic species (Charpinet et al.
1997) at a temperature of
(Kilkenny et al. 1997). Since then a relatively large number of new sdB pulsators
has been discovered. 31 are known today (Charpinet 2001; Piccioni et al. 2000; Silvotti et al. 2000). The
observed brightness variations are caused by radial and non-radial, low degree
and low order acoustic pulsation modes. The pulsations in these stars are driven
by an opacity bump due to Fe and other metallic species (Charpinet et al.
1997) at a temperature of ![]() 2
2 ![]() 105 K in the sdB
envelope.
105 K in the sdB
envelope.
Stellar pulsations allow a direct insight into the structure of such stars and therefore into the evolutionary history. The frequencies or periods of the pulsation modes probe the chemical stratification and the mass which otherwise are difficult or even impossible to determine. The power of asteroseismological tools has been demonstrated in the field of pulsating white dwarfs for which stellar parameters like mass, luminosity or thickness of the envelope were derived (e.g. Winget et al. 1991). In the case of variable sdB stars these parameters will constrain the evolutionary history and consequently shed more light on the origin of these stars.
Identification of pulsation modes (characterized by spherical harmonics with
the indices l and m) is a prerequisite for asteroseismology. Brassard et al.
(2001) have successfully carried out an asteroseismological analysis
for PG 0014+067. For the first time they were able to determine the stellar
mass (
![]() )
as well as the envelope mass
(
)
as well as the envelope mass
(
![]() )
and both are in
excellent agreement with predictions from evolutionary models (Dorman et al.
1993).
)
and both are in
excellent agreement with predictions from evolutionary models (Dorman et al.
1993).
Pulsations produce not only photometric variations but also line profile
variations that offer an alternative approach towards mode identification.
PG 1605+072 is the ideal target for this application: it has the longest
pulsation periods (![]() 500 s) which enables spectra with reasonable S/N to be
obtained within each pulsation period. Moreover, this star has the largest
variations of all known sdBVs (0.2 mag in the optical) and by far the richest
frequency spectrum (>50 modes, Kilkenny et al. 1999). A recent
spectroscopic study revealed this star to be a rather rapid rotator
(
500 s) which enables spectra with reasonable S/N to be
obtained within each pulsation period. Moreover, this star has the largest
variations of all known sdBVs (0.2 mag in the optical) and by far the richest
frequency spectrum (>50 modes, Kilkenny et al. 1999). A recent
spectroscopic study revealed this star to be a rather rapid rotator
(
![]() km s-1, Heber et al. 1999) which will complicate the
identification of modes due to non-linear effects on mode splitting.
km s-1, Heber et al. 1999) which will complicate the
identification of modes due to non-linear effects on mode splitting.
This work presented here serves as a feasibility study in order to find out whether an asteroseismologic analysis of PG 1605+072 is possible. For this purpose we have done simultaneously time-series spectroscopy and multi-band photometry (observations and reductions in Sect. 2). The analysis of the results is presented in Sect. 3. Previously, other groups have done radial velocity studies (O'Toole et al. 2000, 2002; Woolf et al. 2002) or photometric campaigns (e.g. Kilkenny et al. 1999) on PG 1605+072. Simultaneous multi-band photometry has not been observed before. This enables us to study the temporal evolution of the frequencies and amplitudes of the pulsation modes (Sect. 4). Finally, we discuss our results and give a brief outlook to future work in Sect. 5.
We obtained time resolved longslit spectra for the sdBV PG 1605+072 during
one observing run. The observations were carried out with the 3.5-m telescope at
the DSAZ, Calar Alto, Spain and the TWIN spectrograph (two SITe-CCDs with
2048 ![]() 800 pixels à 15
800 pixels à 15 ![]() m). The time allocation committee awarded two
nights on May 14 and
15, 2001. Because of rain during the first night data were only obtained during
the second night (5 h 27 m of data). The passage of clouds and variable seeing
affected the quality of the data considerably. In order to achieve an adequate
time resolution observations were carried out in trailing mode which means that
the telescope tracking is tuned such that the star moves slowly along the slit in
N-S direction. The drift velocity was chosen at 270
m). The time allocation committee awarded two
nights on May 14 and
15, 2001. Because of rain during the first night data were only obtained during
the second night (5 h 27 m of data). The passage of clouds and variable seeing
affected the quality of the data considerably. In order to achieve an adequate
time resolution observations were carried out in trailing mode which means that
the telescope tracking is tuned such that the star moves slowly along the slit in
N-S direction. The drift velocity was chosen at 270
![]() per hour so that a
time resolution of 15 s per pixel resulted. The time resolution is dependent on
the seeing conditions and thus varied during the night. The slit width was
1.5
per hour so that a
time resolution of 15 s per pixel resulted. The time resolution is dependent on
the seeing conditions and thus varied during the night. The slit width was
1.5
![]() .
We chose the gratings T05 and T06 (36
.
We chose the gratings T05 and T06 (36 ![]() /mm)
corresponding to a spectral resolution of
/mm)
corresponding to a spectral resolution of ![]() 1
1 ![]() .
The spectral
ranges from 3860-4960
.
The spectral
ranges from 3860-4960 ![]() in the blue and from 5880-6920
in the blue and from 5880-6920
![]() in the red were covered. Moreover, to decrease the readout time
and the noise level the data were binned (1
in the red were covered. Moreover, to decrease the readout time
and the noise level the data were binned (1![]() 2).
2).
Simultaneously with the time resolved spectroscopy of the target star its
light curve was measured in four wavelength bands at the 2.2-m telescope at Calar
Alto. At this telescope five nights between May 14 and 18, 2001 were awarded.
No data could be taken during the first night and from the middle of the fourth
night until the end of the run due to bad weather conditions. 12 h 27 m of
pure
observation time resulted in 880 measurements. The telescope was equipped with
the new multi-band photometer BUSCA (Reif et al. 1999; Cordes et al.
in prep.) which is able to measure in four photometric bands
simultaneously. Three beamsplitters split the incoming light into four beams
that feed four 4k![]() 4k CCDs. Only Strømgren filters were available for
BUSCA.
Use of these filters would have further reduced the S/N. Therefore, no filters
were inserted and the beamsplitters served as non-overlapping broad band
filters. The transmission curves of the four bands are shown in Fig. 1.
These curves convoluted with the quantum efficiency curves of the CCDs
provide the pass bands for our observations. The four wavelength bands are
denoted by "
4k CCDs. Only Strømgren filters were available for
BUSCA.
Use of these filters would have further reduced the S/N. Therefore, no filters
were inserted and the beamsplitters served as non-overlapping broad band
filters. The transmission curves of the four bands are shown in Fig. 1.
These curves convoluted with the quantum efficiency curves of the CCDs
provide the pass bands for our observations. The four wavelength bands are
denoted by "
![]() '', "
'', "
![]() '', "
'', "
![]() '' and "
'' and "
![]() '' throughout the paper following
the notation of Cordes et al. (in prep.). We chose an exposure time of 15 s
which provides a good S/N and a reasonable coverage of the main frequencies.
2
'' throughout the paper following
the notation of Cordes et al. (in prep.). We chose an exposure time of 15 s
which provides a good S/N and a reasonable coverage of the main frequencies.
2![]() 2 binning (resolution: 0.17
2 binning (resolution: 0.17
![]() per unbinned
pixel) and the windowing option (reading out 346
per unbinned
pixel) and the windowing option (reading out 346![]() 400 pixels of the CCDs)
helped to reduce the full cycle time to 51 s.
400 pixels of the CCDs)
helped to reduce the full cycle time to 51 s.
![\begin{figure}
\par\includegraphics[width=8.8cm,clip]{3408.f1.eps}\end{figure}](/articles/aa/full/2003/13/aa3408/img22.gif) |
Figure 1:
Transmission curves of the four BUSCA wavelength bands. The four ranges
are denoted by "
|
| Open with DEXTER | |
The brightness variations of PG 1605+072 were detected by relative photometry. For this purpose two stars of similar brightnesses in the R band ( R1=13.2 and R2=13.4) next to our target star were used.
Data reduction was done using the IDL based software SPEX (Long slit SPectrum EXtraction package![]() ),
and TRIPP (Time Resolved Imaging Photometry
Package, see Schuh et al. 1999). TRIPP is based on the CCD
photometry routines written by R. D. Geckeler (1998) and performs
aperture photometry. The most important
step is the determination of the relative flux of the target star with one or
more stars as comparison objects. The detection of variations of the order of a
few mmag is only possible when comparison stars and sky background are recorded
simultaneously (especially under comparatively poor conditions).
),
and TRIPP (Time Resolved Imaging Photometry
Package, see Schuh et al. 1999). TRIPP is based on the CCD
photometry routines written by R. D. Geckeler (1998) and performs
aperture photometry. The most important
step is the determination of the relative flux of the target star with one or
more stars as comparison objects. The detection of variations of the order of a
few mmag is only possible when comparison stars and sky background are recorded
simultaneously (especially under comparatively poor conditions).
SPEX is designed for the reduction of long slit spectra. The reduction comprises of the standard procedures flatfielding, biasing, cosmic ray event extraction, and 2-D wavelength calibration. The latter is very important because we extract spectra from single CCD rows in order to establish the time-series. Therefore, we have to ensure that the position of the comparison lines perpendicular to the dispersion direction doesn't change. In fact, these positions vary and thus we correct for that by fitting a polynomial. After the calibration of one CCD row the resulting dispersion relation is applied to every single CCD row.
One crucial point was the calibration of the time axis. As a consequence of the
trailing mode observation the seeing disk moves slowly
across the CCD and therefore the signal smears over the trailing direction. The
initial point of time of the measurement and the cycle time were determined by
fitting Gaussian profiles to the rising flank of the star's signal. Finally,
radial velocities were derived by fitting Lorentz profiles to the Balmer lines
![]() -
-
![]() as well as to He I 4471
as well as to He I 4471
![]() and He II 4686
and He II 4686 ![]() .
.
Both the spectroscopic as well as the photometric time-series were analysed with the program package TRIPP. It enables the calculation of periodograms, confidence levels and fits with multiple sine functions (see Dreizler et al. 2002 for more details).
We were able to derive accurate radial velocity curves for the Balmer lines
![]() and
and
![]() (see Fig. 2). The
frequency resolution for this run is calculated to be 51
(see Fig. 2). The
frequency resolution for this run is calculated to be 51
![]() Hz. Trailing mode observations require stable weather conditions so that
the intensity of the star's signal is almost constant during one exposure. Thus
bad seeing and transparency changes due to the passage of small clouds influence
the quality of the data rather strongly. Because of these disturbances the
quality of the radial velocity curves varies with time. The radial velocity
curves of the other Balmer lines and the He lines turned out to be too noisy for
a quantitative analysis and are not further discussed. Better conditions should
allow a more extensive study of radial velocity changes in this star.
Hz. Trailing mode observations require stable weather conditions so that
the intensity of the star's signal is almost constant during one exposure. Thus
bad seeing and transparency changes due to the passage of small clouds influence
the quality of the data rather strongly. Because of these disturbances the
quality of the radial velocity curves varies with time. The radial velocity
curves of the other Balmer lines and the He lines turned out to be too noisy for
a quantitative analysis and are not further discussed. Better conditions should
allow a more extensive study of radial velocity changes in this star.
The Lomb-Scargle periodograms calculated from the radial velocity curves (see
Fig. 3) show peaks clearly surpassing the 3![]() confidence
level. Applying a prewhitening procedure to the data three frequencies and their
amplitudes (see Table 1) were found for both Balmer lines
investigated. Other peaks that seem
to lie above the 3
confidence
level. Applying a prewhitening procedure to the data three frequencies and their
amplitudes (see Table 1) were found for both Balmer lines
investigated. Other peaks that seem
to lie above the 3![]() level could not be extracted by our procedure. The
dominant frequency at 2.076 mHz has the largest velocity amplitude with 12.7 km s-1 for
level could not be extracted by our procedure. The
dominant frequency at 2.076 mHz has the largest velocity amplitude with 12.7 km s-1 for
![]() and 14.3 km s-1 for
and 14.3 km s-1 for
![]() .
The
amplitudes of the other two frequencies are lower than the strongest one with
values ranging from 6 to 8 km s-1. We determined the amplitude accuracy
.
The
amplitudes of the other two frequencies are lower than the strongest one with
values ranging from 6 to 8 km s-1. We determined the amplitude accuracy
![]() by calculating the
median value of the white noise in the frequency range 3-7 mHz where almost
no power arises in the frequency spectrum. According to this, we found
by calculating the
median value of the white noise in the frequency range 3-7 mHz where almost
no power arises in the frequency spectrum. According to this, we found
![]() = 1.5 km s-1 for
= 1.5 km s-1 for
![]() and
and ![]() = 1.0 km s-1 for
= 1.0 km s-1 for
![]() .
.
![\begin{figure}
\par\includegraphics[width=7.5cm,clip]{3408.f2.eps}\par\vspace*{4mm}
\includegraphics[width=7.5cm,clip]{3408.f3.eps}\end{figure}](/articles/aa/full/2003/13/aa3408/img27.gif) |
Figure 2:
Radial velocity curve for
|
| Open with DEXTER | |
BUSCA is a unique instrument which enables the measurement in four different wave bands simultaneously. As a result we obtained four light curves.
Figure 4 shows the Lomb-Scargle periodograms of all BUSCA bands. They
are quite similar to the periodograms derived from the radial velocity curves
(Fig. 3). This data set spans over three nights so that daily aliases
are clearly visible and the frequency resolution is much better at
![]() Hz (compared to 51
Hz (compared to 51 ![]() Hz for the spectroscopy). Again we applied
the prewhitening technique in order to remove all significant peaks from the
periodogram and to obtain the amplitudes for each frequency. As
before, the horizontal line in the diagrams represents the 3
Hz for the spectroscopy). Again we applied
the prewhitening technique in order to remove all significant peaks from the
periodogram and to obtain the amplitudes for each frequency. As
before, the horizontal line in the diagrams represents the 3![]() confidence level above which we assume the detected frequencies to be real. In
all four wave bands five peaks with the same frequencies can be identified
(see Tables 2 and 3). The dominant frequency is again found
at 2.076 mHz and therefore confirms the results from spectroscopy. Furthermore,
additional frequencies were found in the region around 2.74-2.78 mHz but
these peaks are closely spaced so that a corresponding identification in all
BUSCA bands due to the medium frequency resolution was not possible. Peaks
that fall below the 3
confidence level above which we assume the detected frequencies to be real. In
all four wave bands five peaks with the same frequencies can be identified
(see Tables 2 and 3). The dominant frequency is again found
at 2.076 mHz and therefore confirms the results from spectroscopy. Furthermore,
additional frequencies were found in the region around 2.74-2.78 mHz but
these peaks are closely spaced so that a corresponding identification in all
BUSCA bands due to the medium frequency resolution was not possible. Peaks
that fall below the 3![]() confidence level were not removed from the
periodograms.
confidence level were not removed from the
periodograms.
![\begin{figure}
\par\includegraphics[width=7.5cm,clip]{3408.f4.eps}\par\vspace*{4mm}
\includegraphics[width=7.5cm,clip]{3408.f5.eps}\end{figure}](/articles/aa/full/2003/13/aa3408/img29.gif) |
Figure 3:
Lomb-Scargle periodogram of the radial velocity curve of
|
| Open with DEXTER | |
![\begin{figure}
\par\includegraphics[width=7.3cm,clip]{3408.f6.eps}\par\vspace*{2...
...ps}\par\vspace*{2mm}
\includegraphics[width=7.3cm,clip]{3408.f9.eps}\end{figure}](/articles/aa/full/2003/13/aa3408/img30.gif) |
Figure 4:
Lomb-Scargle periodogram of the light curves of the "
|
| Open with DEXTER | |
The amplitudes of the brightness variations are measured in fractional
intensity. The light curves are normalized to the fraction of intensity
![]() and the amplitudes were then converted to mmag.
This unit will be used throughout the whole paper.
The accuracy of these amplitudes are
calculated in the same way as we did it for the radial velocity amplitudes. Here
we used the median level of the white noise in the range 3-5 mHz. The
accuracies for the BUSCA wavebands are 1.52 mmag for "
and the amplitudes were then converted to mmag.
This unit will be used throughout the whole paper.
The accuracy of these amplitudes are
calculated in the same way as we did it for the radial velocity amplitudes. Here
we used the median level of the white noise in the range 3-5 mHz. The
accuracies for the BUSCA wavebands are 1.52 mmag for "
![]() '', 1.53 mmag for "
'', 1.53 mmag for "
![]() '', 1.12 mmag for
"
'', 1.12 mmag for
"
![]() '' and 1.37 mmag for "
'' and 1.37 mmag for "
![]() '', respectively.
'', respectively.
Figure 5 shows the semi amplitudes of four selected frequencies as a
function of effective wavelength of the bands. In Fig. 6
we display the relative change of the semi amplitude of each waveband. The
deviation with respect to the mean is largest for the "
![]() '' band.
The other channels, considered separately, behave rather similar showing much
smaller deviations from the mean brightness. This is explained
through the fact that the "
'' band.
The other channels, considered separately, behave rather similar showing much
smaller deviations from the mean brightness. This is explained
through the fact that the "
![]() '' band lies blueward to
the Balmer jump and the other redward of it. The opacity changes a lot across
this wavelength range and thus the stellar flux originates from different
atmospheric depths.
'' band lies blueward to
the Balmer jump and the other redward of it. The opacity changes a lot across
this wavelength range and thus the stellar flux originates from different
atmospheric depths.
Furthermore, we used the phases which are delivered by the sine fit
procedure (see Tables 2 and 3) in order to test whether there
is any wavelength dependency. The phase values are normalized to unity.
Figure 7
shows the deviations of the phases with respect to the mean value of all four
wavebands for the four selected frequencies of Fig. 5. The error bars
are calculated from
| (1) |
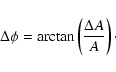 |
(2) |
![\begin{figure}
\par\includegraphics[width=8.8cm,clip]{3408.f10.eps}\end{figure}](/articles/aa/full/2003/13/aa3408/img35.gif) |
Figure 5:
Semi amplitudes of four frequencies as a function of effective
wavelength. The error bars are 1 |
| Open with DEXTER | |
Other groups have carried out similar studies already, either time-series spectroscopy (O'Toole et al. 2000; O'Toole et al. 2002; Woolf et al. 2002) or photometry (Kilkenny et al. 1999). O'Toole et al. (2000) have collected monochromatic photometric data, too, but they are not strictly simultaneous. We shall compare our results with their results in this section.
The photometric multi-site campaign of Kilkenny et al. (1999)
discovered more than 50 frequencies in their
frequency analysis of PG 1605+072. The five frequencies (2.076, 1.9865,
2.102, 2.2695 and 1.8912 mHz) detected in all BUSCA bands of our data were
already present in their data. Some of the others which we found additionally
(e.g. 4.0631 mHz) can be identified with frequencies from Kilkenny et al.
(1999) and others can not (in particular at 2.7866 mHz).
A closer inspection of these frequencies shows that all of them are very
close to one-day aliases (![]() 11.57
11.57
![]() )
of the extracted
frequencies of our or of Kilkenny's data to within the frequency resolution of
5.68
)
of the extracted
frequencies of our or of Kilkenny's data to within the frequency resolution of
5.68
![]() .
Small deviations of our measurements from those of Kilkenny et al.
(1999) can be explained by the shorter time spanned by our data
(
.
Small deviations of our measurements from those of Kilkenny et al.
(1999) can be explained by the shorter time spanned by our data
(![]() 48 h compared to
48 h compared to ![]() 217.6 h, frequency resolution:
5.68
217.6 h, frequency resolution:
5.68
![]() compared to 1.28
compared to 1.28
![]() ).
In contrast to our analysis, Kilkenny et al. (1999) were able to
resolve closely spaced frequencies, e.g. at 2.1017
).
In contrast to our analysis, Kilkenny et al. (1999) were able to
resolve closely spaced frequencies, e.g. at 2.1017 ![]() Hz and
2.1033
Hz and
2.1033 ![]() Hz
(see Table 2). Since 1997 the relative power within one blend of
frequencies may have changed so that the frequency of unresolved peaks in the
periodogram changes slightly because the contribution of the weaker feature at
that time may have grown in the meantime. We conclude that the frequencies
measured in the BUSCA light curves are consistent with those of Kilkenny et al.
(1999). The frequencies are stable in time to within our measurement
errors.
Hz
(see Table 2). Since 1997 the relative power within one blend of
frequencies may have changed so that the frequency of unresolved peaks in the
periodogram changes slightly because the contribution of the weaker feature at
that time may have grown in the meantime. We conclude that the frequencies
measured in the BUSCA light curves are consistent with those of Kilkenny et al.
(1999). The frequencies are stable in time to within our measurement
errors.
|
|
|
Woolf et al. (2002) | O'Toole et al. (2002) | ||||||
| f | P | RV | f | P | RV | P | RV | P | RV |
|
|
[s] | [km s-1] | [mHz] | [s] | [km s-1] | [s] | [km s-1] | [s] | [km s-1] |
| 2.078 | 481.28 | 12.7 | 2.076 | 481.66 | 14.3 | 481.7/475.3 | 3.9/4.0 | 480/475 | 4.3/8.5 |
| 2.756 | 362.89 | 8.0 | 2.753 | 363.21 | 6.5 | 363.2/366.2 | 3.0/6.1 | 365 | 7.2 |
| 1.985 | 503.79 | 7.9 | 1.978 | 505.77 | 7.2 | 502.0 | 3.9 | 504 | 4.1 |
| 527.1 | 2.7 |
| Kilk.'99 | "
|
"
|
|||||||
|
|
|
|
f | P | A | P | A | ||
|
|
[s] | [mmag] | [mHz] | [s] | [mmag] | [s] | [mmag] | ||
| 2.0758 | 481.75 | 27.4 | 2.0760 | 481.69 |
36.88 |
0.684 |
481.69 |
29.27 |
0.700 |
| 1.9853 | 503.70 | 3.3 | 1.9861 | 503.51 |
22.59 |
0.953 |
503.60 |
22.45 |
0.951 |
| |
475.82 | 15.4 | 2.1020 | 475.74 |
19.76 |
0.026 |
475.82 |
16.94 |
0.000 |
| |
475.45 | 15.9 | |||||||
| 2.7613 | 362.15 | 1.8 | 2.7631 | 361.92 |
16.01 |
0.051 |
361.97 |
10.54 |
0.043 |
| 2.7663 | 361.49 | 2.0 | 2.7668 | 361.43 |
10.94 |
0.192 |
|||
| - | - | - | 2.7554 | 363.10 |
14.97 |
0.080 |
|||
| 2.2701 | 440.51 | 5.2 | 2.2700 | 440.52 |
8.92 |
0.144 |
440.54 |
6.85 |
0.148 |
| 1.8914 | 528.70 | 13.9 | 1.8915 | 528.69 |
7.65 |
0.675 |
528.79 |
8.25 |
0.643 |
| 2.7173 | 368.01 | 0.6 | 2.7191 | 367.77 |
7.45 |
0.897 |
|||
| 2.3920 | 418.05 | 2.2 | 2.3921 | 418.05 |
7.87 |
0.833 |
|||
| - | - | - | 4.0748 | 245.41 |
4.39 |
0.549 |
| Kilk.'99 | "
|
"
|
|||||||
|
|
|
|
f | P | A | P | A | ||
|
|
[s] | [mmag] | [mHz] | [s] | [mmag] | [s] | [mmag] | ||
| 2.0758 | 481.75 | 27.4 | 2.0759 | 481.71 |
28.45 |
0.691 |
481.73 |
28.72 |
0.684 |
| 1.9853 | 503.70 | 3.3 | 1.9858 | 503.58 |
18.79 |
0.948 |
503.61 |
18.02 |
0.936 |
| 2.1017 | 475.82 | 15.4 | 2.1020 | 475.76 |
16.68 |
0.028 |
475.70 |
17.18 |
0.057 |
| - | - | - | 2.7530 | 363.23 |
17.15 |
0.054 |
|||
| - | - | - | 2.7866 | 358.87 |
6.22 |
0.213 |
|||
| 2.7427 | 364.60 | 15.1 | 2.7427 | 364.60 |
10.37 |
0.043 |
|||
| - | - | - | 2.7637 | 361.84 |
13.40 |
0.057 |
|||
| 2.2701 | 440.51 | 5.2 | 2.2700 | 440.56 |
6.85 |
0.133 |
440.60 |
6.66 |
0.183 |
| 1.8914 | 528.70 | 13.9 | 1.8914 | 528.71 |
6.79 |
0.670 |
528.90 |
6.88 |
0.625 |
| 2.3920 | 418.05 | 2.2 | 2.3920 | 418.06 |
5.80 |
0.811 |
417.94 |
6.44 |
0.821 |
| 4.0618 | 246.19 | 1.2 | 4.0624 | 246.16 |
4.47 |
0.458 |
246.17 |
5.38 |
0.413 |
![\begin{figure}
\par\includegraphics[width=8.8cm,clip]{3408.f11.eps}\end{figure}](/articles/aa/full/2003/13/aa3408/img45.gif) |
Figure 6:
Relative semi amplitudes of the four frequencies from Fig. 5.
These are calculated by
|
| Open with DEXTER | |
![\begin{figure}
\par\includegraphics[width=8.8cm,clip]{3408.f12.eps}\end{figure}](/articles/aa/full/2003/13/aa3408/img46.gif) |
Figure 7: Deviation of the phases from the mean value calculated from the four frequency bands for the frequencies given in Fig. 5. The error bars are calculated from the amplitude errors as described in the text. |
| Open with DEXTER | |
Also the frequencies discovered in the radial velocity curves are consistent
with both the BUSCA and the Kilkenny values. The time basis of the
spectroscopic data is too short in comparison to the long-term photometry to
resolve the frequencies. This is also true for most of the other spectroscopic
feasibility studies mentioned before. Only O'Toole et al. (2002) had a
sufficiently long baseline of ![]() 70 d. Thus, we discuss only the
relative distribution of the power of the pulsation frequencies. As can be
seen in Fig. 3 the main power is located around 2.076 mHz.
Significant power arises in the frequency range 2.74-2.78 mHz but it falls
off compared to the former.
The same distribution of pulsation power was detected by the multi-site
photometric campaign of Kilkenny et al. (1999) who carried out their
observations in April and May 1997. Two years later, in July and August 1999,
O'Toole et al. (2000) recovered the same frequency pattern but
discovered that the amplitudes had changed and, in particular, that no
power was detected at 2.076 mHz. Another year later (in May 2000) O'Toole et al. (2002) and
Woolf et al. (2002) gathered data again. Both groups
discovered a drastic change in the relative power distribution: The power
at 2.076 mHz appeared again and was at that time weaker than that in the
frequency range 2.74-2.78 mHz. This means that the power switches within a
few years. Our data which were taken in May 2001, i.e. another year later,
show that the power distribution switched back to that of 1997 measured by
Kilkenny et al. (1999).
70 d. Thus, we discuss only the
relative distribution of the power of the pulsation frequencies. As can be
seen in Fig. 3 the main power is located around 2.076 mHz.
Significant power arises in the frequency range 2.74-2.78 mHz but it falls
off compared to the former.
The same distribution of pulsation power was detected by the multi-site
photometric campaign of Kilkenny et al. (1999) who carried out their
observations in April and May 1997. Two years later, in July and August 1999,
O'Toole et al. (2000) recovered the same frequency pattern but
discovered that the amplitudes had changed and, in particular, that no
power was detected at 2.076 mHz. Another year later (in May 2000) O'Toole et al. (2002) and
Woolf et al. (2002) gathered data again. Both groups
discovered a drastic change in the relative power distribution: The power
at 2.076 mHz appeared again and was at that time weaker than that in the
frequency range 2.74-2.78 mHz. This means that the power switches within a
few years. Our data which were taken in May 2001, i.e. another year later,
show that the power distribution switched back to that of 1997 measured by
Kilkenny et al. (1999).
Our spectroscopic feasibility study based on data taken in May 2001 confirms
earlier studies from observations in July/August 1999 and May 2000. All these
investigations have shown that it is possible to measure accurate radial
velocity curves for PG 1605+072. Three to five frequencies could be detected
in the periodograms. The detected frequencies found in the radial velocity
studies are very stable (see Tables 2 and 3). However, the
amplitudes of the frequencies show drastic temporal changes over a few years. We
also have simultaneously measured photometric variations of PG 1605+072 in
four wavebands for the first time. The amplitudes in the
"
![]() '' band are found to be significantly larger than
at larger wavelengths ("
'' band are found to be significantly larger than
at larger wavelengths ("
![]() '', "
'', "
![]() '' and "
'' and "
![]() ''). No phase shifts between the four
light curves can be detected.
''). No phase shifts between the four
light curves can be detected.
The time basis of all observations is much too short to resolve the full frequency spectrum of this star. More than 50 frequencies have been resolved in the long photometric study of Kilkenny et al. (1999). Consequently, a new data set with a longer time basis is needed. For that reason we organised a combined photometric and spectroscopic multi-site campaign (PI: U. Heber), termed the MSST (Multi Site Spectroscopic Telescope) project (Heber et al. 2002b). These observations covered a period of one month in May/June 2002. This project is unique in that it combines photometric and spectroscopic data. The data still have to be reduced and analysed. A lot of work remains to be done. Hopefully, we will be able to identify pulsation modes within this large data set and carry out a detailed asteroseismological investigation of PG 1605+072. The feasibility study presented in this paper in concert with all other equivalent studies mentioned in Sect. 4 have paved the way for this aim.
Acknowledgements
The authors would like to thank the Calar Alto staff for their support during our observation run in May 2001. Financial support by the Deutsches Zentrum für Luft- und Raumfahrt (DLR) under grant 50 OR 96029-ZA is gratefully acknowledged. We also thank the Deutsche Forschungs Gemeinschaft (DFG) for a travel grant (HE 1356/33-1) to Calar Alto observatory. BUSCA was realised with financial support by the german Bundesministerium für Bildung, Wissenschaft, Forschung und Technologie (BMBF) through grant 0 3BN114 (4) of Verbundforschung Astronomie/Astrophysik. We thank Simon O'Toole for his valuable comments on the text and contributing a routine to calculate the errors of the amplitudes and phases.