Appendix A: Extinction coefficients and colour terms
Extinction coefficients and colour terms were computed using the
method outlined by Harris et al. (1991),
i.e. via a single-step multi-linear least squares fit to the data
provided by the observation of photometric standard star fields
(Landolt 1992). This
procedure, in fact, allows one to get the photometric solutions using
different stars with suitable colour and airmass ranges, without the need
for repeating the observations at different airmasses. Due to the FORS1
calibration plan implemented during the time range discussed in this work,
this was a mandatory requirement. To get meaningful results,
the method needs a fair number of stars well spread in colour and airmass.
While the first requirement is almost always fulfilled for the Landolt fields
suitable for CCD photometry, the second is more cumbersome to achieve using
FORS1 data.
In order to overcome this problem we have computed the photometric parameters
on a bi-monthly basis, for those time ranges where at least 3 stars were
observed at airmass larger than 1.6. Harris et al. (1991) recommend
to use data spanning at least 1 airmass, but we had to relax this constraint
in order to get a sufficient number of stars.
Some tests have shown that the available photometric data do not allow the
computation of the second order colour term and extinction coefficient,
which are usually included in the photoelectric photometry solutions
(see Harris et al. 1991, their Eqs. (2.9)).
In fact, the introduction of such terms in the fitting of our data produces
random oscillations in the solutions without any significant decrease in the
variance. Both second order coefficients are accompanied by large
errors and are always consistent with zero. This clearly means that the
accuracy of our measurements is not sufficient to go beyond the first order
term. For this reason, we have adopted
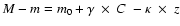 as fitting function
for the generic passband, where M and m are respectively the catalogue and
instrumental magnitudes of the standard stars, m0 is the zeropoint,
as fitting function
for the generic passband, where M and m are respectively the catalogue and
instrumental magnitudes of the standard stars, m0 is the zeropoint,  is the colour term with respect to some colour C,
  is the extinction
coefficient and z is the airmass. To eliminate clearly deviating measurements,
we have computed the photometric solutions in two steps. We have first used all
data to get a starting guess from which we have computed the global rms deviation
is the extinction
coefficient and z is the airmass. To eliminate clearly deviating measurements,
we have computed the photometric solutions in two steps. We have first used all
data to get a starting guess from which we have computed the global rms deviation
 .
Then we have rejected all data deviating more than
.
Then we have rejected all data deviating more than
 and performed again the least squares fit on the selected
data.
and performed again the least squares fit on the selected
data.
The results for the extinction coefficients are presented in Table A.1.
For each time range and passband we have reported the best fit value
of ,
the estimated rms error (both in mag airmass-1) and the
number of data points used for the least squares fit.
The values of
in the various bands show some minor fluctuations. Of
course, we cannot exclude night-to-night variations, which are clearly
observed at
other sites (see for instance Krisciunas 1990). This would require a dedicated
monitoring, which is beyond the scope of this work and not feasible with the
available data.
Here we can only conclude that, on average, the extinction coefficients
do not show any significant evolution or clear seasonal effects during the
20 months covered by the data discussed in this paper. Therefore, given also
the purpose of this analysis, we have assumed that the extinction coefficients
are constant in time and equal to the average values reported on
the last row of Table A.1.
The computed colour terms are shown Table A.2. We note that in
those cases where the constraints on the airmass range and the number of
data-points were not fulfilled, we have performed the best fit keeping
constant and equal to the average values given in Table A.1.
This prevented the best fit from giving results with no physical meaning due
to the poor airmass coverage. As in the case of the extinction coefficients,
the color terms show fluctuations which are within the errors, stronger
oscillations being seen in the U passband, where the accuracy of the
photometry is lower.
On the basis of these results we can conclude that there are no strong
indications for significant colour term evolution and it is therefore
reasonable to assume that they are constant in time.
For our purposes we have adopted the weighted mean values shown in the last
row of Table A.2.
Copyright ESO 2003