A&A 400, 257-264 (2003)
DOI: 10.1051/0004-6361:20021885
Ö. Çakirli 1 - C. Ibanoglu 1 - A. Frasca 2 - S. Catalano 2
1 - Ege University Observatory, Bornova, Izmir, Turkey
2 - INAF - Osservatorio Astrofisico di Catania, via S. Sofia 78, 95123
Catania, Italy
Received 9 September 2002 / Accepted 17 December 2002
Abstract
We present the results of spectroscopic observations of
the active eclipsing binary ER Vul in the 5860-6700 Å spectral range
carried out at the Catania Astrophysical Observatory.
Accurate measurements of radial velocities by using the cross-correlation
technique have been made and a new orbital solution is given. All
spectra display chromospheric emission which fills in the H![]() absorption
lines of both components.
The equivalent width (EW) of the H
absorption
lines of both components.
The equivalent width (EW) of the H![]() emission has been measured by subtraction
of a synthetic spectrum built up with spectra of inactive
standard stars. The EW of total H
emission has been measured by subtraction
of a synthetic spectrum built up with spectra of inactive
standard stars. The EW of total H![]() emission, arisen from
both components, shows a phase-dependent variation.
It reaches its maximum value just before the primary eclipse.
We were able to separate the contributions to the H
emission, arisen from
both components, shows a phase-dependent variation.
It reaches its maximum value just before the primary eclipse.
We were able to separate the contributions to the H![]() emission from
the individual components at phases far from the eclipses.
We have found that the secondary, cooler component is the most active and its
H
emission from
the individual components at phases far from the eclipses.
We have found that the secondary, cooler component is the most active and its
H![]() residual emission shows the same trend as
the total H
residual emission shows the same trend as
the total H![]() emission, along orbital phase.
This H
emission, along orbital phase.
This H![]() equivalent width variation
can be due to plage-like structures on the chromosphere of secondary star.
In addition, a decrease of the H
equivalent width variation
can be due to plage-like structures on the chromosphere of secondary star.
In addition, a decrease of the H![]() EW around the ingress phase of the
primary eclipse is apparent.
EW around the ingress phase of the
primary eclipse is apparent.
Key words: stars: activity - binaries: eclipsing - binaries: spectroscopic - stars: individual: ER Vul
ER Vulpeculae (HD 200391, BD +27![]() 3952, HIP 103833,
3952, HIP 103833,
![]() ,
,
![]() )
is a double-lined spectroscopic binary
(Northcott & Bakos 1956).
Its orbit was first determined by Northcott & Bakos (1956).
Later on the spectroscopic orbit of the ER Vul was re-determined by McLean (1982)
and several other radial velocity studies
have been performed in recent years (e.g. Hill et al. 1990; Gunn et al. 1996).
Northcott & Bakos (1956) also carried out
photometric observations of the system, that allowed them to confirm the eclipses and to present the
first preliminary photometric solution.
Since then many light curves have been
published by Al-Naimiy (1978), Kadouri (1982), Zeilik et al. (1982a,b), Arevalo
et al. (1988),
Milano et al. (1986), Ibanoglu et al. (1987), Evren (1988),
Srivastava et al. (1991), Wunder et al. (1992) and Zeinali et al.
(1995).
Ibanoglu et al. (1993) found solutions to B and V light curves applying a model
that includes proximity effects, wave-like distortions (spots), mutual eclipses and
short-term light fluctuations.
)
is a double-lined spectroscopic binary
(Northcott & Bakos 1956).
Its orbit was first determined by Northcott & Bakos (1956).
Later on the spectroscopic orbit of the ER Vul was re-determined by McLean (1982)
and several other radial velocity studies
have been performed in recent years (e.g. Hill et al. 1990; Gunn et al. 1996).
Northcott & Bakos (1956) also carried out
photometric observations of the system, that allowed them to confirm the eclipses and to present the
first preliminary photometric solution.
Since then many light curves have been
published by Al-Naimiy (1978), Kadouri (1982), Zeilik et al. (1982a,b), Arevalo
et al. (1988),
Milano et al. (1986), Ibanoglu et al. (1987), Evren (1988),
Srivastava et al. (1991), Wunder et al. (1992) and Zeinali et al.
(1995).
Ibanoglu et al. (1993) found solutions to B and V light curves applying a model
that includes proximity effects, wave-like distortions (spots), mutual eclipses and
short-term light fluctuations.
Ca II H and K emissions were first detected by Bond (1970). On the basis of the H and K line emission and of the variable light curve, Hall (1976) classified ER Vul as a member of the short-period group of RS CVn systems, with main-sequence components in a detached configuration. However, ER Vul displays a number of interesting peculiarities.
Arevalo et al. (1988) tried to explain the photometric variations and the observed IR and UV excesses as due to a gaseous stream between the two components.
McLean (1982) noticed a variation in the strength of the primary-component's spectral lines which he attributed to circumstellar material around this star with a non-uniform density. Hill et al. (1990) observed small variations (8%) of the strength of lines of the secondary component between quadratures. They also suggested that, at the epoch of their observations, the secondary component was more active than the primary.
The first study of the H![]() line behaviour as a function
of orbital phase was made by Barden (1985). He focused on the rotation versus activity relationship
among late-type stellar systems.
Newmark (1990) presented simultaneous observations in H
line behaviour as a function
of orbital phase was made by Barden (1985). He focused on the rotation versus activity relationship
among late-type stellar systems.
Newmark (1990) presented simultaneous observations in H![]() ,
H
,
H![]() ,
and Ca II (IRT) lines.
He found no evidence for extended material around
ER Vul in optical spectra as suggested before by Arevalo et al. (1988), while line ratios indicate
that chromospheric activity arises primarily in plage-like structures. He also found that the primary
component is the more active one.
Finally, Lazaro & Arevalo (1997) carried out low-resolution (2.2 Å/pixel) spectroscopic
observations of ER Vul including
H
,
and Ca II (IRT) lines.
He found no evidence for extended material around
ER Vul in optical spectra as suggested before by Arevalo et al. (1988), while line ratios indicate
that chromospheric activity arises primarily in plage-like structures. He also found that the primary
component is the more active one.
Finally, Lazaro & Arevalo (1997) carried out low-resolution (2.2 Å/pixel) spectroscopic
observations of ER Vul including
H![]() ,
H
,
H![]() ,
and Ca II (IRT) lines at different orbital phases. In all
spectra obtained by them H
,
and Ca II (IRT) lines at different orbital phases. In all
spectra obtained by them H![]() emission from both components appears, after the subtraction of
the reference spectrum.
Equivalent width of the total emission in the H
emission from both components appears, after the subtraction of
the reference spectrum.
Equivalent width of the total emission in the H![]() line reaches its maximum value during the
second photometric maximum (
line reaches its maximum value during the
second photometric maximum (![]() ); however their observations do not fully cover the first maximum.
They found clear indication that both components of ER Vul are chromospherically active and no
indication, at phases around the two eclipses, of features related to the photometric
peculiarities observed by Arevalo et al. (1988). The measured ratio of H
); however their observations do not fully cover the first maximum.
They found clear indication that both components of ER Vul are chromospherically active and no
indication, at phases around the two eclipses, of features related to the photometric
peculiarities observed by Arevalo et al. (1988). The measured ratio of H![]() and H
and H![]() emission,
emission,
![]() ,
is indicative of optically thick formation.
High resolution spectra (
,
is indicative of optically thick formation.
High resolution spectra (
![]() ), taken around the primary eclipse, have
been presented and analyzed by means of spectral subtraction technique by Gunn & Doyle (1997).
They found excess emission in the cores of H
), taken around the primary eclipse, have
been presented and analyzed by means of spectral subtraction technique by Gunn & Doyle (1997).
They found excess emission in the cores of H![]() ,
Ca II IRT, Mg I b lines and
excess absorption in the helium D3 line. Apart from the detection of a very weak absorption feature
200 km s-1 blue-ward of the secondary component, they do not detect spectroscopically the
existence of extended regions in this system. They found that chromospheric emission arises in
very large plage-like regions. During their observations the secondary component of
ER Vul was more active than the primary in H
,
Ca II IRT, Mg I b lines and
excess absorption in the helium D3 line. Apart from the detection of a very weak absorption feature
200 km s-1 blue-ward of the secondary component, they do not detect spectroscopically the
existence of extended regions in this system. They found that chromospheric emission arises in
very large plage-like regions. During their observations the secondary component of
ER Vul was more active than the primary in H![]() .
.
X-ray observations were carried out by Walter & Bowyer (1981), White et al. (1987) and Kashyap & Drake (1999). White et al. (1987) found variable X-ray luminosity but no rotational modulation in the X-ray light curve. On the other hand Drake et al. (1986) found that ER Vul was the strongest source among the short-period active binaries in the radio domain. This suggestion has been confirmed by Mutel (1988). The radio light curve obtained by Rucinski (1992) revealed ER Vul as a complex variable.
The two stars which form ER Vul system are approximately twins in mass, radius and luminosity. It is interesting to study this system composed by two solar type stars, which rotate about 40 times faster than the Sun, in order to get a better understanding of magnetic activity phenomena in such extreme cases.
Here we analyze and discuss our spectroscopic observations of ER Vul
in a spectral domain including the H![]() line and several photospheric lines of interest.
The observations and data reduction are described in Sect. 2. The radial velocity (RV) measurements
and the solution of RV curve are presented in Sect. 3. Section 4 is devoted to the analysis of
H
line and several photospheric lines of interest.
The observations and data reduction are described in Sect. 2. The radial velocity (RV) measurements
and the solution of RV curve are presented in Sect. 3. Section 4 is devoted to the analysis of
H![]() emission.
emission.
The observations have been performed with the echelle spectrograph at
91-cm telescope of the Catania Astrophysical Observatory
M. G. Fracastoro station
from 10 to 25 August and from 18 to 24 September 2000.
The spectra were obtained using the echelle configuration based on a 900-lines/mm
echellette grating as a cross-disperser element and an echelle grating with 79 lines/mm.
The spectrograph
was fed by the telescope through an optical fiber and was located in a stable
position in the room below the dome level. A thinned, back-illuminated CCD with
![]() pixels (pixel size of 24
pixels (pixel size of 24 ![]() m) has been used during the observing run.
We recorded 5 orders in each frame starting from 5860 Å and with a spectral domain of
about 850 Å. For all the observing runs the width of the slit was set to 550
m) has been used during the observing run.
We recorded 5 orders in each frame starting from 5860 Å and with a spectral domain of
about 850 Å. For all the observing runs the width of the slit was set to 550 ![]() m,
projected onto 2.7 pixels of the detector, providing a spectral resolving power
m,
projected onto 2.7 pixels of the detector, providing a spectral resolving power
![]() .
Typical exposure times for ER Vul spectra were between 1800 and 2400 s.
The signal-to-noise ratio (S/N) attained was about 80-110 at the continuum near the
H
.
Typical exposure times for ER Vul spectra were between 1800 and 2400 s.
The signal-to-noise ratio (S/N) attained was about 80-110 at the continuum near the
H![]() line, depending on the atmospheric conditions.
line, depending on the atmospheric conditions.
In addition to ER Vul, we observed some inactive stars of spectral type similar to that of the components of ER Vul. Among these we have chosen 72 Her (G0 V) to mimic the hotter and cooler components of ER Vul.
Sixteen spectra of ER Vul were collected during the 16 observing nights. The radial-velocity standard star 31 Aql (G7 IV) was nightly observed as well.
The reduction has been performed by using the ECHELLE task of IRAF![]() (Image Reduction and Analysis Facilities)
package following the standard steps:
(Image Reduction and Analysis Facilities)
package following the standard steps:
The RV of both components of ER Vul has been the subject of intense studies over many decades by several researchers.
The first radial velocity curves of both components of ER Vul, based on an average of a dozen lines, taken between 1949-1951 at David Dunlap Observatory, were published by Northcott & Bakos (1956). They found a systemic velocity of -25.2 km s-1 and derived RV curve semi-amplitudes of 138.5 and 149.3 km s-1, for the primary and secondary component respectively. The spectroscopic elements obtained by them are given in Table 1 together with the results obtained in subsequent works.
| Parameter | Northcott & Bakos | McLean | Hill et al. | Present paper |
|
|
|
|
||
|
|
|
|
||
|
|
|
|
||
|
|
|
|
|
|
|
|
|
|
|
|
|
|
|
|
|
|
|
|
|
|
|
|
| q (
|
|
|
|
|
McLean (1982) presented RV observations of ER Vul, based on plates spectra, taken in 1980 at the Haute Provence Observatory and reduced by means of digital techniques. However, the radial velocity curve obtained by McLean was different from those obtained previously by Northcott & Bakos (1957), and therefore, he found slightly different masses for the component stars.
Further spectroscopic observations based on
Reticon detector were made by Hill et al. (1990). They made the observation between 1985 and 1987 at
the Dominion Astrophysical Observatory (DAO) with the coudé spectrograph in the spectral domain
4000-4500 Å and with a spectral purity of about 0.9 Å, as they deduced from
the FWHM of the emission lines of the comparison lamp. Their orbital parameters are
also given in Table 1.
They report the projected rotational velocities of both components,
![]() km s-1 and
km s-1 and
![]() km s-1, based on the full width at half maximum of the cross-correlation
peaks.
km s-1, based on the full width at half maximum of the cross-correlation
peaks.
The latest radial velocity curve we found in the literature, was published by Gunn et al. (1996). They observed a group of chromospherically active stars, including ER Vul, in 1994 by using 1.1-meter telescope of Lowell Observatory (Solar Stellar Spectrograph, SSS). The radial velocity data of the two components of ER Vul were determined by the cross-correlation function method.
Our spectra, acquired in two different observing runs, have allowed us to obtain new
radial velocities of both components, with a fairly homogeneous coverage of orbital phase.
Our RV evaluation has been performed by means of the cross-correlation technique using the
IRAF task FXCOR (e.g., Tonry & Davis 1979; Fitzpatric 1993; Popper & Jeong 1994).
The bright, slow-rotating, radial-velocity standard star
31 Aql (G7IV,
![]() ), whose radial velocity is -100.5 km s -1, was used as template for
the cross-correlation.
We excluded from the analysis the H
), whose radial velocity is -100.5 km s -1, was used as template for
the cross-correlation.
We excluded from the analysis the H![]() and Na I D2 lines which
can be contaminated by chromospheric emission and all the spectral ranges heavily affected
by telluric absorption lines (e.g. the O2 band
and Na I D2 lines which
can be contaminated by chromospheric emission and all the spectral ranges heavily affected
by telluric absorption lines (e.g. the O2 band ![]() 6276-6315). Other less
intense and blended telluric lines were interactively taken out by simple linear interpolation,
both in ER Vul and 31 Aql spectra.
6276-6315). Other less
intense and blended telluric lines were interactively taken out by simple linear interpolation,
both in ER Vul and 31 Aql spectra.
![\begin{figure}
\par\includegraphics[height=6.4cm,width=8.8cm,clip]{H3972F1.ps} \end{figure}](/articles/aa/full/2003/10/aah3972/img66.gif) |
Figure 1: The RVs of the primary and secondary component and their best fits for circular orbit. The phases were computed from the linear ephemeris given in Eq. (1). The empty and filled symbols denote RVs of the secondary and primary component, respectively. |
| Open with DEXTER | |
Radial velocities of the two components, listed in Table 2 together with their standard
errors, are weighted averages of the values obtained from the cross-correlation of each order of the
target spectra with the corresponding order of the standard spectrum observed in the same night.
The usual weight
![]() has been given to each measurement.
has been given to each measurement.
The standard errors of the weighted means have been computed on the basis of the
errors
![]() in the RV values for
each order according to the usual formula (see e.g. Topping 1972).
The latter (
in the RV values for
each order according to the usual formula (see e.g. Topping 1972).
The latter (
![]() )
are computed by FXCOR according to the fitted peak height
and the antisymmetric noise as described by Tonry & Davis (1979).
)
are computed by FXCOR according to the fitted peak height
and the antisymmetric noise as described by Tonry & Davis (1979).
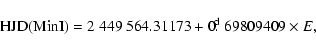
The orbital phases have been calculated with the following ephemeris:
In Table 1 we compare our orbital parameters with those of Northcott &
Bakos (1956), McLean (1982), and of Hill et al. (1990). Notwitstanding the higher errors,
our values of the semi-amplitude of the RV curves are in very good agreement with
those derived by Northcott & Bakos (1956) and by Hill et al. (1990), while the systemic
velocity ![]() is slightly lower, but within one sigma.
is slightly lower, but within one sigma.
Since the eclipses are very shallow, the parameters
obtained from the light curve analysis have large uncertainties. The inclination of the orbit determined
so far is in the 65
![]() -72
-72
![]() range. The solution of the 16 light curves obtained by
Ibanoglu et al. (1993) gave a mean value of
range. The solution of the 16 light curves obtained by
Ibanoglu et al. (1993) gave a mean value of
![]() .
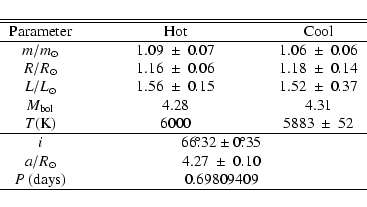
If we use this value for the system inclination, we find for the primary star a mass of
.
If we use this value for the system inclination, we find for the primary star a mass of
![]() ,
while the mass of the secondary star is 1.06
,
while the mass of the secondary star is 1.06
![]() .
The masses found by McLean are practically equal to one solar mass and result to be
systematically smaller than all the other determinations that are, instead, in fairly good
agreement between themselves. We found an orbital separation of 4.27 R
.
The masses found by McLean are practically equal to one solar mass and result to be
systematically smaller than all the other determinations that are, instead, in fairly good
agreement between themselves. We found an orbital separation of 4.27 R![]() . Combining
this value with the fractional
radii of the components found by Ibanoglu
et al. (1993), we derived the radii of both components as
. Combining
this value with the fractional
radii of the components found by Ibanoglu
et al. (1993), we derived the radii of both components as
![]() .
The absolute parameters of the components are presented
in Table 3. The results indicate that both components of ER Vul have nearly equal
masses and radii.
.
The absolute parameters of the components are presented
in Table 3. The results indicate that both components of ER Vul have nearly equal
masses and radii.
| HJD | Phase | ||
| 2450000+ | (km s-1) | (km s-1) | |
| 1767.4569 | 0.450 |
|
|
| 1768.4527 | 0.876 |
|
|
| 1769.4928 | 0.367 |
|
|
| 1771.4159 | 0.121 |
|
|
| 1772.4266 | 0.569 |
|
|
| 1773.4002 | 0.964 | - |
|
| 1774.4156 | 0.418 |
|
|
| 1776.4759 | 0.962 | - |
|
| 1775.4932 | 0.370 |
|
|
| 1777.4908 | 0.823 |
|
|
| 1806.4255 | 0.272 |
|
|
| 1807.3977 | 0.664 |
|
|
| 1808.4041 | 0.106 |
|
|
| 1809.3862 | 0.513 |
|
- |
| 1810.4488 | 0.035 | - |
|
| 1812.4762 | 0.939 |
|
|
Since we cannot directly image the stellar surface, with its photospheric and chromospheric inhomogeneities, we must rely on indirect methods and theoretical models to extract the needed information from light-curves and/or spectral-line fluxes.
The H![]() line is an important indicator of chromospheric activity.
Only the very active binaries show H
line is an important indicator of chromospheric activity.
Only the very active binaries show H![]() emission always above the continuum
(e.g. II Peg, V711 Tau, UX Ari, XX Tri, AR Psc);
in less active stars only a filled-in
absorption line is observed. For some objects the H
emission always above the continuum
(e.g. II Peg, V711 Tau, UX Ari, XX Tri, AR Psc);
in less active stars only a filled-in
absorption line is observed. For some objects the H![]() line goes from filled-in
absorption to emission during flare events (Catalano & Frasca 1994) or
during activity variations over longer time scales, like those induced by rotational modulation
or cycles.
line goes from filled-in
absorption to emission during flare events (Catalano & Frasca 1994) or
during activity variations over longer time scales, like those induced by rotational modulation
or cycles.
The H![]() -line analysis is more difficult in a double-lined system in which both
spectra are simultaneously seen and shifted at different wavelengths, according to the orbital phase.
Therefore, in order to extract a valid information about the chromospheric contribution,
a comparison with a synthetic spectrum constructed with two stellar
spectra that mimic the two components of the system in absence of activity is needed.
-line analysis is more difficult in a double-lined system in which both
spectra are simultaneously seen and shifted at different wavelengths, according to the orbital phase.
Therefore, in order to extract a valid information about the chromospheric contribution,
a comparison with a synthetic spectrum constructed with two stellar
spectra that mimic the two components of the system in absence of activity is needed.
As shown by several investigators (e.g. Barden 1984; Montes et al. 1994; Frasca & Catalano 1994; Frasca et al. 2000a), spectral subtraction is a suitable technique for the study of stellar activity because it allows to isolate the chromospheric signature in a spectral line, to identify the star which is responsible for the chromospheric emission in double systems and to obtain a more secure integration of the emission contribution in the residual spectra.
In addition to the sensitivity to chromospheric layers, H![]() emission is also a good
diagnostic of inter-system matter in the form of gas streams, transient or classical accretion
disks and rings in mass-transferring binaries like those of the Algol type, in which the cooler
star fills-in its Roche lobe and transfers mass to the hot companion (see e.g. Richards & Albright
1999).
Evidence for inter-system matter, emitting and absorbing at H
emission is also a good
diagnostic of inter-system matter in the form of gas streams, transient or classical accretion
disks and rings in mass-transferring binaries like those of the Algol type, in which the cooler
star fills-in its Roche lobe and transfers mass to the hot companion (see e.g. Richards & Albright
1999).
Evidence for inter-system matter, emitting and absorbing at H![]() wavelengths, has been also
recently reported by Marino et al. (2001) for HR 7428, a long-period, detached
atypical RS CVn binary composed of a bright K-type giant and an A-type star.
Furthermore, extended, prominence-like structures producing extra-absorption at H
wavelengths, has been also
recently reported by Marino et al. (2001) for HR 7428, a long-period, detached
atypical RS CVn binary composed of a bright K-type giant and an A-type star.
Furthermore, extended, prominence-like structures producing extra-absorption at H![]() wavelength have been detected in some eclipsing RS CVn systems by Hall & Ramsey (1992) and by
Frasca et al. (2000a).
wavelength have been detected in some eclipsing RS CVn systems by Hall & Ramsey (1992) and by
Frasca et al. (2000a).
|
The two components of ER Vul, even if classified as G0V and G5V (Northcott & Bakos 1956),
should have effective
temperatures much closer to each other, as can be inferred from a recent light curve solution
(Ibanoglu et al. 1993) which gives values of
![]() K for the
primary and secondary component, respectively. For main-sequence stars these temperatures correspond to
F9V and G0V spectral types, respectively, according to the calibration reported by Gray (1992).
K for the
primary and secondary component, respectively. For main-sequence stars these temperatures correspond to
F9V and G0V spectral types, respectively, according to the calibration reported by Gray (1992).
For this reason we have chosen 72 Her as a reference inactive star to simulate both components
of the system. 72 Her is a G0V star with a very low activity degree, as can be deduced from
the low value of the Ca II S index of the Mt. Wilson spectrophotometer (Duncan et al. 1991)
and from the low H![]() residual flux, in comparison with other single G stars (Herbig 1984).
residual flux, in comparison with other single G stars (Herbig 1984).
We have taken many exposures of 72 Her, and we have chosen, for each observing
run, the best spectrum as template.
In order to reproduce the shape of the H![]() line, the template spectrum must be broadened
to simulate the rotation of the ER Vul components.
Hill et al. (1990) have measured
line, the template spectrum must be broadened
to simulate the rotation of the ER Vul components.
Hill et al. (1990) have measured ![]() 's of both component of ER Vul from the FWHM of the
peaks that they produce in the cross-correlation function, and found average values of
81 km s-1 for the primary component and 71 km s-1 for the secondary one.
We have checked the consistency of these measurements with the values of the projected rotational
velocity that can be deduced from the photometric and orbital solution in the hypothesis that
both star are synchronously rotating. From the fractional radii and system inclination given
by Ibanoglu et al. (1993) and from our own RV solution we find
's of both component of ER Vul from the FWHM of the
peaks that they produce in the cross-correlation function, and found average values of
81 km s-1 for the primary component and 71 km s-1 for the secondary one.
We have checked the consistency of these measurements with the values of the projected rotational
velocity that can be deduced from the photometric and orbital solution in the hypothesis that
both star are synchronously rotating. From the fractional radii and system inclination given
by Ibanoglu et al. (1993) and from our own RV solution we find
![]() km s-1 for
the primary component and
km s-1 for
the primary component and
![]() km s-1 for the secondary one.
These values, that agree fairly well
with those measured by Hill et al. (1990), have been used by us to generate the synthetic spectrum.
km s-1 for the secondary one.
These values, that agree fairly well
with those measured by Hill et al. (1990), have been used by us to generate the synthetic spectrum.
The relative contribution of each component to the observed spectrum has been evaluated through
the radii and effective temperatures listed in Table 3.
We have also taken into account the variation of the relative contributions during the eclipses and
the distortion produced by the eclipses on the line profiles of the eclipsed star following the same
procedure used by Frasca et al. (2000a) for the analysis of AR Lac spectra.
The spectra of the primary and secondary star in the synthetic spectrum have been wavelength shifted
according to our RV solution presented in Sect. 3.
To define the net H![]() emission of the two components we have subtracted to each spectrum
of ER Vul the synthetic one at the corresponding phase.
In the residual spectra, obtained by the subtraction, the absorption lines cancel out and the
excess emission of the two components in the H
emission of the two components we have subtracted to each spectrum
of ER Vul the synthetic one at the corresponding phase.
In the residual spectra, obtained by the subtraction, the absorption lines cancel out and the
excess emission of the two components in the H![]() core appears as a double peak well above
the noise (see Fig. 2).
core appears as a double peak well above
the noise (see Fig. 2).
![\begin{figure}
\par\includegraphics[width=14.2cm,clip]{H3972F2.ps}\end{figure}](/articles/aa/full/2003/10/aah3972/img115.gif) |
Figure 2:
Sample of H |
| Open with DEXTER | |
| HJD | Phase |
|
Error |
|
|
|
| 2 451 000+ | (Å) | (Å) | (Å) | (Å) | ||
| 767.45686 | 0.450 | 0.476 | 0.316 | 0.060 | - | - |
| 768.45267 | 0.876 | 0.490 | 0.648 | 0.086 | 0.551 | 0.810 |
| 769.49284 | 0.367 | 0.490 | 0.409 | 0.083 | 0.358 | 0.500 |
| 771.41592 | 0.121 | 0.490 | 0.558 | 0.078 | 0.490 | 0.723 |
| 772.42660 | 0.569 | 0.490 | 0.189 | 0.100 | - | - |
| 773.40020 | 0.964 | 0.526 | 0.399 | 0.070 | - | - |
| 774.41560 | 0.418 | 0.490 | 0.424 | 0.074 | 0.551 | 0.342 |
| 775.49315 | 0.962 | 0.523 | 0.330 | 0.059 | - | - |
| 776.47593 | 0.370 | 0.490 | 0.537 | 0.088 | 0.487 | 0.586 |
| 777.49082 | 0.823 | 0.490 | 0.549 | 0.125 | 0.414 | 0.772 |
| 806.42552 | 0.272 | 0.490 | 0.514 | 0.102 | 0.526 | 0.620 |
| 807.39765 | 0.664 | 0.490 | 0.554 | 0.083 | 0.354 | 0.837 |
| 808.40410 | 0.106 | 0.490 | 0.547 | 0.077 | 0.520 | 0.518 |
| 809.38623 | 0.513 | 0.426 | 0.387 | 0.043 | - | - |
| 810.44884 | 0.035 | 0.529 | 0.633 | 0.084 | - | - |
| 812.47615 | 0.939 | 0.492 | 0.365 | 0.050 | - | - |
The net equivalent width of the "total'' H![]() emission (
emission (
![]() )
has been evaluated on the
difference spectra integrating along the entire residual emission profile. This cumulative integration has the
drawback to merge the emission contribution of both stars, but it can be done at any phase, even when the two
residual H
)
has been evaluated on the
difference spectra integrating along the entire residual emission profile. This cumulative integration has the
drawback to merge the emission contribution of both stars, but it can be done at any phase, even when the two
residual H![]() lines are too much blended to be separated. The errors on the measured
lines are too much blended to be separated. The errors on the measured
![]() values were
estimated as the product of the inverse of S/N ratio, evaluated in two windows on the right- and left-hand
side of the H
values were
estimated as the product of the inverse of S/N ratio, evaluated in two windows on the right- and left-hand
side of the H![]() line, and the width of the integration range.
line, and the width of the integration range.
![]() values, together with their corresponding heliocentric JD, phase, and spectral weight of
the secondary component (
values, together with their corresponding heliocentric JD, phase, and spectral weight of
the secondary component (![]() ), are listed in Table 4.
), are listed in Table 4.
These
![]() values are relative to the local continuum that is a mixture of the primary and secondary
star spectra whose weights vary during the eclipses, affecting the measured equivalent width.
However, a smooth variation of
values are relative to the local continuum that is a mixture of the primary and secondary
star spectra whose weights vary during the eclipses, affecting the measured equivalent width.
However, a smooth variation of
![]() ,
with a maximum just before phase
,
with a maximum just before phase
![]() can be easily
seen in Fig. 3c.
can be easily
seen in Fig. 3c.
In addition, a slight decrease of
![]() around the ingress of the
primary eclipse can be noticed. Three spectra at about the same phase (
around the ingress of the
primary eclipse can be noticed. Three spectra at about the same phase (
![]() )
obtained in
different nights lead to
)
obtained in
different nights lead to
![]() values in good agreement among themselves, and about 0.3 Å lower
than the other data at near phases. It is interesting to notice that the
values in good agreement among themselves, and about 0.3 Å lower
than the other data at near phases. It is interesting to notice that the
![]() value at phase
value at phase
![]() ,
near the eclipse egress, is not affected by this decrease.
A possible explanation for this behaviour could be that the extended atmosphere of the more active,
secondary star is seen projected against the primary star disk at these phase producing an extra absorption
in the H
,
near the eclipse egress, is not affected by this decrease.
A possible explanation for this behaviour could be that the extended atmosphere of the more active,
secondary star is seen projected against the primary star disk at these phase producing an extra absorption
in the H![]() line.
A similar effect was observed in AR Lac (Frasca et al. 2000a) and in some other RS CVn eclipsing
systems (Hall & Ramsey 1992).
Another possible scenario is the presence of one large active
region on the pole of the primary component that is almost fully occulted during the primary eclipse.
Such a high-latitude structure would not produce any rotational modulation of H
line.
A similar effect was observed in AR Lac (Frasca et al. 2000a) and in some other RS CVn eclipsing
systems (Hall & Ramsey 1992).
Another possible scenario is the presence of one large active
region on the pole of the primary component that is almost fully occulted during the primary eclipse.
Such a high-latitude structure would not produce any rotational modulation of H![]() emission
of the primary component, in agreement with our observations (see next sentences). In addition, the value of
emission
of the primary component, in agreement with our observations (see next sentences). In addition, the value of
![]() at these
phases is nearly equal to that of the secondary star only, taking into account the light ratio,
thus indicating that the emission from the
primary star is either fully absorbed or completely eclipsed.
at these
phases is nearly equal to that of the secondary star only, taking into account the light ratio,
thus indicating that the emission from the
primary star is either fully absorbed or completely eclipsed.
The range of our
![]() variation is between 0.19 and 0.65 Å.
Lázaro & Arévalo (1997) observed
a range of variation of total H
variation is between 0.19 and 0.65 Å.
Lázaro & Arévalo (1997) observed
a range of variation of total H![]() EW from 0.43 Å (near the secondary eclipse) to
0.89 Å (around phase
EW from 0.43 Å (near the secondary eclipse) to
0.89 Å (around phase
![]() ). Notwithstanding the incomplete phase coverage of their observations,
the shape of their H
). Notwithstanding the incomplete phase coverage of their observations,
the shape of their H![]() EW curve, with a maximum around the second quadrature, is a bit different
from our own.
A common feature to both data sets is the decrease of H
EW curve, with a maximum around the second quadrature, is a bit different
from our own.
A common feature to both data sets is the decrease of H![]() emission during the primary eclipse.
Furthermore, they observed a steady decrease of H
emission during the primary eclipse.
Furthermore, they observed a steady decrease of H![]() emission from
emission from
![]() to
to
![]() .
The average value of the H
.
The average value of the H![]() excess EW at phase
excess EW at phase ![]() 0.0 reported by Gunn & Doyle (1997),
0.596 Å, is comparable with the value observed by us around the primary eclipse, with the
exception of our data at phase
0.0 reported by Gunn & Doyle (1997),
0.596 Å, is comparable with the value observed by us around the primary eclipse, with the
exception of our data at phase
![]() for which we found
for which we found
![]() 0.35 Å.
No variation of the residual H
0.35 Å.
No variation of the residual H![]() EW from
EW from
![]() to
to
![]() is visible in their observations.
is visible in their observations.
Unfortunately, we have no photometric light curve obtained simultaneously. Therefore we can not
compare the behaviour of the H![]() emission with that displayed by the photometry.
emission with that displayed by the photometry.
Since H![]() emission from both components has been seen in all spectra in which they are
well resolved, we have extracted the emission EW of each component by a fit of two Gaussians
to the residual H
emission from both components has been seen in all spectra in which they are
well resolved, we have extracted the emission EW of each component by a fit of two Gaussians
to the residual H![]() profile.
profile.
These EWs are measured with respect to the "total'' continuum
that contains the contribution of both stars. In order to obtain the true equivalent width of each
component we have divided these EW values by the contribution to the continuum
of the corresponding star.
These corrected equivalent widths,
![]() and
and
![]() ,
are listed in Table 4
and have been plotted in Figs. 3d, 3e.
Notwithstanding the scatter of data, the secondary component appears to be the more
active and the more variable one, with a maximum emission between phase
,
are listed in Table 4
and have been plotted in Figs. 3d, 3e.
Notwithstanding the scatter of data, the secondary component appears to be the more
active and the more variable one, with a maximum emission between phase
![]() and
and
![]() .
The behaviour of
.
The behaviour of
![]() as a function of phase, displayed in Fig. 3e, follows that
of
as a function of phase, displayed in Fig. 3e, follows that
of
![]() ,
while the primary star shows a nearly constant trend.
,
while the primary star shows a nearly constant trend.
The average intensity of the H![]() emission of the secondary star is
generally greater than the primary one,
by about a factor of 1.5, also taking into account the relative contributions.
The same behaviour was observed by Hill et al. (1990) and by Gunn & Doyle (1997), but the
opposite has been reported by Barden (1985), who found instead
emission of the secondary star is
generally greater than the primary one,
by about a factor of 1.5, also taking into account the relative contributions.
The same behaviour was observed by Hill et al. (1990) and by Gunn & Doyle (1997), but the
opposite has been reported by Barden (1985), who found instead
![]() Å and
Å and
![]() Å, and by Newmark (1990).
Hence the activity levels of the components of ER Vul appear to be variable in time.
Å, and by Newmark (1990).
Hence the activity levels of the components of ER Vul appear to be variable in time.
![\begin{figure}
\par\includegraphics[width=8.8cm,clip]{H3972F3.ps} \end{figure}](/articles/aa/full/2003/10/aah3972/img133.gif) |
Figure 3:
Equivalent width of H |
| Open with DEXTER | |
In this paper we have presented a spectroscopic study of the short-period RS CVn type eclipsing binary ER Vul. We have obtained the orbital elements of the system by analysing the radial velocity curve. The results are in agreement with those obtained by Northcott & Bakos (1957) and by Hill et al. (1990). However, the masses of the components derived by us are larger than those obtained by McLean (1982), but are well consistent with those derived by Northcott & Bakos (1956) and by Hill et al. (1990).
A set of spectra with moderate spectral resolution obtained with a good phase coverage has
allowed us to study the behaviour of the the H![]() line of the components of ER Vul as a
function of orbital phase. We concluded that both components of ER Vul are chromospherically active
stars. However, during our observing run the secondary component appears more active than
the primary.
The same was observed by Hill et al. (1990) and by Gunn & Doyle (1997), but the
opposite behaviour has been reported by Barden (1985) and by Newmark (1990).
Hence the activity levels of the components of ER Vul appear to be variable in time.
line of the components of ER Vul as a
function of orbital phase. We concluded that both components of ER Vul are chromospherically active
stars. However, during our observing run the secondary component appears more active than
the primary.
The same was observed by Hill et al. (1990) and by Gunn & Doyle (1997), but the
opposite behaviour has been reported by Barden (1985) and by Newmark (1990).
Hence the activity levels of the components of ER Vul appear to be variable in time.
A significant result of this work is the detection of variability of the H![]() emission EW
with the orbital phase. The total H
emission EW
with the orbital phase. The total H![]() emission excess,
emission excess,
![]() ,
shows a
maximum around phase
,
shows a
maximum around phase
![]() and a minimum around phase
and a minimum around phase
![]() .
A very similar trend is displayed by the H
.
A very similar trend is displayed by the H![]() emission of the secondary component,
emission of the secondary component,
![]() ,
while a rather flat behaviour is shown by the H
,
while a rather flat behaviour is shown by the H![]() equivalent width of
the primary star,
equivalent width of
the primary star,
![]() ,
as a function of the orbital phase.
These variations could be indicative of the presence of chromospheric active regions on the
secondary component, in addition to an average basic emission.
,
as a function of the orbital phase.
These variations could be indicative of the presence of chromospheric active regions on the
secondary component, in addition to an average basic emission.
A slight decrease of
![]() has been also observed at phases near to the first
contact of the primary eclipse (
has been also observed at phases near to the first
contact of the primary eclipse (
![]() ). An explanation of this effect in terms of
extra-absorption produced by a prominence-like structure connected to the cool secondary
component, similar to that found in other RS CVn systems (Hall & Ramsey 1992;
Frasca et al. 2000a), is proposed.
). An explanation of this effect in terms of
extra-absorption produced by a prominence-like structure connected to the cool secondary
component, similar to that found in other RS CVn systems (Hall & Ramsey 1992;
Frasca et al. 2000a), is proposed.
We have found that the activity levels of the components of ER Vul are variable also on
long time scales so that at different epochs the average activity level of the system appears significantly
different.
We have discussed here the H![]() emission behaviour of ER Vul on a short
time-scale (as the two observing runs in 2000).
Simultaneous photometric and spectroscopic observations are desirable for clarifying the activity
levels of the components and also for better understanding short-time variations of light curve and
spectral lines.
Those observations would also allow a more precise determination of the
location of the active regions in each star.
emission behaviour of ER Vul on a short
time-scale (as the two observing runs in 2000).
Simultaneous photometric and spectroscopic observations are desirable for clarifying the activity
levels of the components and also for better understanding short-time variations of light curve and
spectral lines.
Those observations would also allow a more precise determination of the
location of the active regions in each star.
Acknowledgements
We gratefully aknowledge the referee, Dr. Ribas, for his very useful suggestions. Ö. Çakirli thanks Prof. M. Rodonò for his hospitality and allowance of telescope time for the observations. He is grateful to Turkish Scientific and Research Council of Turkey and for their financial support. He is also grateful to KOSC VAKFI for his educational-background supporting. We are also grateful to Daniela Recupero for the careful reding of the manuscript. This work has been supported by the Italian Ministero dell'Istruzione, Università e Ricerca (MIUR) and by the Regione Sicilia which are gratefully acknowledged. This work was partly-supported by Ege University Science Fund under the project number 2000/FEN/013. This research has made use of the ADS-CDS databases, operated at the CDS, Strasbourg, France.