A&A 399, 39-50 (2003)
DOI: 10.1051/0004-6361:20021600
The 2-10 keV luminosity as a Star Formation Rate indicator
P. Ranalli1 - A. Comastri2 -
G. Setti1
1 - Dipartimento di Astronomia, Università di Bologna,
via Ranzani 1, 40127 Bologna, Italy
2 -
INAF - Osservatorio Astronomico di Bologna,
via Ranzani 1, 40127 Bologna, Italy
Received 30 July 2002 / Accepted 4 November 2002
Abstract
Radio and far infrared luminosities of star-forming
galaxies follow a tight linear relation. Making use of ASCA and
BeppoSAX observations of a well-defined sample of nearby star-forming
galaxies, we argue that tight linear relations hold between the X-ray,
radio and far infrared luminosities. The effect of intrinsic
absorption is investigated taking NGC 3256 as a test case. It is
suggested that the hard X-ray emission is directly related to the Star
Formation Rate. Star formation processes may also account for most of
the 2-10 keV emission from LLAGNs of lower X-ray luminosities (for the
same FIR and radio luminosity). Deep Chandra observations of a
sample of radio-selected star-forming galaxies in the Hubble Deep
Field North show that the same relation holds also at high
(
 )
redshift. The X-ray/radio relations also
allow a derivation of X-ray number counts up to very faint fluxes from
the radio Log N-Log S, which is consistent with current limits and
models. Thus the contribution of star-forming galaxies to the X-ray
background can be estimated.
)
redshift. The X-ray/radio relations also
allow a derivation of X-ray number counts up to very faint fluxes from
the radio Log N-Log S, which is consistent with current limits and
models. Thus the contribution of star-forming galaxies to the X-ray
background can be estimated.
Key words: X-rays: galaxies - radio continuum: galaxies -
galaxies: high-redshift - infrared: galaxies -
galaxies: fundamental parameters - galaxies: starburst
Radio continuum and far infrared (FIR) luminosities of star-forming
galaxies are known to show a tight linear relationship spanning
four orders of magnitude in luminosity
(van der Kruit 1973; De Jong et al. 1985; Condon 1992) and up
to a redshift  1.3 (Garrett 2002). This is interpreted as
due to the presence of massive, young stars embedded in dust: a
fraction of their UV radiation is absorbed by dust grains and
reradiated in the infrared band, while supernova explosions may
accelerate the electrons producing at radio wavelengths the observed
synchrotron emission (Harwit & Pacini 1975; Helou et al. 1985).
Since massive (
1.3 (Garrett 2002). This is interpreted as
due to the presence of massive, young stars embedded in dust: a
fraction of their UV radiation is absorbed by dust grains and
reradiated in the infrared band, while supernova explosions may
accelerate the electrons producing at radio wavelengths the observed
synchrotron emission (Harwit & Pacini 1975; Helou et al. 1985).
Since massive (
 )
stars are short-lived, these
luminosities are assumed to be indicators of the global Star Formation
Rate (SFR) in a galaxy. Following Condon (1992) and
Kennicutt (1998), the relation between SFR (referred to
stars with
)
stars are short-lived, these
luminosities are assumed to be indicators of the global Star Formation
Rate (SFR) in a galaxy. Following Condon (1992) and
Kennicutt (1998), the relation between SFR (referred to
stars with
 )
and radio/FIR luminosities can be written
as:
)
and radio/FIR luminosities can be written
as:
 |
|
|
(1) |
 |
|
|
(2) |
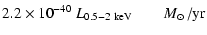
with the FIR flux defined after Helou et al. (1985) as:
 |
(3) |
where
 is in erg s-1 Hz-1, LFIRin erg s-1 and infrared fluxes are in Jy.
Star-forming galaxies are also luminous sources of X-ray emission, due
to a number of High Mass X-ray Binaries (HMXB), young supernova
remnants, and hot plasmas associated to star-forming regions and
galactic winds (Fabbiano 1989). A non linear (
 )
and much scattered (dispersion of about 2 dex)
relation was found between FIR and soft (0.5-3.0 keV) X-ray
luminosities of IRAS-bright and/or interacting/peculiar galaxies
measured by the Einstein satellite (Griffiths & Padovani 1990). A somewhat
different result was found by David et al. (1992), i.e. a linear relation
between FIR and 0.5-4.5 keV luminosities for a sample of starburst
galaxies observed by Einstein. A large number of upper limits to
the X-ray flux (12 upper limits vs. 11 detections for Griffiths & Padovani 1990)
along with high uncertainties in the X-ray and FIR fluxes may explain
this discrepancy. Moreover, these studies suffered by the lack of
knowledge about spectral shapes and internal absorption in star
forming galaxies caused by the limited sensitivity and spectral
capabilities of the IPC detector onboard Einstein.
)
and much scattered (dispersion of about 2 dex)
relation was found between FIR and soft (0.5-3.0 keV) X-ray
luminosities of IRAS-bright and/or interacting/peculiar galaxies
measured by the Einstein satellite (Griffiths & Padovani 1990). A somewhat
different result was found by David et al. (1992), i.e. a linear relation
between FIR and 0.5-4.5 keV luminosities for a sample of starburst
galaxies observed by Einstein. A large number of upper limits to
the X-ray flux (12 upper limits vs. 11 detections for Griffiths & Padovani 1990)
along with high uncertainties in the X-ray and FIR fluxes may explain
this discrepancy. Moreover, these studies suffered by the lack of
knowledge about spectral shapes and internal absorption in star
forming galaxies caused by the limited sensitivity and spectral
capabilities of the IPC detector onboard Einstein.
Here, with the high sensitivity and the broad-band spectral
capabilities of the ASCA and BeppoSAX satellites, we extend these
studies to the 2-10 keV band which is essentially free from
absorption. In the following paragraphs a sample of nearby star
forming galaxies is assembled (§2) and linear
relations among radio, FIR and both soft and hard X-ray luminosities
are found (§3). Possible biases are
discussed and the use of X-ray luminosities as a SFR indicator is
proposed (§4). In §5 we present a
study of star-forming galaxies in the Hubble Deep Field North and test
the validity of the X-ray SFR law. Implications for the contribution
of star-forming galaxies to the X-ray counts and background are
discussed in §6.
Throughout this paper, we assume H0=50 and q0=0.1.
2 The local sample
The atlas of optical nuclear spectra by Ho et al. (1997)
(hereafter HFS97) represents a complete spectroscopic survey of
galaxies in the Revised Shapley-Ames Catalog of Bright Galaxies
(RSA; Sandage & Tammann 1981) and in the Second Reference Catalogue
of bright galaxies (RC2; de Vaucouleurs et al. 1976) with declination
 and magnitude BT<12.5. Optical spectra are classified in
HFS97 on the basis of line intensity ratios according to
Veilleux & Osterbrock (1987); galaxies with nuclear line ratios typical of
star-forming systems are labeled as "H II nuclei''.
This sample of H II galaxies contains only spirals and irregulars from Sa
to later types, except for a few S0 which were excluded from our
analysis since their properties resemble more those of elliptical
galaxies.
and magnitude BT<12.5. Optical spectra are classified in
HFS97 on the basis of line intensity ratios according to
Veilleux & Osterbrock (1987); galaxies with nuclear line ratios typical of
star-forming systems are labeled as "H II nuclei''.
This sample of H II galaxies contains only spirals and irregulars from Sa
to later types, except for a few S0 which were excluded from our
analysis since their properties resemble more those of elliptical
galaxies.
A cross-correlation of the HFS97 sample with the ASCA
archive gives 18 galaxies clearly detected in the 2-10
keV band with the GIS instruments. Four additional objects in
the field of view of ASCA observations were not detected: the 2-10 keV flux upper limits are too loose to add any significant
information, and thus we did not include them in the sample.
The cross-correlation of the HFS97 sample with the BeppoSAX archive
does not increase the number of detections. When a galaxy was observed
by both satellites, we chose the observation with better quality data.
Far infrared fluxes at 60  and 100
were taken from the IRAS
Revised Bright Galaxy Sample (RBGS, Mazzarella et al., in
preparation) which is a reprocessing of the final IRAS archive with
latest calibrations. While the RBGS measurements should be more
accurate, we checked that the use of the older catalogue of IRAS
observations of large optical galaxies
and 100
were taken from the IRAS
Revised Bright Galaxy Sample (RBGS, Mazzarella et al., in
preparation) which is a reprocessing of the final IRAS archive with
latest calibrations. While the RBGS measurements should be more
accurate, we checked that the use of the older catalogue of IRAS
observations of large optical galaxies![[*]](/icons/foot_motif.gif) by
Rice et al. (1988), coupled with the Faint Source Catalogue (FSC,
Moshir et al. 1989) for smaller galaxies, does not significantly change our
statistical analysis. FIR fluxes for NGC 4449 were taken from
Rush et al. (1993). Radio (1.4 GHz) fluxes were
obtained from the Condon et al. (1990, 1996)
catalogues (except for NGC 4449, taken from Haynes et al. 1975).
Distances were taken from Tully (1988) and corrected for the adopted
cosmology.
by
Rice et al. (1988), coupled with the Faint Source Catalogue (FSC,
Moshir et al. 1989) for smaller galaxies, does not significantly change our
statistical analysis. FIR fluxes for NGC 4449 were taken from
Rush et al. (1993). Radio (1.4 GHz) fluxes were
obtained from the Condon et al. (1990, 1996)
catalogues (except for NGC 4449, taken from Haynes et al. 1975).
Distances were taken from Tully (1988) and corrected for the adopted
cosmology.
Part of the X-ray data have already been published; in the cases where
published data were not available in a form suitable for our analysis,
the original data were retrieved from the archive and reduced following
standard procedures and with the latest available calibrations.
Images and spectra were extracted from the pipeline-screened event
files. The images were checked against optical (Digital Sky Survey)
and, where available, radio (1.4 GHz) images in order to look for
possible source confusions. Fluxes were calculated in the 0.5-2.0 and
2-10 keV bands from best-fit spectra for the GIS2 and GIS3
instruments and corrected for Galactic absorption only. The uncertainty
on the fluxes is of the order of 10 .
Depending on
the quality of data, the best-fit spectrum is usually represented by a
two-component model with a thermal plasma plus a power-law or just a
power-law.
.
Depending on
the quality of data, the best-fit spectrum is usually represented by a
two-component model with a thermal plasma plus a power-law or just a
power-law.
The galaxy IC 342 has shown some variability, mainly due to a burst
in 1993 of an ultraluminous X-ray binary. M 82 is also a variable
source. For each galaxy we summarize
in the Appendix the results from several X-ray observations and
estimate a time-averaged luminosity.
One object
(M 33) was not included in the sample since its broad-band
(0.5-10 keV) X-ray nuclear spectrum is dominated by a strong variable
source (M 33 X-8) identified as a black hole candidate
(Parmar et al. 2001).
Therefore, our sample (hereafter local sample) consists of the 17
galaxies listed in Table 1. Since it is not complete in
a strict sense due to the X-ray selection, we have checked for its
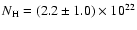
representativeness with reference to the SFR. The median SFR values
for HFS97 is
 1.65
1.65  /yr. Considering
objects with
/yr. Considering
objects with
 there are 14 galaxies in the
local sample out of 98 in HFS97 (14), while there are 3 objects
with
there are 14 galaxies in the
local sample out of 98 in HFS97 (14), while there are 3 objects
with
 (3). Thus the high luminosity tail
is better sampled than the low luminosity one.
(3). Thus the high luminosity tail
is better sampled than the low luminosity one.
We also include data for 6 other well-known starburst
galaxies which were not in the HFS97 survey because they are in the
southern emisphere. On the basis of their line intensity ratios
they should be classified as H II
nuclei. In Table 1 we label them as supplementary
sample.
Table 1:
Data for galaxies in our local samples. All galaxies were observed with
ASCA, except those marked with * observed by BeppoSAX.
Distances in Mpc;
X-ray fluxes in 10-13 erg s-1 cm-2, FIR fluxes in
10-9 erg s-1 cm-2 and radio fluxes in Jy; X-ray luminosities in
1040 erg s-1, FIR luminosities in 1043 erg s-1and radio luminosities in 1029 erg s-1 Hz-1. The uncertainty
on fluxes and luminosities is of the order of 10.
References: 1. Cappi et al. (1999); 2. Della Ceca et al. (1996);
3. Della Ceca et al. (1999); 4. Zezas et al. (1998); 5. Della Ceca et al. (1997);
6. Dahlem et al. (1998); 7. Moran et al. (1999); 8. Sansom et al. (1996).
|
FLUXES AND LUMINOSITIES: MAIN SAMPLE |
|
GALAXY |
D |
F0.5-2 |
L0.5-2 |
F2-10 |
L2-10 |
FFIR |
LFIR |
F1.4 |
L1.4 |
Refs. |
M 82* |
7.8 |
97 |
7.1 |
290 |
21 |
67 |
49 |
7.7 |
5.6 |
1 |
| M 101 |
8.1 |
5.4 |
0.42 |
6.8 |
0.54 |
6.0 |
4.7 |
0.75 |
0.59 |
this work |
| M 108 |
21 |
4.4 |
2.3 |
6.0 |
3.2 |
2.0 |
11 |
0.31 |
1.63 |
this work |
| NGC 891 |
14 |
8.3 |
2.1 |
19 |
4.8 |
4.5 |
11 |
0.70 |
1.74 |
this work
|
| NGC 1569 |
2.4 |
5.4 |
0.037 |
2.2 |
0.015 |
2.5 |
0.17 |
0.41 |
0.028 |
2 |
| NGC 2146 |
26 |
8.2 |
6.5 |
11 |
9.0 |
7.3 |
59 |
1.1 |
8.7 |
3 |
| NGC 2276 |
55 |
2.1 |
7.6 |
4.4 |
16 |
0.85 |
31 |
0.28 |
10 |
this work |
| NGC 2403 |
6.3 |
16 |
0.77 |
9.3 |
0.44 |
2.7 |
1.3 |
0.33 |
0.16 |
this work
|
| NGC 2903 |
9.4 |
7.9 |
0.84 |
7.0 |
0.74 |
3.7 |
4.0 |
0.41 |
0.43 |
this work |
| NGC 3310 |
28 |
7.4 |
6.9 |
2.1 |
2.0 |
1.7 |
16 |
0.38 |
3.6 |
4 |
| NGC 3367 |
64 |
1.8 |
8.7 |
1.6 |
7.9 |
0.38 |
19 |
0.10 |
4.9 |
this work |
| NGC 3690 |
69 |
5.7 |
33 |
11 |
62 |
5.3 |
310 |
0.66 |
38 |
4
|
| NGC 4449 |
4.5 |
8.3 |
0.20 |
4.8 |
0.12 |
1.9 |
0.47 |
0.6 |
0.1 |
5 |
| NGC 4631 |
10 |
9.4 |
1.2 |
9.3 |
1.2 |
4.9 |
6.2 |
1.2 |
1.5 |
6 |
| NGC 4654 |
25 |
0.6 |
0.4 |
0.9 |
0.66 |
0.93 |
7.1 |
0.12 |
0.89 |
this work |
| NGC 6946 |
8.2 |
30 |
2.5 |
12 |
0.97 |
7.9 |
6.4 |
1.4 |
1.1 |
this work |
| IC 342 |
5.9 |
18 |
0.73 |
110 |
4.4 |
11 |
4.4 |
2.3 |
0.92 |
this work |
|
SUPPLEMENTARY SAMPLE |
|
NGC 55 |
1.9 |
18 |
0.082 |
6.8 |
0.031 |
4.7 |
0.21 |
0.38 |
0.017 |
6 |
| NGC 253* |
4.5 |
25 |
0.59 |
50 |
1.2 |
49 |
12 |
5.6 |
1.3 |
1 |
| NGC 1672 |
22 |
5.8 |
3.2 |
6.1 |
3.4 |
2.3 |
13 |
0.45 |
2.5 |
this work |
| NGC 1808 |
16 |
6.5 |
2.0 |
7.6 |
2.4 |
5.3 |
17 |
0.52 |
1.6 |
this work |
| NGC 3256 |
56 |
9.0 |
34 |
6.2 |
23 |
4.8 |
180 |
0.66 |
25 |
7 |
| Antennae |
38 |
7.2 |
13 |
5.3 |
9.2 |
2.6 |
45 |
0.57 |
9.9 |
8 |
3 The radio/FIR/X-rays correlation
![\begin{figure}
\par\mbox{ \includegraphics[width=8.7cm,clip]{h3889f1a.eps} \hspace*{2.5mm}
\includegraphics[width=8.7cm,clip]{h3889f1b.eps} }
\end{figure}](/articles/aa/full/2003/07/aah3889/Timg29.gif) |
Figure 1:
The 0.5-2.0 keV luminosity of local star-forming galaxies
vs. radio and FIR ones.
Squares: local sample; crosses: supplementary sample;
dotted lines: Eqs. (8), (9). |
| Open with DEXTER |
As a preliminary test, we perform a least-squares analysis for the
well-known radio/FIR correlation, which yields
 |
(4) |
The dispersion around the best-fit relation is given as the
estimate s of the standard deviation  :
:
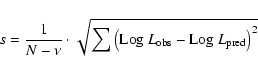 |
(5) |
where  is the number of free parameters, N is the number of points in the fit,
 is the luminosity expected from the best fit
relation and
is the luminosity expected from the best fit
relation and
 the observed one.
For the radio/FIR correlation
(Eq. (4)) we find s=0.18.
the observed one.
For the radio/FIR correlation
(Eq. (4)) we find s=0.18.
Following Helou et al. (1985) we also calculate the mean ratio
q between the logarithms of FIR and radio fluxes, obtaining
 .
This value is consistent
with the mean
.
This value is consistent
with the mean
 for the 1809 galaxies in
the IRAS 2 Jy sample by Yun et al. (2001).
for the 1809 galaxies in
the IRAS 2 Jy sample by Yun et al. (2001).
A test for the soft X-ray/FIR/radio relations
(Fig. 1) yields
with
 and 0.24 respectively.
Our result is consistent with the
 relation found by
David et al. (1992) for normal and
starburst galaxies from the IRAS Bright Galaxy Sample, but it is only
marginally consistent with the much flatter and more dispersed
relationship obtained by Griffiths & Padovani (1990) for a sample of IRAS selected
galaxies (
relation found by
David et al. (1992) for normal and
starburst galaxies from the IRAS Bright Galaxy Sample, but it is only
marginally consistent with the much flatter and more dispersed
relationship obtained by Griffiths & Padovani (1990) for a sample of IRAS selected
galaxies (
 )
and
for a sample of starburst/interacting galaxies (
)
and
for a sample of starburst/interacting galaxies (
 ).
).
The inclusion of the objects of the supplementary sample (Table
1) does not significantly change
the slopes, i.e.
 ;
likewise, if we use the
;
likewise, if we use the  luminosity
instead of FIR, we obtain
luminosity
instead of FIR, we obtain
 .
.
By assuming an exactly linear slope, the best fit relations
for the local (local+supplementary) sample become:
with
 and 0.24 respectively.
By applying an F-test we find that the free-slope fits are not
significantly better than those with the linear slope, the improvement
being significant only at the  level.
![\begin{figure}
\par\mbox{\includegraphics[width=8.7cm,clip]{h3889f2a.eps} \hspace*{2.5mm}
\includegraphics[width=8.7cm,clip]{h3889f2b.eps} }
\end{figure}](/articles/aa/full/2003/07/aah3889/Timg52.gif) |
Figure 2:
The 2.0-10 keV luminosity of local star-forming galaxies
vs. radio and FIR ones. Symbols as in Fig. 1;
dotted lines: Eqs. (12), (13).
|
| Open with DEXTER |
In Fig. 2 we plot 2-10 keV luminosities
versus FIR and radio ones. Least-squares fits yield:
with
 and 0.29 respectively. The linearity
and the dispersion are not significantly changed neither by the
inclusion of the supplementary sample (
and 0.29 respectively. The linearity
and the dispersion are not significantly changed neither by the
inclusion of the supplementary sample (
 and
and
 ,
and 0.26 respectively), nor by the use of the luminosity (
,
and 0.26 respectively), nor by the use of the luminosity (
 ).
).
By assuming an exactly linear slope, the best fit relations
for the local (local+supplementary) sample become:
with
 for both fits. There is no significant improvement
(less than )
in the free-slope fits with respect to the linear slope ones.
for both fits. There is no significant improvement
(less than )
in the free-slope fits with respect to the linear slope ones.
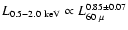
4 X-rays and the Star Formation Rate
The existence of a tight linear relation implies that the three
considered bands all carry the same information. Since the radio and
far infrared luminosities are indicators of the SFR, the 0.5-2 keV and
2-10 keV luminosities should also be SFR indicators.
However, before attempting to calibrate such relationships, we should
consider the possible existence of selection effects.
Ho et al. (1995) made a special effort in obtaining nuclear nebular
spectra, so that a reliable spectral classification of the central
engine could be derived. The main concern is the possibility that
the H II galaxies in the HFS97 sample could host a Low Luminosity AGN
(LLAGN), which might significantly contribute to the overall energy
output. To check for this possibility, Ulvestad & Ho (2002) observed with
the VLA at 1.4 GHz a complete sample of 40 Sc galaxies in HFS97 with H II spectra and did not find any compact luminous radio
core. Instead, they found that the radio powers and morphologies are
consistent with star formation processes rather than by
accretion onto massive black holes; thus they suggest that H II nuclei
intrinsically lack AGN. Therefore we believe that the
HFS97 classification is reliable and that our sample is not polluted
by AGN.
![\begin{figure}
\par\includegraphics[width=8.8cm,clip]{h3889f3.ps} \end{figure}](/articles/aa/full/2003/07/aah3889/Timg63.gif) |
Figure 3:
2.0-10 keV vs. FIR luminosities of star-forming galaxies
and LLAGN. Filled triangles: LINERs, filled circles: Seyfert galaxies.
Open symbols as in Fig. 1;
line: Eq. (12).
|
| Open with DEXTER |
It is also worth noticing that the soft X-rays relationships may
involve some further uncertainties related to the possible presence of
intrinsic absorption (negligible in the 2-10 keV band for
column densities usually found in normal galaxies). An example of
this effect is the southern nucleus of NGC 3256 (see the Appendix), a
dusty luminous merger remnant with two bright radio-IR cores where
star formation is ongoing: while both of them fall on the
radio/hard X-ray relation, only the northern core is on the
radio/soft X-ray relation because the southern one lies behind a dust
lane which absorbes at all wavelengths from 1 to 2 keV. The quasi-linearity of the soft X-ray relations suggests that
absorption is unlikely to be relevant for the majority of the objects in
our sample; however this effect may become significant at
cosmological distances (
to 2 keV. The quasi-linearity of the soft X-ray relations suggests that
absorption is unlikely to be relevant for the majority of the objects in
our sample; however this effect may become significant at
cosmological distances (
 )
where galaxies have more dust
and gas at their disposal to form stars.
)
where galaxies have more dust
and gas at their disposal to form stars.
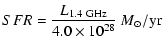
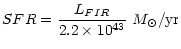
Thus we feel confident to propose the use of X-ray luminosities
as SFR indicators. From Eqs. (8), (9), (12), (13) we derive:
| SFR |
= |
 |
(14) |
| SFR |
= |
 |
(15) |
We also notice that there is growing evidence that star formation could play
a major role even among those objects classified as LLAGN. The preliminary results of the
Chandra LLAGN survey (Ho et al. 2001) show that only about one third
of LLAGN have a compact nucleus dominating the X-ray emission, while
in the remaining objects off-nuclear sources and diffuse emission
significantly contribute to the overall emission.
Following this investigation, we have analyzed the relations
between radio/FIR/X-ray luminosities for the spiral galaxies in the
Terashima et al. (2002) sample of LLAGN, drawn from HFS97 and observed with
ASCA, comprising 7 LINERs and 15 Seyfert's with
 erg s-1. We find that
the X-ray/FIR and X-ray/radio luminosity ratios generally exceed those
of star-forming galaxies, but about one third of the objects have ratios
falling on the same locus of the star-forming galaxies
(Fig. 3). Therefore, the nuclear X-ray emission of
these last LLAGN must be comparable to or weaker than the emission from
star formation related processes. Moreover, the infrared (IRAS band)
colours of these objects are also similar to those of star-forming
galaxies, and completely different from those of QSOs,
thus suggesting that the FIR luminosities of LLAGN may be powered by
star formation.
erg s-1. We find that
the X-ray/FIR and X-ray/radio luminosity ratios generally exceed those
of star-forming galaxies, but about one third of the objects have ratios
falling on the same locus of the star-forming galaxies
(Fig. 3). Therefore, the nuclear X-ray emission of
these last LLAGN must be comparable to or weaker than the emission from
star formation related processes. Moreover, the infrared (IRAS band)
colours of these objects are also similar to those of star-forming
galaxies, and completely different from those of QSOs,
thus suggesting that the FIR luminosities of LLAGN may be powered by
star formation.
5 Star-forming galaxies in the Hubble Deep Field
The 1 Ms Chandra (Brandt et al. 2001) and the radio (8.4 GHz:
Richards et al. 1998; 1.4 GHz: Richards 2000 and Garrett 2000)
catalogues of the Hubble Deep Field North (HDFN) reach a
limiting flux which is deep enough to detect star-forming galaxies at
redshifts up to  ,
and can be used to check whether the
radio/X-ray relation holds also for distant galaxies.
,
and can be used to check whether the
radio/X-ray relation holds also for distant galaxies.
We searched for X-ray counterparts of radio sources in the the
Richards et al. (1998) catalogue which contains optical and IR identifications
allowing the selection of candidate star-forming galaxies. Our
selection criterium has been to include all galaxies with Spiral or
Irregular morphologies, known redshifts and no AGN signatures in their
spectra (from Richards et al. 1998 or Cohen et al. 2000).
The mean positional uncertainties of both Chandra (for on-axis
sources) and the VLA are 0.3
 ,
which added in quadrature
give 0.5
.
Using this value as the encircling radius for
coordinate matching 5 galaxies are found. However, there are two
effects that can increase this value:
,
which added in quadrature
give 0.5
.
Using this value as the encircling radius for
coordinate matching 5 galaxies are found. However, there are two
effects that can increase this value:
- 1.
- the shape and width of the Chandra PSF strongly depend on
the off-axis and azimutal angles. Since the 1 Ms HDFN data consist of 12
observations with different pointing directions and position angles,
there is no unique PSF model even for near on-axis sources;
- 2.
- a displacement of several kpc between the brightest
radio and X-ray positions, induced e.g. by an ultraluminous X-ray binary
placed in a spiral arm and dominating the X-ray emission.
Thus, by making cross-correlations with increasing encircling radii we found
that the number of coincidences increases up to a radius
of
 (which yields 7 matchings). There are no further coincidences
up to a radius of several arcsecs, indicating that the sample should not
be contamined by chance coincidences. The 7 selected objects are
listed in Table 2.
Fluxes at 1.4 GHz and spectral slopes were retrieved from
Richards (2000) in 6 cases, and from Garrett (2000) in one case.
(which yields 7 matchings). There are no further coincidences
up to a radius of several arcsecs, indicating that the sample should not
be contamined by chance coincidences. The 7 selected objects are
listed in Table 2.
Fluxes at 1.4 GHz and spectral slopes were retrieved from
Richards (2000) in 6 cases, and from Garrett (2000) in one case.
![\begin{figure}
\par\includegraphics[width=8.8cm,clip]{h3889f4.eps}
\end{figure}](/articles/aa/full/2003/07/aah3889/Timg71.gif) |
Figure 4:
Observer's-frame hardness ratios for galaxies in the HDFN;
there are only upper limits since none is detected in the 2-8 keV band
(Brandt et al. 2001).
The dotted lines show the loci for power-law spectra with slope
 and
different intrinsic rest-frame absorption; the dashed lines are for spectra of different
slopes and no intrinsic absorption.
and
different intrinsic rest-frame absorption; the dashed lines are for spectra of different
slopes and no intrinsic absorption. |
| Open with DEXTER |
While rest-frame 0.5-2.0 and 2.0-10 keV luminosities could be
obtained by K-correcting the observer's frame counts, this would imply
the assumption of a spectral shape; but none of the seven deep field
galaxies is individually detected in the hard band, so that any
constraint on their spectra obtained with the use of a hardness ratio
diagram is too loose to be significant (Fig. 4).
However this problem may be partially circumvented by resizing the
X-ray bands in the observer's frame according to the redshift of the objects.
It is therefore possible to give better constraints to the
spectrum of the deep field galaxies and derive better estimates of
their luminosities.
Thus we redefine the soft and hard
bands as
the [0.5; 2.0/(1+z)] and [2.0/(1+z); 10/(1+z)] intervals,
respectively. Another advantage of this procedure is that the higher
the redshift, the more akin the new hard band is to the zone of
maximum sensitivity of Chandra ( keV). Note that since the
ACIS-I detector has almost no sensitivity below 0.5 keV, we fixed this
energy as the lower limit for count extraction. For the two highest
redshift galaxies, this reduces the soft band to 0.5-0.9 keV, still
significantly larger than the ACIS-I energy resolution (
keV). Note that since the
ACIS-I detector has almost no sensitivity below 0.5 keV, we fixed this
energy as the lower limit for count extraction. For the two highest
redshift galaxies, this reduces the soft band to 0.5-0.9 keV, still
significantly larger than the ACIS-I energy resolution (
 eV).
eV).
We extracted counts in circular regions around our selected targets
(radius 5 pixels); background was taken in annuli surrounding the
targets. The net counts did not show dependence on the choice of
background regions; they were converted in count rates with the
exposure times listed in the Brandt et al. (2001) catalogue. Counts and
rates are reported in Table 3. Best-fit slopes
reproducing the soft/hard count ratio were derived by assuming a
power-law spectrum with Galactic absorption. We find that six objects
have spectral slopes falling in the range
 -2.7(Table 3). To check whether these spectra are consistent
with those of the galaxies in the local sample we calculated the
observed soft/hard flux ratio for galaxies in the local sample: the
median value for this flux ratio is 0.95 leading to a slope
-2.7(Table 3). To check whether these spectra are consistent
with those of the galaxies in the local sample we calculated the
observed soft/hard flux ratio for galaxies in the local sample: the
median value for this flux ratio is 0.95 leading to a slope
 .
The count ratios for each of the six deep field
galaxies are consistent within 1-2
with the
slope. The remaining source (#194 in Table 3, at
z=1.275) has an upper limit on the soft X-ray counts and a count
ratio not consistent at the
.
The count ratios for each of the six deep field
galaxies are consistent within 1-2
with the
slope. The remaining source (#194 in Table 3, at
z=1.275) has an upper limit on the soft X-ray counts and a count
ratio not consistent at the  level with the unabsorbed
spectrum: it requires an inverted spectrum
(
level with the unabsorbed
spectrum: it requires an inverted spectrum
(
 )
if no absorption is assumed, otherwise, if we assume
,
the intrinsic absorbing column has to be
)
if no absorption is assumed, otherwise, if we assume
,
the intrinsic absorbing column has to be
 cm-2.
cm-2.
![\begin{figure}
\par\mbox{\includegraphics[width=8.7cm,clip]{h3889f5a.ps}\hspace*{2.5mm}
\includegraphics[width=8.7cm,clip]{h3889f5b.ps} }
\end{figure}](/articles/aa/full/2003/07/aah3889/Timg78.gif) |
Figure 5:
The radio/X-ray luminosity relation for galaxies in the Hubble
Deep Field (filled circles). Open squares and crosses: local galaxies
as in Fig. (1); dotted lines:
linear fits for local galaxies (Eq. (9)). The two most luminous galaxies
are at z=1.275 and 1.219 in order of increasing radio luminosity.
The two upper limits (3
level) in the left panel refer to source #194 (see text)
and show the unabsorbed luminosity as estimated with
 and no intrinsic
absorption (lower) and with
and
and no intrinsic
absorption (lower) and with
and
 cm-1 (upper). cm-1 (upper). |
| Open with DEXTER |
With the best-fit slopes we derived soft and hard band fluxes and
luminosities (Fig. 5).
The linear radio/X-ray correlations hold also for the Deep Field galaxies;
the dispersion of the relations given in §3
is not changed by the inclusion of the deep field objects. A similar relation was also found in a recent paper by Bauer et al. (2002).
6 X-ray number counts and background
An estimate of the contribution of star-forming galaxies to the cosmic
X-ray background (XRB) has been attempted several times
(e.g. Bookbinder et al. 1980; Griffiths & Padovani 1990; Moran et al. 1999). The
main purpose for the earlier studies was the possibility to explain
the flatness of the XRB spectrum via the X-ray binaries powering the
X-ray emission of these galaxies. Although AGN have since been
recognized to provide by far the most important contribution to the
XRB (Setti & Woltjer 1989; Comastri et al. 1995), the ongoing deep Chandra and XMM-Newton
surveys offer unique opportunities to both test the AGN models and pin
down the contribution from other kind of sources. Here, making use of
the X-ray/radio relationships of §3, we
perform an estimate of the contribution to the XRB by star-forming
galaxies.
We consider the radio sub-mJy population associated with faint blue
galaxies at high redshifts (
 ,
,
 ;
Windhorst et al. 1990) representing an early era of
star formation in the universe (Haarsma et al. 2000). This strongly
evolving population accounts for the majority of the number counts
below 0.5 mJy (Windhorst et al. 1985) and contribute about half of
the radio cosmic background at 1.4 GHz (Haarsma et al. 2000). The deepest
radio surveys have been performed at 1.4 GHz (Richards 2000), 5 GHz
(Fomalont et al. 1991) and 8.4 GHz (Richards et al. 1998). Although a quick
estimate of the contribution to the XRB may be worked out by simply
applying Eqs. (9), (13) to the total radio
fluxes obtained by integrating over the deepest radio Log N-Log S, it
is instructive to first derive the X-ray source counts and compare
them with the deepest counts obtained by Chandra. In order to
derive the X-ray counts from the radio ones a full knowledge of the
redshift distribution and spectra of the sources would be
required. Under the simplifying assumption that the sub-mJy population
lies at a redshift
;
Windhorst et al. 1990) representing an early era of
star formation in the universe (Haarsma et al. 2000). This strongly
evolving population accounts for the majority of the number counts
below 0.5 mJy (Windhorst et al. 1985) and contribute about half of
the radio cosmic background at 1.4 GHz (Haarsma et al. 2000). The deepest
radio surveys have been performed at 1.4 GHz (Richards 2000), 5 GHz
(Fomalont et al. 1991) and 8.4 GHz (Richards et al. 1998). Although a quick
estimate of the contribution to the XRB may be worked out by simply
applying Eqs. (9), (13) to the total radio
fluxes obtained by integrating over the deepest radio Log N-Log S, it
is instructive to first derive the X-ray source counts and compare
them with the deepest counts obtained by Chandra. In order to
derive the X-ray counts from the radio ones a full knowledge of the
redshift distribution and spectra of the sources would be
required. Under the simplifying assumption that the sub-mJy population
lies at a redshift  ,
so that the K-correction term is the
same for all sources, the differential counts are obtained as:
,
so that the K-correction term is the
same for all sources, the differential counts are obtained as:
 |
(16) |
where n(S) are the differential number counts, and
 is the X-ray
band/1.4 GHz luminosity ratio (Eqs. (9), (13))
which depends on the redshift and on the radio and X-ray spectral indices
via the K-correction:
is the X-ray
band/1.4 GHz luminosity ratio (Eqs. (9), (13))
which depends on the redshift and on the radio and X-ray spectral indices
via the K-correction:
 |
(17) |
Concerning the sub-mJy Log N-Log S, Richards (2000) gives
 deg-2 Jy-1 as a
best-fit to the differential number counts at 1.4 GHz in the range
45-1000, while Fomalont et al. (1991) find
deg-2 Jy-1 as a
best-fit to the differential number counts at 1.4 GHz in the range
45-1000, while Fomalont et al. (1991) find
 at 5 GHZ in the range 16-1500 Jy. The number
density at 4 Jy (as estimated from fluctuation analysis) is
consistent with extrapolation of the 16-1500 Jy slope.
at 5 GHZ in the range 16-1500 Jy. The number
density at 4 Jy (as estimated from fluctuation analysis) is
consistent with extrapolation of the 16-1500 Jy slope.
Table 3:
Data for deep field galaxies (counts, fluxes, luminosities).
 is the
best fit X-ray slope (photon index),
is the
best fit X-ray slope (photon index),  the radio slope (energy index).
Sources are identified via their entry number
in the Brandt et al. (2001) catalogue (cf. Table 2).
X-ray fluxes in 10-17 erg s-1 cm-2, radio fluxes in Jy. X-ray luminosities in
1040 erg s-1, radio luminosities in 1030 erg s-1 Hz-1.
X-ray counts are extracted in redshifted bands (soft band :=0.5-2.0/(1+z) keV,
hard band
:=2.0/(1+z)-8/(1+z) keV). X-ray fluxes and luminosities are in rest-frame
0.5-2.0 and 2.0-10 keV bands, radio ones at rest-frame 1.4 GHz.
For source #194, the absorbed flux and luminosity are quoted. The unabsorbed luminosity
is
the radio slope (energy index).
Sources are identified via their entry number
in the Brandt et al. (2001) catalogue (cf. Table 2).
X-ray fluxes in 10-17 erg s-1 cm-2, radio fluxes in Jy. X-ray luminosities in
1040 erg s-1, radio luminosities in 1030 erg s-1 Hz-1.
X-ray counts are extracted in redshifted bands (soft band :=0.5-2.0/(1+z) keV,
hard band
:=2.0/(1+z)-8/(1+z) keV). X-ray fluxes and luminosities are in rest-frame
0.5-2.0 and 2.0-10 keV bands, radio ones at rest-frame 1.4 GHz.
For source #194, the absorbed flux and luminosity are quoted. The unabsorbed luminosity
is
 erg s-1.
|
|
The mean radio spectral index is in the range
 -0.7.
Fomalont et al. (1991) report their distribution as having a moda of
-0.7.
Fomalont et al. (1991) report their distribution as having a moda of
 ,
a median of
,
a median of
 ,
and an average of
,
and an average of
 (indices measured between 1.5 and 5 GHz). From
Richards (2000) data we find an average
(indices measured between 1.5 and 5 GHz). From
Richards (2000) data we find an average
 (between 1.4 and
8.4 GHz), when we consider detections at both frequencies, and
(between 1.4 and
8.4 GHz), when we consider detections at both frequencies, and
 when we consider only detections at 1.4 GHz and treat
upper-limits at 8.4 GHz as detections. The latter, steeper slope is
also more consistent with the average index of our HDFN sample (Table
3). Here we assume
,
and estimate the
uncertainty in the K-correction due to the radio spectral index to be
around a
when we consider only detections at 1.4 GHz and treat
upper-limits at 8.4 GHz as detections. The latter, steeper slope is
also more consistent with the average index of our HDFN sample (Table
3). Here we assume
,
and estimate the
uncertainty in the K-correction due to the radio spectral index to be
around a  .
.
According to the results of §5, we further assume an
average X-ray spectral slope
.
For the sake of simplicity
we also assume that the objects are placed at
 ,
the mean redshift
for the sub-mJy galaxies which, according to Windhorst et al. (1990),
are distributed in the redshift interval 0.5-1.5 with a peak at
,
the mean redshift
for the sub-mJy galaxies which, according to Windhorst et al. (1990),
are distributed in the redshift interval 0.5-1.5 with a peak at
 .
To estimate the effect on the counts due to the actual distribution
of the sources in this redshift interval we consider a simplified case
in which they are equally distributed at redshifts z=0.5, 1.0 and 1.5. Since
the effect enters in the computations via the K-correction term, we find
that the predicted number counts would increase by only 10%. As a
last remark we notice that a fraction, as yet undefined, of the X-ray
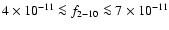
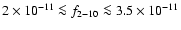
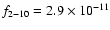
spectra might steepen at energies
.
To estimate the effect on the counts due to the actual distribution
of the sources in this redshift interval we consider a simplified case
in which they are equally distributed at redshifts z=0.5, 1.0 and 1.5. Since
the effect enters in the computations via the K-correction term, we find
that the predicted number counts would increase by only 10%. As a
last remark we notice that a fraction, as yet undefined, of the X-ray
spectra might steepen at energies  10 keV, thus entailing a decrease in the
predicted source counts; however, given the redshift range under consideration,
the predicted soft X-ray source counts should not be affected.
10 keV, thus entailing a decrease in the
predicted source counts; however, given the redshift range under consideration,
the predicted soft X-ray source counts should not be affected.
![\begin{figure}
\par\mbox{ \includegraphics[width=8.7cm,clip]{h3889f6a.ps}\hspace*{2.5mm}
\includegraphics[width=8.7cm,clip]{h3889f6b.ps} }
\end{figure}](/articles/aa/full/2003/07/aah3889/Timg99.gif) |
Figure 6:
X-ray counts derived from deep radio Log N-Log S.
The short-dashed lines
represent the 1.4 GHz Log N-Log S (Richards 2000) with
K-corrections assuming  ,
and
.
The long-dashed lines represent the
Log N-Log S by Fomalont et al. (1991) reported at 1.4 GHz with
(K-corrections like for the 1.4 GHz
one). The dots are the observed X-ray number counts in the HDFN
(Brandt et al. 2001); while the horn-shaped symbols show the results from X-ray fluctuation
analysis (Miyaji & Griffiths 2002a,b). The dot-dashed line
shows the number counts from AGN synthesis models
(Comastri et al. 1995). The vertical dotted lines show the limiting
sensitivities for the radio surveys. The total of AGN plus galaxy counts
predicted from the radio counts of Richards (2000) and Fomalont et al. (1991)
are also shown with short and long dashed lines, respectively. ,
and
.
The long-dashed lines represent the
Log N-Log S by Fomalont et al. (1991) reported at 1.4 GHz with
(K-corrections like for the 1.4 GHz
one). The dots are the observed X-ray number counts in the HDFN
(Brandt et al. 2001); while the horn-shaped symbols show the results from X-ray fluctuation
analysis (Miyaji & Griffiths 2002a,b). The dot-dashed line
shows the number counts from AGN synthesis models
(Comastri et al. 1995). The vertical dotted lines show the limiting
sensitivities for the radio surveys. The total of AGN plus galaxy counts
predicted from the radio counts of Richards (2000) and Fomalont et al. (1991)
are also shown with short and long dashed lines, respectively. |
| Open with DEXTER |
The X-ray number counts predicted
with the above assumptions (i.e.
,
)
from Richards (2000) and
Fomalont et al. (1991) Log N-Log S are shown in Fig. 6,
along with observed counts from Brandt et al. (2001), limits from
fluctuation analysis (Miyaji & Griffiths 2002a,b) and predicted counts
from AGN synthesis models (Comastri et al. 1995). The latter are
essentially in agreement with the results of more recent synthesis
models (Gilli et al. 2001). The extrapolations of the radio Log N-Log S
below 50 Jy and down to a few Jy at 1.4 GHz
(
 erg s-1 cm-2 in the 0.5-2.0 keV band) are
consistent with the limits from fluctuation analysis (Miyaji & Griffiths 2002b)
and do not exceed the X-ray expected number counts. Since
Miyaji & Griffiths (2002b) suggested the emergence of a new population (beyond
that of AGN which dominates at brighter fluxes) in the 0.5-2.0 keV
band at fluxes around 10-17 erg s-1 cm-2, it is
tempting to identify this new population with the sub-mJy galaxies. It
should be noted, however, that Eqs. (9), (13)
may not apply to the entire sub-mJy population. For instance, a
fraction (up to a ,
Haarsma et al. 2000) of the sources may
still present a dominant contribution from an AGN. It follows that the
derived Log N-Log S should be regarded as an upper limit to the X-ray
counts from star-forming galaxies.
erg s-1 cm-2 in the 0.5-2.0 keV band) are
consistent with the limits from fluctuation analysis (Miyaji & Griffiths 2002b)
and do not exceed the X-ray expected number counts. Since
Miyaji & Griffiths (2002b) suggested the emergence of a new population (beyond
that of AGN which dominates at brighter fluxes) in the 0.5-2.0 keV
band at fluxes around 10-17 erg s-1 cm-2, it is
tempting to identify this new population with the sub-mJy galaxies. It
should be noted, however, that Eqs. (9), (13)
may not apply to the entire sub-mJy population. For instance, a
fraction (up to a ,
Haarsma et al. 2000) of the sources may
still present a dominant contribution from an AGN. It follows that the
derived Log N-Log S should be regarded as an upper limit to the X-ray
counts from star-forming galaxies.
As a final remark it should be pointed out that our results depend on
the basic assumption of a strict linearity between the radio and X-ray
luminosities. Had we assumed a non-linear relationship, such as Eq. (7)
for the soft X-rays or Eq. (11) for the 2-10 keV band, we would
have found an increase or decrease, respectively, of about  in the predicted
counts at a flux level around 10-17 erg s-1 cm-2. A larger, well defined
sample of star-forming galaxies down to the faintest radio and X-ray fluxes
would obviously be of great importance to better constrain the X-ray vs. radio
luminosities relationship. It might be argued that a more direct derivation
of the source counts could be made by adopting the observed fluxes, rather
than the luminosities of the objects. However, this procedure would entail
an arbitrary extrapolation of the X-ray/radio flux ratio for almost two
orders of magnitude at fluxes fainter than the Chandra deep field. On the
other hand, the radio luminosity interval of Fig. 5
essentially encompasses
the radio power of the sub-mJy population if placed in the redshift interval
mentioned above.
in the predicted
counts at a flux level around 10-17 erg s-1 cm-2. A larger, well defined
sample of star-forming galaxies down to the faintest radio and X-ray fluxes
would obviously be of great importance to better constrain the X-ray vs. radio
luminosities relationship. It might be argued that a more direct derivation
of the source counts could be made by adopting the observed fluxes, rather
than the luminosities of the objects. However, this procedure would entail
an arbitrary extrapolation of the X-ray/radio flux ratio for almost two
orders of magnitude at fluxes fainter than the Chandra deep field. On the
other hand, the radio luminosity interval of Fig. 5
essentially encompasses
the radio power of the sub-mJy population if placed in the redshift interval
mentioned above.
The derived X-ray number counts can be integrated to estimate
the contribution to the XRB. For the observed 2-10 keV background we
take the XMM-Newton value of
 erg s-1 cm-2(Lumb et al. 2002), which is comprised between the ASCA (Gendreau et al. 1995)
and BeppoSAX (Vecchi et al. 1999) figures. The integration of counts
derived from the 1.4 GHz Log N-Log S (Richards 2000), performed in its
validity range (
erg s-1 cm-2(Lumb et al. 2002), which is comprised between the ASCA (Gendreau et al. 1995)
and BeppoSAX (Vecchi et al. 1999) figures. The integration of counts
derived from the 1.4 GHz Log N-Log S (Richards 2000), performed in its
validity range (
 erg s-1cm-2, corresponding to 45-1000 Jy at 1.4 GHz), yields a
contribution to the XRB of
erg s-1cm-2, corresponding to 45-1000 Jy at 1.4 GHz), yields a
contribution to the XRB of
 erg cm-2 s-1(
 2% of the observed background). By extrapolating to
10-18 erg s-1 cm-2 (1 Jy) the
contribution would increase to
2% of the observed background). By extrapolating to
10-18 erg s-1 cm-2 (1 Jy) the
contribution would increase to
 erg cm-2 s-1(
 ). Integration of counts from the flatter
Fomalont et al. (1991) Log N-Log S in the 1-1000 Jy range yields a
contribution of
). Integration of counts from the flatter
Fomalont et al. (1991) Log N-Log S in the 1-1000 Jy range yields a
contribution of
 erg cm-2 s-1(
 ). We also note that 1 Jy at 1.4 GHz is a limit
  times fainter than the constraint from radio fluctuation
analysis; it is unlikely that the radio Log N-Log S could sustain its
slope below this limit, otherwise the integrated radio emission from
weak sources would diverge (Fomalont et al. 1991).
times fainter than the constraint from radio fluctuation
analysis; it is unlikely that the radio Log N-Log S could sustain its
slope below this limit, otherwise the integrated radio emission from
weak sources would diverge (Fomalont et al. 1991).
We have analyzed a small, but well defined sample of 17 star-forming
galaxies, extracted from the HFS97 catalogue, for which there is a
homogeneous information on optical, FIR, radio and X-ray bands (local
sample). In agreement with previous work (David et al. 1992) we find that
the logarithms of the soft (0.5-2 keV) X-ray luminosities (corrected
for Galactic absorption only) are linearly correlated with the
logarithms of both radio (1.4 GHz) and FIR luminosities. We have
extended our analysis to the harder X-ray band, essentially free from
internal absorption which may affect the soft X-ray fluxes, and found
that there is a tight linear correlation between the X-ray
luminosities in the 2-10 keV interval with both the radio and the FIRluminosities, normally assumed as the indicators of the star formation
rate. The addition of 6 galaxies (supplementary sample) homogeneous
with, but not included in HFS97, does not modify these results.
We conclude that the origin of the hard X-ray emission must be
closely related to star formation and calibrate an X-ray SFR indicator.
Candidate starburst galaxies have been selected in the HDF North, with
redshifts up to
 ,
and their rest-frame X-ray
luminosities are computed by extracting counts in redshifted bands
from the Chandra observation of the HDFN. With this approach we have
shown that the 2-10 keV/radio linear correlation holds up to ,
encompassing five orders of magnitude in luminosity, up to
,
and their rest-frame X-ray
luminosities are computed by extracting counts in redshifted bands
from the Chandra observation of the HDFN. With this approach we have
shown that the 2-10 keV/radio linear correlation holds up to ,
encompassing five orders of magnitude in luminosity, up to
 several 1042 erg s-1 and a corresponding
star formation rate 1000
yr-1. The fit to
the 0.5-2.0 keV/radio data is also linear up to .
However,
the count ratio for the highest redshift galaxy at z=1.275 requires
significant absorption if a spectral slope of
is
assumed; thus this galaxy shows, on a larger scale, the same behaviour
as that of the southern core in NGC 3256 (see the appendix).
Therefore, while the linearity of the relations involving soft X-ray
luminosities remains statistically significant, at high redshift
(where galaxies are supposed to have more gas at their disposal to
form stars, and so their X-ray emission is more likely to be absorbed)
the 2-10 keV luminosity is a more secure indicator of the SFR.
several 1042 erg s-1 and a corresponding
star formation rate 1000
yr-1. The fit to
the 0.5-2.0 keV/radio data is also linear up to .
However,
the count ratio for the highest redshift galaxy at z=1.275 requires
significant absorption if a spectral slope of
is
assumed; thus this galaxy shows, on a larger scale, the same behaviour
as that of the southern core in NGC 3256 (see the appendix).
Therefore, while the linearity of the relations involving soft X-ray
luminosities remains statistically significant, at high redshift
(where galaxies are supposed to have more gas at their disposal to
form stars, and so their X-ray emission is more likely to be absorbed)
the 2-10 keV luminosity is a more secure indicator of the SFR.
As an additional investigation we have also analyzed a sample of LLAGN
(LINERs and Seyfert's) included in HFS97 (Terashima et al. 2002):
while, as expected, the X-ray luminosities are generally in excess with
respect to star-forming galaxies for the same FIR luminosity, the
distribution of the objects in the X-ray vs. FIR luminosity diagram is
bounded from below from the region occupied by the star-forming
galaxies, indicating that the X-ray emission of LLAGN falling in this
border-line region could be mainly due to star formation processes,
rather than being of nuclear origin.
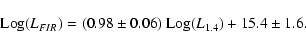
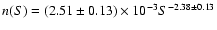
Our inference of using the 2-10 keV luminosity as a SFR indicator is
consistent with a recent study on Lyman-break galaxies by
Nandra et al. (2002) who have extrapolated the David et al. (1992) FIR/soft X-ray
relation to the hard X-ray band obtaining a SFR/2-10 keV luminosity
relation within  of our Eq. (15). From
a stacking analysis of Chandra data for a sample of optically
selected Lyman-break and Balmer-break galaxies in the HDFN they find a
good agreement of the average SFR as estimated from X-ray and
extinction-corrected UV luminosities.
of our Eq. (15). From
a stacking analysis of Chandra data for a sample of optically
selected Lyman-break and Balmer-break galaxies in the HDFN they find a
good agreement of the average SFR as estimated from X-ray and
extinction-corrected UV luminosities.
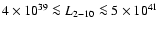
Grimm et al. (2002) have recently claimed that the luminosity function of
High Mass X-ray Binaries (HMXB) can be derived from a universal
luminosity function whose normalization is proportional to the SFR,
but only for rates 1 /yr, while this relation becomes
non-linear at lower rates. This appears to be somewhat in constrast
with our result that the 2-10 keV luminosity is proportional to SFReven for rates 1 /yr, as supported by the data for 4
galaxies in our sample. However, Grimm et al. 2002 analysis only
refers to the contribution from HMXB; the possible contribution of
other X-ray components, which are not selected out in our data, might
explain this discrepancy.
X-ray number counts for the radio sub-mJy galaxy population are
predicted making use of the radio Log N-Log S and of the X-ray/radio
correlation. The expected counts extend much below the sensitivities
of the deepest X-ray surveys (about one order of magnitude in the soft
band, one and a half for the hard band), and are within the limits set
by the fluctuations analysis in the Chandra deep fields
(Miyaji & Griffiths 2002a, b). They are also consistent with the
predictions based on the evolution of the cosmic SFR density by
(Ptak et al. 2001). Since the results from fluctuations analysis in the
soft X-rays suggest an excess of sources with respect to AGN synthesis
models at fluxes below 10-17 erg s-1 cm-2, it may
be possible that the sub-mJy galaxies represent the dominant
population in the X-rays at very faint fluxes.
The contribution to the cosmic X-ray background in the 2-10 keV band
is estimated by integration of the derived X-ray number counts. The
contribution from galaxies detected in the deepest radio surveys is
2%. This estimate may rise up to 11
by extrapolating
the radio counts down to 1 Jy, or 10-18 erg s-1 cm-2 in the X-ray band. However, since a fraction of the sub-mJy
objects may not be star-forming galaxies, these figures for the time
being should be regarded as upper limits.
The next step in understanding the physics involved in hard X-ray
emission must go through a careful analysis of Chandra and
XMM-Newton observations of both low-SFR local galaxies and
high-SFR high-redshift ones. Since the explanation of the
radio/FIR correlation is still a matter of discussion, we hope that
its extension to the X-ray band may help in clarifying this issue.
Acknowledgements
We kindly thank Joe Mazzarella for providing data before publication,
and Meri Polletta for very useful comments. We also thank an anonymous
referee whose comments have contributed to improve the presentation of
this paper. This research has made use of the VizieR database
(Ochsenbein et al. 2000) hosted at the Centre de Donnees astronomiques de
Strasbourg (CDS), and of data obtained from the High Energy
Astrophysics Science Archive Research Center (HEASARC), provided by
NASA's Goddard Space Flight Center. This research has been partially
supported by ASI contracts I/R/113/01 and I/R/073/01, and by the MURST
grants Cofin-00-02-36 and Cofin-01-02-8773.
In the ASCA observations, the X-ray emission of IC 342 (a
face-on spiral galaxy at 3.9 Mpc) is powered by three main sources;
two of them (source 1 and 2 according to Fabbiano & Trinchieri 1987) are
ultraluminous X-ray binaries (ULX) while source 3 is associated with
the galactic centre. Observations with higher angular resolution
(ROSAT HRI, Bregman et al. 1993) showed that sources 1 and 2 are
point-like while source 3 is resolved in at least three sources. Our
main concern in determining the flux of this galaxy is the variability
of the two ULX, which was assessed by a series of observations
spanning several years: IC342 was first observed by Einstein in
1980 (Fabbiano & Trinchieri 1987), then by ROSAT in 1991 (Bregman et al. 1993),
by ASCA in 1993 (Okada et al. 1998) and 2000 (Kubota et al. 2001), and by XMM-Newton in
2001.
In Table A.1 we report soft X-ray fluxes for sources 1 and 2. We have chosen the soft X-ray band due to the limited energy band
of both Einstein and ROSAT; the fluxes observed with these
satellites were obtained from the count rates reported in
Fabbiano & Trinchieri (1987) and Bregman et al. (1993) assuming the powerlaw and
multicolor disk examined in Kubota et al. (2001) for source 1 and 2
respectively; we take ASCA 1993 and 2000 fluxes from Kubota et al. (2001).
XMM-Newton archival observations were reduced by us with SAS 5.3 and the
latest calibrations available.
Source 1 was in a low state (
 erg s-1) during the 1980, 1991, 2000 and 2001 observations, and in a
high state (
erg s-1) during the 1980, 1991, 2000 and 2001 observations, and in a
high state (
 erg s-1) during the
1993 observation. The broad-band (0.5-10 keV) spectrum changed, its
best-fit model being a disk black-body in 1993 and a power-law in 2000
and 2001. Source 2 has also shown variability, its 0.5-2.0 keV flux
oscillating between
erg s-1) during the
1993 observation. The broad-band (0.5-10 keV) spectrum changed, its
best-fit model being a disk black-body in 1993 and a power-law in 2000
and 2001. Source 2 has also shown variability, its 0.5-2.0 keV flux
oscillating between
 (ASCA 2000) and
 (ASCA 1993) erg s-1; the main reason for this
variability being the variations in the strongly absorbing column
density, which was
(ASCA 1993) erg s-1; the main reason for this
variability being the variations in the strongly absorbing column
density, which was
 cm-2 in 1993 and
 cm-2 in 2000. The spectrum was always a power-law.
The high state for source 1 seems thus to be of short duration, and we
feel confident that its time-averaged flux may be approximated with
its low state flux. We thus choose to derive our flux estimate for
IC 342 from the ASCA 2000 observation, estimating the variation for
the total flux of the galaxy caused by source 2 variability to be less
than 10%.
Table A.1:
0.5-2.0 keV fluxes (in 10-13 erg s-1 cm-2) for sources 1
and 2 in IC 342 for a blackbody (bb) and a power-law (po) model.
| |
|
SRC 1 FLUX |
SRC 2 FLUX |
| YEAR |
MISSION |
BB |
PO |
PO |
| 1980 |
Einstein |
2.7 |
4.1 |
0.85 |
| 1991 |
ROSAT |
3.3 |
2.7 |
1.3 |
| 1993 |
ASCA |
16 |
|
2.6 |
| 2000 |
ASCA |
|
5.0 |
0.52 |
| 2001 |
XMM- Newton |
|
4.1 |
1.3 |
Hard (2-10 keV) X-ray variability in M 82 was reported in two
monitoring campaigns with ASCA (in 1996, Ptak & Griffiths 1999) and RXTE
(in 1997, Rephaeli & Gruber 2002). M82 was found in "high state''
(i.e.
 )
in
three out of nine observations with ASCA and in 4 out of 31
observations with RXTE. In all the other observations it was in a "low
state'' (
)
in
three out of nine observations with ASCA and in 4 out of 31
observations with RXTE. In all the other observations it was in a "low
state'' (
 ). A low flux level was also measured during the observations with other
experiments: HEAO 1 in 1978 (Griffiths et al. 1979);
Einstein MPC in 1979 (Watson et al. 1984);
EXOSAT in 1983 and 1984; BBXRT
in 1990; ASCA in 1993 (Tsuru et al. 1997); BeppoSAX in 1997
(Cappi et al. 1999); Chandra in 1999 and 2000, XMM-Newton in 2001. No
variability was instead detected in the 0.5-2.0 keV band
(Ptak & Griffiths 1999).
). A low flux level was also measured during the observations with other
experiments: HEAO 1 in 1978 (Griffiths et al. 1979);
Einstein MPC in 1979 (Watson et al. 1984);
EXOSAT in 1983 and 1984; BBXRT
in 1990; ASCA in 1993 (Tsuru et al. 1997); BeppoSAX in 1997
(Cappi et al. 1999); Chandra in 1999 and 2000, XMM-Newton in 2001. No
variability was instead detected in the 0.5-2.0 keV band
(Ptak & Griffiths 1999).
The high state has been
of short duration: less than 50 days in 1996, when it was observed by
ASCA,
and less than four months in 1997.
A monitoring campaign was also undertaken with Chandra, which
observed M 82 four times between September 1999 and May 2000.
We reduced the archival data, and found that
the galaxy was always in a low state, with its flux slowly increasing
from
 to
to
 .
.
We do not attempt a detailed analysis of the variability (see
Rephaeli & Gruber 2002); however, we feel confident that, given the
short duration of the high states and the fact that the difference
between high- and low state flux is about a factor 2, the
time-averaged flux of M 82 can be approximated with its low state
flux. We thus choose to derive our flux estimate for M 82 from the
BeppoSAX 1997 observation (
 erg s-1 cm-2), estimating the uncertainty caused by
variability to be around
erg s-1 cm-2), estimating the uncertainty caused by
variability to be around  .
.
![\begin{figure}
\par\includegraphics[width=8.8cm,clip]{h3889f7.ps}
\end{figure}](/articles/aa/full/2003/07/aah3889/Timg126.gif) |
Figure A.1:
True color, smoothed Chandra image of the centre of NGC 3256
(the actual colour is the sum of red, green and blue, the intensity
of each one representing the flux in the 0.3-1.0 keV, 1.0-2.0 keV
and 2.0-8 keV respectively); north is up, east
is left; the distance between the two cores is 5
.
The two cores are the brightest sources both at 1.4 GHz and in the
2-10 keV band, but since the southern one lies behind a dust lane,
its soft X-ray emission is completely absorbed. While the northern
core follows both the radio/soft X-ray and radio/hard X-ray relations
(Eqs. (9), (13)), the southern one only follows
the radio/hard X-ray relation. |
We present the test case of NGC 3256, a luminous dusty
merger remnant included in the supplementary sample. Detailed studies
at several wavelengths (radio: Norris & Forbes 1995; IR:
Kotilainen et al. 1996; optical: Lípari et al. 2000; X-ray:
Moran et al. 1999; Lira et al. 1999) have shown that the energetic
output of this galaxy is powered by star formation occurring at
several locations, but mainly in the two radio cores discovered by
Norris & Forbes (1995) and also detected with Chandra
(Fig. A.1).
The 3 and 6 cm radio maps (Norris & Forbes 1995) reveal two
distinct, resolved (
 )
nuclei and some fainter
diffuse radio emission. Separated by
)
nuclei and some fainter
diffuse radio emission. Separated by
 in declination, the
two cores dominate the radio emission, the northern one being
slightly (15%) brighter. They share the same spectral
index (
in declination, the
two cores dominate the radio emission, the northern one being
slightly (15%) brighter. They share the same spectral
index (
 )
and have similar 2-10 keV fluxes. Both of them
follow the radio/hard X-ray correlation, while only the northern one
follows the radio/soft X-ray correlation. At other wavelengths the
northern core is the brightest source in NGC 3256, while the southern
one lies behind a dust lane and is only detected in the far infrared
(
)
and have similar 2-10 keV fluxes. Both of them
follow the radio/hard X-ray correlation, while only the northern one
follows the radio/soft X-ray correlation. At other wavelengths the
northern core is the brightest source in NGC 3256, while the southern
one lies behind a dust lane and is only detected in the far infrared
(
 m), as clearly shown in the sequence of infrared
images at increasing wavelengths in Kotilainen et al. (1996).
m), as clearly shown in the sequence of infrared
images at increasing wavelengths in Kotilainen et al. (1996).
Although the southern core appears as a bright source in the hard
X-rays (E>2 keV), there are not enough counts to allow an accurate
spectral fitting. However, it is still possible to constrain the
absorbing column density by assuming a template spectrum, such as a
simple power-law or the spectrum of the northern core, leading (after
standard processing of the Chandra archival observation of NGC
3256) to an intrinsic
 cm-2 (
 cm-2), fully
consistent with the
AV=10.7 estimated by Kotilainen et al. (1996)
from infrared observations. We note that
84% of the 2-10 keV flux and only 10% of the 0.5-2 keV one
are transmitted through this column density. Thus, while
the flux loss in the hard band is still within the correlation
scatter, the larger loss in the soft band throws the southern nucleus
off the correlation of Eq. (9).
cm-2), fully
consistent with the
AV=10.7 estimated by Kotilainen et al. (1996)
from infrared observations. We note that
84% of the 2-10 keV flux and only 10% of the 0.5-2 keV one
are transmitted through this column density. Thus, while
the flux loss in the hard band is still within the correlation
scatter, the larger loss in the soft band throws the southern nucleus
off the correlation of Eq. (9).
-
Bookbinder, J., Cowie, L. L., Ostriker, J. P., Krolik, J. H., & Rees, M. 1980, ApJ, 237, 647
In the text
NASA ADS
-
Bauer, F. E., Alexander, D. M., Brandt, W. N., et al. 2002, AJ, 124, 2351
NASA ADS
-
Brandt, W. N., Alexander, D. M., Hornschmeier, A. E., et al. 2001, AJ, 122, 2810
In the text
NASA ADS
-
Bregman, J. N., Cox, C. V., & Tomisaka, K. 1993, ApJ, 415, L79
In the text
NASA ADS
-
Cappi, M., Persic, M., Bassani, L., et al. 1999, A&A, 350, 777
In the text
NASA ADS
-
Cohen, J., Hogg, D. W., Blandford, R., et al. 2000, ApJ, 538, 29
In the text
NASA ADS
-
Comastri, A., Setti, G., Zamorani, G., & Hasinger, G. 1995, A&A, 296, 1
In the text
NASA ADS
-
Condon, J. J. 1992, ARA&A, 30, 575
In the text
NASA ADS
-
Condon, J. J., Helou, G., Sanders, D. B., & Soifer, B. T. 1990, ApJS, 73, 359
In the text
NASA ADS
-
Condon, J. J., Helou, G., Sanders, D. B., & Soifer, B. T. 1996, ApJS, 103, 81
In the text
NASA ADS
-
Dahlem, M., Weaver, K. A., & Heckman, T. M. 1998, ApJS, 118, 401
In the text
NASA ADS
-
David, L. P., Jones, C., & Forman, W. 1992, ApJ, 388, 82
In the text
NASA ADS
-
Della Ceca, R., Griffiths, R. E., Heckman, T. M., & MacKenty, J. W. 1996, ApJ, 469, 662
In the text
NASA ADS
-
Della Ceca, R., Griffiths, R. E., & Heckman, T. M. 1997, ApJ, 485, 581
In the text
NASA ADS
-
Della Ceca, R., Griffiths, R. E., Heckman, T. M., Lehnert, M. D., & Weaver, K. A. 1999, ApJ, 514, 772
In the text
NASA ADS
-
De Jong, T., Klein, U., Wielebinski, R., & Wunderlich, E. 1985, A&A, 147, L6
In the text
NASA ADS
-
de Vaucouleurs, G., de Vaucouleurs, A., & Corwin, H. G. 1976,
Second Reference Catalogue of Bright Galaxies
(University of Texas Press, Austin) (RC2)
In the text
-
Dobrodiy, O. A., & Pronik, I. I. 1979, Izv. Astrof. Obs. Krim. (Simeis) LX, 66
-
Fabbiano, G. 1989, ARA&A, 27, 87
In the text
NASA ADS
-
Fabbiano, G., & Trinchieri, G. 1987, ApJ, 315, 46
In the text
NASA ADS
-
Fomalont, E. B., Windhorst, R. A., Kristian, J. A., & Kellerman, K. I. 1991, AJ, 102, 1258
In the text
NASA ADS
-
Garrett, M. 2002, A&A, 384, L19
In the text
NASA ADS
-
Garrett, M. A., de Bruyn, A. G., Giroletti, M., Baan, W. A., & Schilizzi, R. T. 2000, A&A, 361, L41
In the text
NASA ADS
-
Gendreau, K. C., Mushotzky, R., Fabian, A. C., et al. 1995, PASJ, 47, L5
In the text
NASA ADS
-
Gilli, R., Salvati, M., & Hasinger, G. 2001, A&A, 366, 407
In the text
NASA ADS
-
Griffiths, R. E., Schwartz, D. A., Schwarz, J., et al. 1979, ApJ, 230, L21
In the text
NASA ADS
-
Griffiths, R. E., & Padovani, P. 1990, ApJ, 360, 483
In the text
NASA ADS
-
Grimm, H. J., Gilfanov, M., & Sunyaev, R. 2002, MNRAS, submitted
[astro-ph/0205371]
In the text
-
Haarsma, D. B., Partridge, R. B., Windhorst, R. A., & Richards, E. A. 2000, ApJ, 544, 641
In the text
NASA ADS
-
Harwit, M., & Pacini, F. 1975, ApJ, 200, L127
In the text
NASA ADS
-
Haynes, R. F., Huchtmeir, W. K. G., & Siegman, B. C. 1975, Compendium of Radio Measurements of
Bright Galaxies, CSIRO Publication
In the text
-
Helou, G., Soifer, B. T., & Rowan-Robinson, M. 1985, ApJ, 298, L7
In the text
NASA ADS
-
Ho, L. C., Filippenko, A. V., & Sargent, W. L. W. 1995, ApJS, 98, 477
In the text
NASA ADS
-
Ho, L. C., Filippenko, A. V., & Sargent, W. L. W. 1997, ApJS, 112, 315 (HFS97)
In the text
NASA ADS
-
Ho, L. C., Feigelson, E. D., Townsley, L. K., et al. 2001, ApJ, 549, L51
In the text
NASA ADS
-
Kennicutt, R. C. Jr. 1998, ApJ, 498, 541
In the text
NASA ADS
-
Kewley, L. J., Heisler, C. A., Dopita, M. A., & Lumsden, S. 2001, ApJS, 132, 37
NASA ADS
-
Kotilainen, J. K., Moorwood, A. F. M., Ward, M. J., & Forbes, D. A. 1996, A&A, 305, 107
In the text
NASA ADS
-
Kubota, A., Mizuno, T., Makishima, K., et al. 2001, ApJ, 547, L119
In the text
NASA ADS
-
Lípari, S., Díaz, R., Taniguchi, Y., et al. 2000, AJ, 120, 645
In the text
NASA ADS
-
Lira, P., Ward, M., Zezas, A., Alonso-Herrero, A., & Ueno, S. 2002, MNRAS, 330, 259
In the text
NASA ADS
-
Lumb, D. H., Warwick, R. S., Page, M., & De Luca, A. 2002, A&A, 389, 93
In the text
NASA ADS
-
Mazzarella, J., et al. 2002, in preparation
-
Miyaji, T., & Griffiths, R. E. 2002a, ApJ, 564, L5
In the text
NASA ADS
-
Miyaji, T., & Griffiths, R. E. 2002b, Proc. Symp., New Visions of
the X-ray Universe in the XMM-Newton and Chandra Era, ESTEC 2001
[astro-ph/0202048]
In the text
-
Moran, E. C., Lehnert, M. D., & Helfand, D. J. 1999, ApJ, 526, 649
In the text
NASA ADS
-
Moshir, M., Copan, G., Conrow, T., et al. 1989, IRAS Faint Source Catalog, |b|>10Degrees, Infrared Processing and Analysis Center
In the text
-
Nandra, K., Mushotzky, R. F., Arnaud, K., et al. 2002, ApJ, 576, 625
In the text
NASA ADS
-
Norris, R. P., & Forbes, D. A. 1995, ApJ, 446, 594
In the text
NASA ADS
-
Okada, K., Dotani, T., Makishima, K., Mitsuda, K., & Mihara, T. 1998, PASJ, 50, 25
In the text
NASA ADS
-
Ochsenbein, F., Bauer, P., & Marcout, J. 2000, A&AS, 143, 23
In the text
NASA ADS
-
Parmar, A. N., Sidoli, L., Oosterbroek, T., et al. 2001, A&A, 368, 420
In the text
NASA ADS
-
Ptak, A., & Griffiths, R. 1999, ApJ, 517, L85
In the text
NASA ADS
-
Ptak, A., Griffiths, R., White, N., & Ghosh, P. 2001, ApJ, 559, L91
In the text
NASA ADS
-
Ranalli, P., Comastri, A., & Setti, G. 2002, Proc. Symp., New Visions of
the X-ray Universe in the XMM-Newton and Chandra Era, ESTEC 2001
[astro-ph/0202241]
-
Rephaeli, Y., & Gruber, D. 2002, A&A, 389, 752
In the text
NASA ADS
-
Rice, W., Lonsdale, C. J., Soifer, B. T., et al. 1988, ApJS, 68, 91
In the text
NASA ADS
-
Richards, E. A., Kellermann, K. I., Fomalont, E. B., Windhorst, R. A., & Partridge, R. B. 1998, AJ, 116, 1039
In the text
NASA ADS
-
Richards, E. A. 2000, ApJ, 533, 611
In the text
NASA ADS
-
Rubin, V. C., Ford, W. K. Jr., & D'Odorico, S. 1970, ApJ, 160, 801
NASA ADS
-
Rush, B., Malkan, M., & Spinoglio, L. 1993, ApJS, 89, 1
In the text
NASA ADS
-
Sandage, A. R., & Tammann, G. A. 1981, A Revised Shapley-Ames Catalog of Bright Galaxies (RSA)
(Washington: Carnegie Institution of Washington)
In the text
-
Sansom, A. E., Dotani, T., Okada, K., Yamashita, A., & Fabbiano, G. 1996, MNRAS, 281, 48
In the text
NASA ADS
-
Setti, G., & Woltjer, L. 1989, A&A, 224, L21
In the text
NASA ADS
-
Terashima, Y., Iyomoto, N., Ho, L. C., & Ptak, A. F. 2002, ApJS, 139, 1
In the text
NASA ADS
-
Tully, R. B. 1988, Nearby Galaxies Catalog (Cambridge University Press)
In the text
-
Tsuru, T. G., Awaki, H., Koyama, K., & Ptak, A. F. 1997, PASJ, 49, 619
In the text
NASA ADS
-
Ulvestad, J. S., & Ho, L. C. 2002, ApJ, in press [astro-ph/0208460]
In the text
-
van der Kruit, P. C. 1973, A&A, 29, 263
In the text
NASA ADS
-
Vecchi, A., Molendi, S., Guainazzi, M., Fiore, F., & Parmar, A. N. 1999, A&A, 349, L73
In the text
NASA ADS
-
Veilleux, S., & Osterbrock, D. E. 1987, ApJS, 63, 295
In the text
NASA ADS
-
Watson, M. G., Stanger, V., & Griffiths, R. E. 1984, ApJ, 286, 144
In the text
NASA ADS
-
Webster, B. L., & Smith, M. G. 1983, MNRAS, 204, 743
NASA ADS
-
Windhorst, R. A., Miley, G. K., Owen, F. N., Kron, R. G., & Koo, D. C. 1985, ApJ, 289, 494
In the text
NASA ADS
-
Windhorst, R. A., Mathis, D. F., & Neuschaefer, L. W. 1990, Proc. Symp.,
Evolution of the universe of galaxies: Edwin Hubble Centennial Symposium,
ASP Conf. Ser., 10, 389
In the text
-
Yun, M. S., Reddy, N. A., & Condon, J. J. 2001, ApJ, 554, 803
In the text
NASA ADS
-
Zezas, A. L., Georgantopoulos, I., & Ward, M. J. 1998, MNRAS, 301, 915
In the text
NASA ADS
Copyright ESO 2003
![\begin{figure}
\par\mbox{ \includegraphics[width=8.7cm,clip]{h3889f1a.eps} \hspace*{2.5mm}
\includegraphics[width=8.7cm,clip]{h3889f1b.eps} }
\end{figure}](/articles/aa/full/2003/07/aah3889/img29.gif)
![\begin{figure}
\par\mbox{\includegraphics[width=8.7cm,clip]{h3889f2a.eps} \hspace*{2.5mm}
\includegraphics[width=8.7cm,clip]{h3889f2b.eps} }
\end{figure}](/articles/aa/full/2003/07/aah3889/img52.gif)
![\begin{figure}
\par\includegraphics[width=8.8cm,clip]{h3889f3.ps} \end{figure}](/articles/aa/full/2003/07/aah3889/img63.gif)
![\begin{figure}
\par\includegraphics[width=8.8cm,clip]{h3889f4.eps}
\end{figure}](/articles/aa/full/2003/07/aah3889/img71.gif)
![\begin{figure}
\par\mbox{\includegraphics[width=8.7cm,clip]{h3889f5a.ps}\hspace*{2.5mm}
\includegraphics[width=8.7cm,clip]{h3889f5b.ps} }
\end{figure}](/articles/aa/full/2003/07/aah3889/img78.gif)
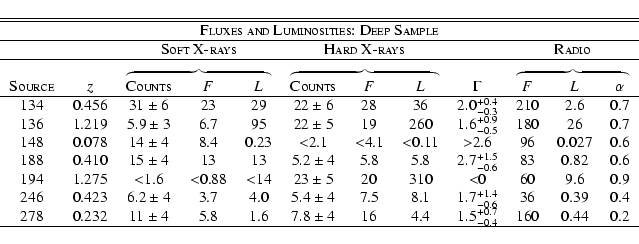
![\begin{figure}
\par\mbox{ \includegraphics[width=8.7cm,clip]{h3889f6a.ps}\hspace*{2.5mm}
\includegraphics[width=8.7cm,clip]{h3889f6b.ps} }
\end{figure}](/articles/aa/full/2003/07/aah3889/img99.gif)
![\begin{figure}
\par\includegraphics[width=8.8cm,clip]{h3889f7.ps}
\end{figure}](/articles/aa/full/2003/07/aah3889/img126.gif)