A&A 399, 385-394 (2003)
DOI: 10.1051/0004-6361:20021744
M. Hartung 1 - A. Blanc23 - T. Fusco2 - F. Lacombe4 - L. M. Mugnier2 - G. Rousset2 - R. Lenzen1
1 - Max-Planck-Institut für Astronomie,
Königstuhl 17, 69117 Heidelberg, Germany
2 -
Office National d'Études et de Recherches
Aérospatiales,
Département d'Optique Théorique et Appliquée,
BP 72, 92322 Châtillon Cedex, France
3 -
Laboratoire des Signaux et Systèmes,
École Supérieure d'Électricité,
Plateau de Moulon, 91192 Gif-sur-Yvette, France
4 -
Observatoire Paris-Meudon, LESIA, Place Jules Janssen, 92195
Meudon Cedex, France
Received 16 July 2002 / Accepted 25 October 2002
Abstract
NAOS is the first adaptive optics (AO) system of the
Very Large Telescope and will provide CONICA with
diffraction-limited images. CONICA is a near infrared camera
that offers a variety of imaging and spectroscopic observing
modes. A technique will be described to benefit of the AO system
to correct not only for atmospheric turbulence but also for the
internal optical aberrations of the high-resolution camera and
the beam splitters of NAOS. The aberrant optical components in
the light path of CONICA as well as the beam splitters are
outside of the AO loop and therefore no self-acting correction
is possible. Independently of the AO wavefront sensor, a
separate measurement of these aberrations using a method called
phase diversity allows one to predict for a certain instrument
configuration the corresponding aberrations. They are quantified
by sets of Zernike coefficients that are rendered to the
adaptive optics. This technique turns out to be very flexible
and results in a further improvement of the optical overall
performance. The application of phase diversity to the
instrument is investigated in a preceding paper (Blanc et al. 2003).
In the present paper we present in detail the
instrumental implementation of phase diversity, the obtained
calibration results, and the achieved gain in optical
performance.
Key words: instrumentation: adaptive optics
Because of the huge number of instrument modes it is not feasible to perform the PD calibration for each possible configuration. We explain how the wavefront degradations of the different optical components are disentangled. Then, the individual parts of the optical train can be calibrated separately and it is no longer required to do this for every possible combination. In detail, we will allocate the wavefront error to the dichroic mirrors of NAOS (beam splitter between wavefront sensor and imaging path), to the CONICA filters and camera objectives (Sect. 4).
Thereafter, the sensed wavefront errors are used to calculate the corresponding SRs. These are compared to the SRs directly determined from the images and the consistency is verified (Sect. 5). Finally, after presentation of the complete calibration procedure and its results, the measured wavefront errors are rendered in terms of Zernike coefficients to the AO system to demonstrate the gain in overall performance after closed loop correction (Sect. 6).
The wavefront sensing path consists of a field selector (Spanoudakis et al. 2000) and two wavefront sensors. They are located between the dichroic mirror and the WFS input focus. For the sake of clarity these components are not shown in Fig. 1. The two wavefront sensors, one in the visible and one in the near infrared spectral range, enhance the sky coverage of possible guide stars. The field selector chooses the guide star in a 2 arcmin field of view and allows differential object tracking, pre-calibrated flexure compensation and counter-chopping. In combination with the deformable mirror it is also able to correct for a certain amount of defocus, as needed when the prisms of the atmospheric dispersion compensator are shifted into the beam. Note that this ability of focus correction offers a possibility to perform PD measurements that we will refer to later on (Sect. 3.2).
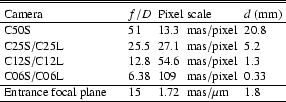
The high angular resolution camera CONICA is equipped with an Aladdin
array (
![]() )
covering the 1-5
)
covering the 1-5 ![]() m spectral region. Splitting the
wavelength region into two parts (1 to 2.5
m spectral region. Splitting the
wavelength region into two parts (1 to 2.5 ![]() m and 2.0 to
5
m and 2.0 to
5 ![]() m) allows us to keep the light path achromatic. Therefore the
four different pixel scales are realized by seven cameras
(Table 1). To each pixel scale a camera is associated
with the short wavelengths region (S-camera) and another one with the
long wavelengths region (L-camera). The only exception is the camera
with the highest magnification (C50S). There is no long wavelength
counterpart needed
m) allows us to keep the light path achromatic. Therefore the
four different pixel scales are realized by seven cameras
(Table 1). To each pixel scale a camera is associated
with the short wavelengths region (S-camera) and another one with the
long wavelengths region (L-camera). The only exception is the camera
with the highest magnification (C50S). There is no long wavelength
counterpart needed![]() .
.
A variety of different observing modes is provided by the analyzing optics: chronography, low resolution long slit spectroscopy, imaging spectroscopy by a tunable cold Fabry-Perot, polarimetry by wire-grids or Wollaston prisms, and about 40 broad- and narrow-band filters can be chosen.
![\begin{figure}
\par\includegraphics[width=8.5cm,clip]{fig/f2914_01.eps} \end{figure}](/articles/aa/full/2003/07/aa2914/img5.gif) |
Figure 1: Outline of the VLT instrument NAOS-CONICA. |
| Open with DEXTER | |
 |
| |
Figure 2: The Zernike tool with its pinholes in the light path of CONICA. |
| Open with DEXTER | |
Figure 2 depicts the setup for the CONICA internal phase diversity measurements. The leftmost component carries the four pinholes, which are shifted against each other, with the values given above. In rotating the wheel holding the Zernike tool we are able to select a pinhole in the field of view. After a collimating lens and a pupil stop, a filter selects the wavelength range and finally the camera objective forms the object image on the detector. The chosen camera objective determines the f-ratio and the pixel scale.
To center the image of the pinholes on the detector, the whole pinhole
mount is shifted by turning the mask wheel. In principal PD needs the
input images to be on the same spot to ensure that the same
aberrations are sensed. The horizontal position of the pinholes can be
controlled by adjusting the rotation angle of the wheel. In vertical
direction there is no degree of freedom, but the four pinholes are
mounted circularly to compensate for the circular movement. By this
means a vertical precision of 50 mas (C50S) can be reached![]() . This is easily sufficient not
to see any influence due to field aberration effects. PD measurements
taken at different detector positions and calculations performed with
an optical design software showed that even at the corner of the field
of view (13 arcsec) the field aberration is negligible
(Paper I). Note that for some measurements in Paper I an earlier
version of the Zernike tool was used with a design not optimized for
the circular movement of the pinholes. The worst separation that
could occur with the former Zernike tool was about 1.3 arcsec. But
even with this tool no relevant impact on the precision of wavefront
sensing was detected.
. This is easily sufficient not
to see any influence due to field aberration effects. PD measurements
taken at different detector positions and calculations performed with
an optical design software showed that even at the corner of the field
of view (13 arcsec) the field aberration is negligible
(Paper I). Note that for some measurements in Paper I an earlier
version of the Zernike tool was used with a design not optimized for
the circular movement of the pinholes. The worst separation that
could occur with the former Zernike tool was about 1.3 arcsec. But
even with this tool no relevant impact on the precision of wavefront
sensing was detected.
Apart from the fact that the Zernike tool with its pinholes at the entrance focal plane provides the required focus shifts, it is convenient that the required focus shifts do not depend on the camera objective (pixel scale) anymore. But note: defocusing by moving an object in the entrance focal plane does not correspond exactly to a defocus due to a shifted detector plane. An investigation of this effect is done in Paper I and turns out to be negligible.
To summarise this section: the PD input data to derive the total
CONICA internal aberrations are obtained by object defocusing in the
CONICA entrance focal plane. The object defocusing is realized by four
10 ![]() m pinholes at different axial positions. Note that since the
entrance focal plane of CONICA is located inside the cold cryostat,
aberrations accrued from the CONICA entrance window are not included
in this wavefront estimation.
m pinholes at different axial positions. Note that since the
entrance focal plane of CONICA is located inside the cold cryostat,
aberrations accrued from the CONICA entrance window are not included
in this wavefront estimation.
Now, we describe how the PD input images are obtained which are used to sense the wavefront aberrations of the whole instrument, i.e., the adaptive optics NAOS together with its infrared camera CONICA. In this case we can take advantage of the AO system's capabilities to itself introduce an adequate focus shift and thus there is no need for the implementation of a special tool or a modifaction of the design.
In the entrance focal plane of NAOS, which coincides with the VLT
Nasmyth focal plane, a calibration point source can be slid in and
imaged by CONICA. This point source is realized by the output of a
fiber with a diameter of 10 ![]() m fixed on a movable stage. On the
same stage a second source much larger in diameter (400
m fixed on a movable stage. On the
same stage a second source much larger in diameter (400 ![]() m) is
mounted. It is only seen by the WFS and serves as a reference source
to close the loop. This extended source is needed for technical
reasons. In the case of no atmospheric turbulence the more extended
source provides a much better feed-back signal to the WFS than the
small one. By this means the AO control loop is adjusted for any
aberrations emerging in the common path. To obtain the focus shift
affecting the entire instrument, we introduce the desired amount of
defocusing in the WFS path by moving the mirrors of the field
selector. During this process the loop is kept closed. Instantly, the
arising focus shift is detected by the WFS. Correspondingly, the real
time computer commands the DM to compensate for the detected
defocus. Finally, the spots on the Shack-Hartmann WFS are centered
again, but the defocus of the DM takes effect in the imaging path.
For a pure defocus the DM will take a parabolic shape. The maximum
achievable defocus by this method is limited by the DM's stroke and
turns out to be about 20 mm. Refering to Table 1, this
is enough to introduce the needed diversity for an f/15 beam.
m) is
mounted. It is only seen by the WFS and serves as a reference source
to close the loop. This extended source is needed for technical
reasons. In the case of no atmospheric turbulence the more extended
source provides a much better feed-back signal to the WFS than the
small one. By this means the AO control loop is adjusted for any
aberrations emerging in the common path. To obtain the focus shift
affecting the entire instrument, we introduce the desired amount of
defocusing in the WFS path by moving the mirrors of the field
selector. During this process the loop is kept closed. Instantly, the
arising focus shift is detected by the WFS. Correspondingly, the real
time computer commands the DM to compensate for the detected
defocus. Finally, the spots on the Shack-Hartmann WFS are centered
again, but the defocus of the DM takes effect in the imaging path.
For a pure defocus the DM will take a parabolic shape. The maximum
achievable defocus by this method is limited by the DM's stroke and
turns out to be about 20 mm. Refering to Table 1, this
is enough to introduce the needed diversity for an f/15 beam.
The procedure is shown in Fig. 3 and provides us with the PD input data to estimate the NAOS-CONICA overall wavefront errors. In comparison with the procedure described in Sect. 3.1 we deal with the same object now, and we must not care about any deviations in the position of the image pairs. This simplifies data aquisition for the measurement and diminishes the number of possible error sources.
![\begin{figure}
\par\includegraphics[width=8.8cm,clip]{fig/f2914_03.eps} \end{figure}](/articles/aa/full/2003/07/aa2914/img14.gif) |
Figure 3: Defocusing in closed loop using the NAOS Field Selector |
| Open with DEXTER | |
An extensive examination of the variety of error sources due to the
practical and instrumental constraints was done in the preceding
Paper I. The induced aberrations due to defocusing by a shifted
object in the CONICA stand-alone case have been simulated and proven
to be negligible. The influence of the pupil shape and its
numerization have been evaluated, errors taken in account with regard
to the camera pixel scale and the defocus distance deviations have
been simulated and the problem of different object structure was
considered. Furthermore we focused in detail on the handling of data
reduction, e.g. the influence of the different noise sources such as
readout noise or pickup noise. In Paper I we state that all these
error sources accumulate to ![]() nm rms for the focus
coefficient (4). Since the presented calibration data of this paper
are acquired with an optimized Zernike tool, the expected error should
be well below this number. The accuracy of the higher order
coefficients has not changed and amounts to about
nm rms for the focus
coefficient (4). Since the presented calibration data of this paper
are acquired with an optimized Zernike tool, the expected error should
be well below this number. The accuracy of the higher order
coefficients has not changed and amounts to about ![]() nm rms.
nm rms.
In this section we describe how the overall wavefront error can be decomposed and assigned to its corresponding optical components. Then we present the experimental results for one camera objective and some selected filters of CONICA as well as the results for the dichroics of NAOS.
In principal, we have to differentiate between three categories of optical components in the imaging path: the NAOS dichroics, the CONICA filters and the camera objectives.
The contribution of the NAOS dichroics
![]() can be
determined by subtracting the overall NAOS-CONICA instrument aberrations
can be
determined by subtracting the overall NAOS-CONICA instrument aberrations
![]() from the total CONICA instrument aberrations
from the total CONICA instrument aberrations
![]() :
:
 |
(2) |
 |
(3) |
![\begin{figure}
\par\includegraphics[width=8.8cm,clip]{fig/f2914_05.ps} \end{figure}](/articles/aa/full/2003/07/aa2914/img26.gif) |
Figure 4: CONICA internal aberrations measured by 8 NB filters in J- and H-band with camera objective C50S and pinhole pair 0/2 mm. The thick line indicates the median representing the camera aberrations. |
| Open with DEXTER | |
![\begin{figure}
\par\includegraphics[width=8.8cm,clip]{fig/f2914_06.ps} \end{figure}](/articles/aa/full/2003/07/aa2914/img27.gif) |
Figure 5: CONICA internal aberrations measured by 19 NB filters in K-band with camera objective C50S and pinhole pair 0/4 mm. The thick line indicates the median representing the camera aberrations. The dashed line highlights the aberrant filter NB2.09 which is picked out for the demonstration images in Fig. 6. |
| Open with DEXTER | |
Figure 4 shows the aberrations for all eight narrow band
filters in J- and H-band of CONICA. The camera objective C50S and the
pinhole pair (0/2 mm) is used to obtain the calibration data. The
fourth coefficient
![]() expressing the defocus
shows a peak-to-peak variation of up to 60 nm. This implies a slight
imprecision of coplanarity of the filters in the cold environment.
The other measured coefficients associated with the different filters
noticeably resemble each other. This is evidence that these
narrow-band filters contribute little to the total aberration of the
system and mainly the camera objective aberration is seen.
expressing the defocus
shows a peak-to-peak variation of up to 60 nm. This implies a slight
imprecision of coplanarity of the filters in the cold environment.
The other measured coefficients associated with the different filters
noticeably resemble each other. This is evidence that these
narrow-band filters contribute little to the total aberration of the
system and mainly the camera objective aberration is seen.
Figure 5 displays the calibration results in the K-band. In total, 19 filters have been calibrated using the pinhole pair 0/4 mm. One of the strongly aberrant filters (NB2.09) is highlighted by a dashed line. A large defocus in comparison to the other ones is detected. This filter is expected to have a striking error of coplanarity. It is not surprising that the strong defocus comes along with a particularly high spherical aberration (i=11). The other highly aberrant filters show the same behaviour in comparison with the common filters of minor aberrations. The spherical aberration expresses the next order of a radial symmetric Zernike mode. The probability that a strong default of coplanarity induces only a defocus and does not concern higher orders is small. The PD input images of this aberrant filter is depicted at the bottom of Fig. 6. The right image shows the PSF registered in focus, and the left image a PSF having introduced a defocus of 4 mm. Already the in-focus image reveals a strong degradation, but especially the phase inversion due to the high defocus can be clearly seen in the out of focus image. A bright spot emerges in the center of the "donut''. On the top of this couple of images another couple of images is depicted. These are the PD input data of a filter (NB2.06) with normal behaviour and without strong aberrations.
As described in Sect. 4.2 the median of each Zernike
number of the whole set of vectors yield the vector describing the camera
contribution.
![\begin{figure}
\par {\hspace*{2cm}Filter NB2.06}\\
\mbox{\includegraphics[widt...
...s} \includegraphics[width=0.24 \textwidth,clip]{fig/f2914_10.ps} }
\end{figure}](/articles/aa/full/2003/07/aa2914/img29.gif) |
Figure 6: Comparison of PD input images of a filter with small aberrations (NB2.06, on the top) and a filter with high aberrations (NB2.09 at the bottom). The in-focus images are placed on the left side, the out of focus images on the right side. The defocus distance is 4 mm for both filters (f/15). |
| Open with DEXTER | |
The accuracy of separating the camera aberrations from the raw aberrations (filters including camera) by the method described above is striking. The median aberrations for the filters of the two different wavelength regions plotted in Figs. 4 and 5 are compiled in Table 2. The deviations of both median values are clearly below the expected error (see Sect. 4.1). Table 2 lists these median coefficients taken from all NB filters in J-, H- and K-band. Keeping in mind that the achievable precision is a few nm we state that the camera aberrations are very small. The highest contributions arise from the focus term (4) and the astigmatism (5, 6). Section 5.3 gives an idea of the impact on the image quality dealing with Zernike mode aberrations in this order of magnitude. The residual filter aberrations are obtained by Eq. (4). In general, besides the focus coefficient and a few deviating filters these values are close to zero, too.
| Bands for median | 4 | 5 | 6 | 7 | 8 | 9 | 10 | 11 | 12 | 13 | 14 | 15 |
| J, H | -12 | -34 | 30 | -6 | 4 | 2 | 13 | -8 | 2 | 0 | 9 | -1 |
| K | -15 | -39 | 27 | -10 | 7 | 3 | 15 | -9 | 2 | 0 | 6 | -1 |
| J, H, K | -15 | -39 | 27 | -9 | 6 | 2 | 13 | -9 | 2 | 0 | 7 | -1 |
In the following the properties of the five NAOS dichroics are itemized:
The calibration results are compiled in Table 3 and Table 4. The first table lists the direct PD results. Any correction performed by these coefficients would only apply to the instrument configuration that was used to obtain the calibration data. The second table lists the aberrations directly assigned to the dichroics. These were obtained by subtracting the total CONICA aberrations that have been measured with the same filter and camera objective using the Zernike tool. It is noteworthy that the sensed astigmatism (Zernike number 5, 6) in the separated case is higher than in the overall case. Obviously a part of the camera astigmatism is compensated by the dichroics.
It is noteworthy that this tendency applies for all dichroics. Different reasons can cause this behaviour. First, the inclination of the dichroics artificially introduce an astigmatism. Even if the NAOS dichroics are designed for prism shape and do correct for this effect, a residual error cannot be excluded. Furthermore a certain amount of astigmatism can be introduced by components other than the dichroics lying in the same part of the light path, e.g. the output folding mirror or the CONICA entrance window (see Fig. 1). Nevertheless, it is not a limitation of the calibration method but only a question of assigning the contribution of the wavefront errors to the different optical components. In the end, only the sum of all aberrations has to be correct.
| Dichro | 4 | 5 | 6 | 7 | 8 | 9 | 10 | 11 | 12 | 13 | 14 | 15 |
| VIS | 15 | -5 | 24 | -6 | 23 | 5 | -8 | -9 | 7 | -13 | -7 | 3 |
| N20C80 | 2 | -1 | 42 | -2 | 30 | 5 | -4 | 14 | -1 | -19 | -8 | 4 |
| N90C10 | -7 | -3 | 36 | -3 | 19 | 6 | -5 | -28 | 1 | -9 | -9 | 1 |
| K | -8 | 14 | -17 | -4 | 18 | 3 | -5 | -6 | 7 | -14 | -10 | 2 |
Dichro |
4 | 5 | 6 | 7 | 8 | 9 | 10 | 11 | 12 | 13 | 14 | 15 |
| VIS | -18 | 37 | -5 | 3 | 16 | 2 | -21 | -44 | 6 | -13 | -14 | 6 |
| N20C80 | -32 | 41 | 13 | 8 | 23 | 1 | -17 | -21 | -3 | -18 | -15 | 6 |
| N90C10 | -41 | 38 | 7 | 7 | 12 | 3 | -18 | -64 | -1 | -9 | -16 | 4 |
| K | -42 | 56 | -47 | 5 | 11 | -1 | -18 | -42 | 5 | -14 | -17 | 5 |
The PD calibration data can be used to investigate the available image quality in different ways. First, the knowledge of the wavefront allows us to calculate a SR. After the reduction of the calibration data the wavefront is described by a set of Zernike coefficients. Furthermore, we can just refer to the in-focus image and calculate a SR with the measured point spread function. In the following we give a more detailed explanation of how these SRs are obtained.
In particular, in the case of the PSF sampling being close to the
Nyquist criterion this approach has the disadvantage of being sensitive
to the exact position of the PSF peak with respect to the pixel
center. Furthermore, since the total intensity has to be determined by
the integrated signal over a wider region around the PSF, the
reliability of the SR value depends on a precise background
correction. If the background is overestimated, then the SR will be
overestimated, too, and vice versa. The reliability of the SR values
can be enhanced when we switch from the image space to the Fourier
space by
![\begin{figure}
\par\includegraphics[width=8.8cm,clip]{fig/f2914_11.ps} \end{figure}](/articles/aa/full/2003/07/aa2914/img38.gif) |
Figure 7: Visualization of the theoretical and measured OTF at the example of filter FeII1644. |
| Open with DEXTER | |
A number of error sources contribute to the error of the SR values on
image. Beside of small error contributions due to uncertainties of
the pixel scale and the flatfield, the remaining uncertainty of the
background correction and the detector response lead us to estimate an
absolute error of ![]() %. The expected wavelength dependency of
the MTF error is minor with respect to the remaining background
error. Therefore it is neglected and we use the constant value given
above derived from experience in reducing the experimental data.
%. The expected wavelength dependency of
the MTF error is minor with respect to the remaining background
error. Therefore it is neglected and we use the constant value given
above derived from experience in reducing the experimental data.
Recall that the SR by PD has a maximal wavelength-dependent
error of ![]() % at 1
% at 1 ![]() m and
m and ![]() % at 2
% at 2 ![]() m taking
into account an error of
m taking
into account an error of ![]() nm RMS for the focus estimation
(i=4). The main contributor to this error is a systematic error in
the precision of the pinhole positions in the Zernike tool (see
Sect. 4.1).
nm RMS for the focus estimation
(i=4). The main contributor to this error is a systematic error in
the precision of the pinhole positions in the Zernike tool (see
Sect. 4.1).
In general the PD SRs exceed the other SR values. This reflects the fact that the wavefront is expanded by a limited number of Zernike coefficients and the higher order aberrations are cut off. Note that it is not astonishing that in the case of very low SR values (worse than 50%) the PD SR value may lie below the image SRs (Fig. 9). Such strong wavefront errors violate the condition under which Eq. (5) is valid. Thus, we expect Eq. (5) to yield underestimated values.
The comparison of the SR values determined by the different methods turns out to be consistent. The longer the wavelength, the more the image and PD SR values approach each other. This shows that the influence of aberrations scales with the wavelength. In other words, the fact that we cut off at a certain Zernike number (i=15) has a greater impact at short wavelengths.
![\begin{figure}
\par\includegraphics[width=8.8cm,clip]{fig/f2914_12.ps} \end{figure}](/articles/aa/full/2003/07/aa2914/img41.gif) |
Figure 8: Comparison of SR versus wavelength in J and H band calculated directly and derived from PD results. |
| Open with DEXTER | |
![\begin{figure}
\par\includegraphics[width=8.8cm,clip]{fig/f2914_13.ps} \end{figure}](/articles/aa/full/2003/07/aa2914/img42.gif) |
Figure 9: Comparison of SR versus wavelength in K band calculated directly and derived from PD results. |
| Open with DEXTER | |
Having in mind the small estimated wavefront errors that we presented in the previous sections we become conscious of the required precision of the most trivial aberration we regard: the focus. It is striking that even in the focus determination we depend on the precision of PD calibration. This becomes evident when we look at the conventional procedure of focus tuning and regard the loss of SR caused by the detected aberrations.
To tune the focus of CONICA, the in-focus pinhole of the Zernike tool
is imaged on the detector. Now, a focus curve is obtained by taking
images at different axial position of the detector stage (see Sect. 3.1). The maximum of the SRs indicate
the proper focus position of the stage. The maximum of the obtained
focus curves for the different cameras can be located with an accuracy
of about 50 nm rms. For this wavefront error, Eq. (5)
yields a loss of SR of 2.5% at a wavelength of 2 ![]() m and almost
10% at 1
m and almost
10% at 1 ![]() m. Thus, in particular in the J- and H-band, the
inaccuracy of determining the focus only by moving the detector stage
gives reason for a significant loss of SR. Furthermore the whole
effort of fine-tuning for the remaining static wavefront aberrations
becomes irrelevant when the remaining focus error is in the regime of
the highest higher-level aberrations (Zernike number
m. Thus, in particular in the J- and H-band, the
inaccuracy of determining the focus only by moving the detector stage
gives reason for a significant loss of SR. Furthermore the whole
effort of fine-tuning for the remaining static wavefront aberrations
becomes irrelevant when the remaining focus error is in the regime of
the highest higher-level aberrations (Zernike number ![]() ). Compare the aberrations for focus with astigmatism in
Figs. 4 and 5. The only way to achieve a
significant improvement of the wavefront error, and therefore of the
SR after closed loop compensation, is to ensure that the
residual focus deviation is corrected properly, too. This is
guaranteed by following the procedure:
). Compare the aberrations for focus with astigmatism in
Figs. 4 and 5. The only way to achieve a
significant improvement of the wavefront error, and therefore of the
SR after closed loop compensation, is to ensure that the
residual focus deviation is corrected properly, too. This is
guaranteed by following the procedure:
Figure 10 shows two extreme cases of applying AO compensation. The upper pictures demonstrate the correction for a filter in J-band, the pictures below in K-band. In accordance with Figs. 4 and 5 the sensed aberrations in Jand K band are very similar - recall that the main contribution arises from the achromatic camera objective and the NAOS dichroic. But even if similar correction coefficients are rendered to the AO system, the effect on the image is strongly wavelength dependent. This is due to the fact that the influence of the applied Zernike coefficients scales with the wavelength. Thus, we achieve a striking correction in J-band visible with the naked eye on the images before and after correction. The most important aberration, the astigmatism, vanishes and the PSF is contracted. In K-band the non-corrected image is already very close to the optimum and the improvement is hard to see directly on the image. But calculating the SRs shows that even in K-band the performed correction is still significant (Table 5). Note that the given error arises from a maximum estimate of all error sources as described in Sect. 5.2. The nature of the error is mainly systematic (e.g., caused by background correction) and affects the calculated SRs for the image pairs in the same way. SRs determined on experimental data are intrinsically afflicted by rather high error bars, but a direct inspection of the images (central intensity, shape of the diffraction rings) shows the relative gain of 2 to 3% in K-band to be true. Even this rather small appearing gain in K is of high importance. On the way to scientific goals such as e.g. planet detection, the total error budget must be tackled to eliminate every percentage point of loss in SR.
![\begin{figure}
\par {\hspace*{2cm}Filter P\_gamma}\\
\mbox{\includegraphics[wi...
...s} \includegraphics[width=0.24 \textwidth,clip]{fig/f2914_17.ps} }
\end{figure}](/articles/aa/full/2003/07/aa2914/img44.gif) |
Figure 10: Comparison of PSFs before and after closed loop compensation. Above a couple of J-band images and at the bottom a couple of K-band images are shown. Left side: without AO correction. Right side: with AO correction. Especially in J-band, the sharpening of the PSF can be clearly seen. |
| Open with DEXTER | |
| Filter | SR no corr (%) | SR with corr (%) |
| Pgamma | 60 |
70 |
| Ks | 91 |
93 |
The design of the instrument control software is harmonized with this calibration procedure and the AO loop parameters are automatically updated when the instrument setup changes. This ensures that the utmost optical performance is provided for all the configurations. Additionally, this implementation of wavefront sensing can be used to monitor the optical quality and to alert for small degradations of optical performance. In general, for future high performance AO systems, the presented technique is of great importance to achieve the challenging science goals of the astronomical community. It should be included in the instrumental design at a very early phase.
Acknowledgements
We would like to thank Eric Gendron and Wolfgang Brandner for their patience and assistance in the fine tuning of the instrument and interpretation of the measurements during the commissioning runs. Furthermore, we thank Gert Finger for the fruitful discussions about the detector characteristics. We are thankful to Norbert Hubin for the assistance to this work on the part of the European Southern Observatory. This research was partially supported through a European Southern Observatory contract and the Marie Curie Fellowship Association of the European Community.