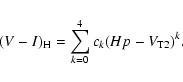
The central idea of this study is to derive new sets of V-I color
indices for
red stars bypassing all various methods used in the original derivation
of V-I (ESA 1997). We abandon the calibration methods based upon the
ground-based B-V or Tycho
![]() for two reasons. First, the
B-V color index, at least for carbon stars, is a poor representative
of effective temperature due to the severe blanketing effect by molecular
bands (Alksne et al. 1991) in the BV bandpasses.
Second, many Hipparcos red stars have such a large
B-V color index that their measurements are uncertain or, in the case of
Tycho magnitudes, missing due to extremely low fluxes in the
for two reasons. First, the
B-V color index, at least for carbon stars, is a poor representative
of effective temperature due to the severe blanketing effect by molecular
bands (Alksne et al. 1991) in the BV bandpasses.
Second, many Hipparcos red stars have such a large
B-V color index that their measurements are uncertain or, in the case of
Tycho magnitudes, missing due to extremely low fluxes in the ![]() bandpass. In this sense the potential of Tycho
bandpass. In this sense the potential of Tycho
![]() photometry
for red stars is limited. However, there is a color index,
photometry
for red stars is limited. However, there is a color index,
![]() ,
which to our knowledge, has been used neither in the Hipparcos
reductions nor the following studies.
,
which to our knowledge, has been used neither in the Hipparcos
reductions nor the following studies.
![\begin{figure}
\par\includegraphics[width=8.8cm,clip]{ms3108f2.eps}
\end{figure}](/articles/aa/full/2003/03/aa3108/img59.gif) |
Figure 2:
Normalized response curves for the Hipparcos
Hp (solid line), Tycho |
First trials using the published Tycho ![]() photometry indicated
two problems. First, a large fraction of red stars lack Tycho
photometry. Second, the
photometry indicated
two problems. First, a large fraction of red stars lack Tycho
photometry. Second, the ![]() photometry shows a progressively
increasing bias at faint magnitudes (
photometry shows a progressively
increasing bias at faint magnitudes (
![]() ). This effect is
illustrated by Fig. 3 where
). This effect is
illustrated by Fig. 3 where
![]() values are
abnormally small at Hp>8, equivalent to the "brightening'' of
values are
abnormally small at Hp>8, equivalent to the "brightening'' of
![]() at these Hp magnitudes.
at these Hp magnitudes.
All transits of about 2.5 million stars included in the
Tycho-2 Catalogue are represented in the ICDB by sequences of
13 time-ordered photon
counts, separately for the inclined and vertical slits, and the
![]() and
and ![]() bandpasses. Combined with some instrument calibration
files, this data base is sufficient to reproduce a complete astrometric
solution for any Tycho-2 star, including its possible binarity status,
photometric variability, etc. In this paper, we exploit the
possibility to extract epoch photometry for selected stars by estimating
the signal at the pre-computed, mission-averaged astrometric position.
bandpasses. Combined with some instrument calibration
files, this data base is sufficient to reproduce a complete astrometric
solution for any Tycho-2 star, including its possible binarity status,
photometric variability, etc. In this paper, we exploit the
possibility to extract epoch photometry for selected stars by estimating
the signal at the pre-computed, mission-averaged astrometric position.
The working version of Tycho-2 epoch photometry was derived some time ago for a search of a particular kind of variable stars, although it has not been implemented in the construction of the Tycho-2 Catalogue. It should be noted that, even though based on the same observational data, the Tycho-2 epoch photometry used here differs significantly from the published Tycho epoch photometry (ESA 1997). Nevertheless, the global calibrations of our current epoch photometry are consistent with the Tycho mission-average calibrations. On the star-by-star level, the Tycho-2 processing (both astrometric and photometric) is based on a single so-called Maximum Cross-Correlation estimator, while the original Tycho epoch photometry is the result of a series of successive linear and non-linear filterings (Halbwachs et al. 1997; ESA 1997, vol. 4). The main difference in the reduction procedure is that for a given star in Tycho-2, the determination of astrometric parameters was done over all collected transits at once; whereas in Tycho, a complete cycle of astrometric and photometric reductions was performed for each transit.
The latter method proved to be unreliable at a low signal-to-noise ratio, as the noise may mimic a signal from the star and produce a spurious astrometric detection and a subsequent false photometric estimate at the derived location. Such false detections tend to be abnormally bright, which then produce a bias in the faint magnitudes and hence necessitate the de-censoring analysis (Halbwachs et al. 1997) as the lesser of two evils.
The Tycho-2 epoch photometry is largely free of this de-censoring bias,
since all photometric estimations are made at the correct location of a star
image (within the astrometric precision), and all observations are retained.
Still, Tycho-2 epoch photometry can only find restricted applications
due to a possibly high background and contamination from other stars
which could be present in the
![]() -long slits of the star mapper.
-long slits of the star mapper.
We will denote the re-processed Tycho photometry as
![]() to
distinguish it from the original Tycho
to
distinguish it from the original Tycho ![]() epoch photometry.
epoch photometry.
Due to the differences in spectral features, we kept the processing
of carbon and oxygen- and zirconium-rich (M, S) stars separately.
There are 321 carbon stars and 4464 stars of M and S spectral type, which
have a pair of Hp and
![]() values. These
stars were selected according to the listed spectral type in the
Hipparcos Catalogue (field H76) but not fainter than Hp=11. In the case
of a missing spectral type, we included the stars having Hipparcos
V-I>1.5. Finally, the stars of K spectral-type were also considered if
their V-I>2. Note that for the Hipparcos photometry we used the
so-called
values. These
stars were selected according to the listed spectral type in the
Hipparcos Catalogue (field H76) but not fainter than Hp=11. In the case
of a missing spectral type, we included the stars having Hipparcos
V-I>1.5. Finally, the stars of K spectral-type were also considered if
their V-I>2. Note that for the Hipparcos photometry we used the
so-called
![]() magnitude
estimate derived from the unmodulated part of a signal intensity
(ESA 1997), since the mean photometric parameters have been obtained
from
magnitude
estimate derived from the unmodulated part of a signal intensity
(ESA 1997), since the mean photometric parameters have been obtained
from
![]() .
In addition, the ground-based photoelectric photometry
is always integrated over some aperture (usually with
.
In addition, the ground-based photoelectric photometry
is always integrated over some aperture (usually with
![]() )
centered onto the target and hence, the flux
from any object within this aperture is going to be included.
However, in Tycho-2 photometry, if the star was found
to be a binary (minimum separation
)
centered onto the target and hence, the flux
from any object within this aperture is going to be included.
However, in Tycho-2 photometry, if the star was found
to be a binary (minimum separation ![]()
![]() ), only the brightest
component has been retained and subsequently used for this study.
Because of that, the color index
), only the brightest
component has been retained and subsequently used for this study.
Because of that, the color index
![]() of resolved binaries could be
biased to some degree and thus, should be considered with caution.
of resolved binaries could be
biased to some degree and thus, should be considered with caution.
For each
star, the color index
![]() was visually examined as a function of Hpignoring the listed status flags. A pair of
was visually examined as a function of Hpignoring the listed status flags. A pair of
![]() photometry
was deleted if it deviated
from the mean trend by more than
photometry
was deleted if it deviated
from the mean trend by more than ![]() .
.
The calculated color gradients
![]() vs. the observed amplitude in Hp within the 5-to-95 percentile range,
Hp95-Hp5, are shown
in Fig. 5, separately for 136 carbon and 906 M and S stars.
For both groups of stars, the color gradient ranges between -0.1 and -0.45.
For carbon stars, the mean gradient is
vs. the observed amplitude in Hp within the 5-to-95 percentile range,
Hp95-Hp5, are shown
in Fig. 5, separately for 136 carbon and 906 M and S stars.
For both groups of stars, the color gradient ranges between -0.1 and -0.45.
For carbon stars, the mean gradient is
![]() ,
whereas it is -0.26 for the M and S stars. This indicates that on average
the gradient
,
whereas it is -0.26 for the M and S stars. This indicates that on average
the gradient
![]() is only marginally sensitive to the
C/O ratio in the atmospheres of red stars. On the other hand, for M and S
stars, the gradient is definitely correlated with the amplitude
of a brightness variation in Hp - the color gradient increases at the rate
-0.025 per mag of amplitude. Similarly, the gradient is correlated with
the median V-I for M and S stars: this merely reflects another correlation
between the amplitude of brightness variation and median V-I.
is only marginally sensitive to the
C/O ratio in the atmospheres of red stars. On the other hand, for M and S
stars, the gradient is definitely correlated with the amplitude
of a brightness variation in Hp - the color gradient increases at the rate
-0.025 per mag of amplitude. Similarly, the gradient is correlated with
the median V-I for M and S stars: this merely reflects another correlation
between the amplitude of brightness variation and median V-I.
We have not been able to find any ground-based
![]() data for the red
stars concurrent with the Hipparcos lifetime. To relate the ground-based
V-I observations to Hipparcos/Tycho photometry we postulate that a
star's luminosity-color relation (encapsulated by parameters b0 and
b1 in Eq. (2)) is constant over several decades and
adopt the
data for the red
stars concurrent with the Hipparcos lifetime. To relate the ground-based
V-I observations to Hipparcos/Tycho photometry we postulate that a
star's luminosity-color relation (encapsulated by parameters b0 and
b1 in Eq. (2)) is constant over several decades and
adopt the
![]() magnitude as a proxy to tie ground-based observations
into the Hipparcos
magnitude as a proxy to tie ground-based observations
into the Hipparcos
![]() system. In practice, it
involves two important steps. First, the ground based V magnitude should
be transformed into the system of Tycho
system. In practice, it
involves two important steps. First, the ground based V magnitude should
be transformed into the system of Tycho ![]() .
This is not trivial for
red stars, therefore we provide step-by-step instructions explaining how
to do that for carbon and M, S stars. Second, the derived
.
This is not trivial for
red stars, therefore we provide step-by-step instructions explaining how
to do that for carbon and M, S stars. Second, the derived
![]() magnitude now allows us to find the corresponding Hp value using
Eq. (2) and thus, the color
magnitude now allows us to find the corresponding Hp value using
Eq. (2) and thus, the color
![]() .
Only then, it is possible to
relate a ground-based measurement of V-I to the corresponding
.
Only then, it is possible to
relate a ground-based measurement of V-I to the corresponding
![]() value and be reasonably certain that both measurements are
on the same phase of a light curve in the case of variable stars.
As demonstrated by
Kerschbaum et al. (2001), there is no phase shift between the variability
in the V and
value and be reasonably certain that both measurements are
on the same phase of a light curve in the case of variable stars.
As demonstrated by
Kerschbaum et al. (2001), there is no phase shift between the variability
in the V and ![]() bandpasses for asymptotic giant branch stars, a dozen
of which can also be found in Table 3. A small and consistent rms
scatter of the residuals in the linear fits given in Table 3 for
additional M stars and a few carbon stars, is another reassuring sign of
the lack of a phase shift - a crucial assumption in the calibration procedure.
bandpasses for asymptotic giant branch stars, a dozen
of which can also be found in Table 3. A small and consistent rms
scatter of the residuals in the linear fits given in Table 3 for
additional M stars and a few carbon stars, is another reassuring sign of
the lack of a phase shift - a crucial assumption in the calibration procedure.
Many carbon stars are too faint in the ![]() bandpass, hence their
bandpass, hence their
![]() color index is either unreliable or is not available at all. Therefore, we
first derived a relationship between the ground-based
color index is either unreliable or is not available at all. Therefore, we
first derived a relationship between the ground-based
![]() and
and
![]() using the Walker (1979) data:
using the Walker (1979) data:
 |
(3) |
| (4) |
 |
(5) |
Owing to some, albeit
weak, dependence of TiO absorption upon the surface gravity, the stars of
spectral type M can be divided into giants and dwarfs (main sequence stars).
All stars in our sample with Hipparcos parallaxes smaller than 10 mas are
considered to be giants. For M giants,
![]() follows directly from
Eq. (1.3.36) (see ESA 1997, vol. 1):
follows directly from
Eq. (1.3.36) (see ESA 1997, vol. 1):
From the sources listed in Table 4, we have chosen 274
measurements of V-I for carbon stars and 252 for M and S stars.
Quite often there
is more than one V-I measurement for a given star. In the case of
multi-epoch ground-based V-I data, we first obtained a linear
fit to V-I as a function of V (e.g., Table 3).
The coefficients of that fit were used to estimate the
V-I index of variable stars at maximum brightness.
The corresponding
![]() color index at maximum brightness has the
advantage of being relatively insensitive to the uncertainties
affecting the
color index at maximum brightness has the
advantage of being relatively insensitive to the uncertainties
affecting the
![]() vs. Hp relation at its faint end
(see Figs. 3 and 4).
This is especially important at the
blue end of the relationship between V-I and
vs. Hp relation at its faint end
(see Figs. 3 and 4).
This is especially important at the
blue end of the relationship between V-I and
![]() (corresponding to the maximum brightness in the case of
variable stars) requires more care due to its steepness.
(corresponding to the maximum brightness in the case of
variable stars) requires more care due to its steepness.
The calibration curves for oxygen (actually M and S) stars and carbon stars are presented in Fig. 6.
Since many calibrating stars are fainter than
Hp=8, the scatter is mainly along the
![]() axis
(see also Fig. 4).
The relationship between
axis
(see also Fig. 4).
The relationship between
![]() and
and
![]() cannot be represented by a single polynomial, hence we provide segments of
calibration curves along with a color interval of their validity
(Table 6). Within this interval, a Hipparcos
cannot be represented by a single polynomial, hence we provide segments of
calibration curves along with a color interval of their validity
(Table 6). Within this interval, a Hipparcos
![]() is
is
| Spectral Type | Color Range | c0 | c1 | c2 | c3 | c4 |
| M, S |
|
1.296 | -6.362 | -5.128 | -1.8096 | 0.0 |
| M, S |
|
2.686 | -1.673 | 0.0 | 0.0 | 0.0 |
| C |
|
1.297 | -4.757 | -4.587 | -2.4904 | -0.5343 |
| C |
|
3.913 | 0.0 | 0.0 | 0.0 | 0.0 |
An important issue is to verify the system of our
![]() photometry
for red stars. The differences between the new median
photometry
for red stars. The differences between the new median
![]() and
the best available Hipparcos V-I photometry (entry H40) are plotted in
Fig. 7.
and
the best available Hipparcos V-I photometry (entry H40) are plotted in
Fig. 7.
![\begin{figure}
\par\includegraphics[width=8.8cm,clip]{ms3108f7.eps}
\end{figure}](/articles/aa/full/2003/03/aa3108/img91.gif) |
Figure 7:
Hipparcos median V-I (ESA 1997, entry H40) vs. newly derived
median
|
From the variety of available sources, we have chosen the two largest sets of
ground-based Cousins V-I data to test our
![]() color indices;
that is Koen et al. (2002) for M stars and Walker (1979) for carbon stars.
We also selected the data of Lahulla (1987), which is an independent
source of V-I, albeit in the system of Johnson VI which was not used
in the calibration.
color indices;
that is Koen et al. (2002) for M stars and Walker (1979) for carbon stars.
We also selected the data of Lahulla (1987), which is an independent
source of V-I, albeit in the system of Johnson VI which was not used
in the calibration.
![\begin{figure}
\par\includegraphics[width=8.8cm,clip]{ms3108f8.eps}
\end{figure}](/articles/aa/full/2003/03/aa3108/img94.gif) |
Figure 8:
Differences between our instantaneous
|
The differences,
![]() ,
are plotted as a function of
ground-based V (Fig. 8).
For the Walker (1979) and Lahulla (1987) datasets, the mean offset
,
are plotted as a function of
ground-based V (Fig. 8).
For the Walker (1979) and Lahulla (1987) datasets, the mean offset
![]() is not more than
+0.01 mag; the scatter
of individual differences is 0.12 mag. The Koen et al. (2002) data
are instrumental to test the reliability of
is not more than
+0.01 mag; the scatter
of individual differences is 0.12 mag. The Koen et al. (2002) data
are instrumental to test the reliability of
![]() for early-type
M stars, both dwarfs and giants. We note that at
for early-type
M stars, both dwarfs and giants. We note that at
![]() the
calibration curve is very steep (left panel, Fig. 6).
At this V-I, a variation in
the
calibration curve is very steep (left panel, Fig. 6).
At this V-I, a variation in
![]() by only 0.01
mag corresponds to a 0.05 mag change in V-I. For relatively
bright Hipparcos stars (V<9), the mean offset
by only 0.01
mag corresponds to a 0.05 mag change in V-I. For relatively
bright Hipparcos stars (V<9), the mean offset
![]() is +0.04 but it increases to +0.20 for fainter stars (9<V<11).
The scatter also rises from 0.13 to 0.40 in these two intervals.
A noticeable bias in the mean
is +0.04 but it increases to +0.20 for fainter stars (9<V<11).
The scatter also rises from 0.13 to 0.40 in these two intervals.
A noticeable bias in the mean
![]() towards faint magnitudes
might be an indication of some residual systematic error either in
the Hipparcos Hp epoch photometry or in Tycho-2
towards faint magnitudes
might be an indication of some residual systematic error either in
the Hipparcos Hp epoch photometry or in Tycho-2
![]() magnitudes.
As expected, rapidly increasing errors in
magnitudes.
As expected, rapidly increasing errors in
![]() as a function of
magnitude (Fig. 4) clearly set a limitation on
the accuracy of
as a function of
magnitude (Fig. 4) clearly set a limitation on
the accuracy of
![]() .
.
Copyright ESO 2003
![\begin{figure}
\par\includegraphics[width=8.8cm,clip]{ms3108f3.eps}
\end{figure}](/articles/aa/full/2003/03/aa3108/img61.gif)
![\begin{figure}
\par\includegraphics[width=8.8cm,clip]{ms3108f4.eps}
\end{figure}](/articles/aa/full/2003/03/aa3108/img69.gif)

![\begin{figure}
\par\includegraphics[width=8.8cm,clip]{ms3108f5.eps}
\end{figure}](/articles/aa/full/2003/03/aa3108/img72.gif)
![\begin{figure}
\par\includegraphics[width=8.8cm,clip]{ms3108f6.eps}
\end{figure}](/articles/aa/full/2003/03/aa3108/img83.gif)