A&A 397, 997-1010 (2003)
DOI: 10.1051/0004-6361:20021589
I. Platais1,2 -
D. Pourbaix1,![]() -
A. Jorissen1,
-
A. Jorissen1,
![]() -
V. V. Makarov2,3 -
L. N. Berdnikov4 -
N .N. Samus5,4 -
T. Lloyd Evans6 -
T. Lebzelter7 -
J. Sperauskas8
-
V. V. Makarov2,3 -
L. N. Berdnikov4 -
N .N. Samus5,4 -
T. Lloyd Evans6 -
T. Lebzelter7 -
J. Sperauskas8
1 - Institut d'Astronomie et d'Astrophysique, Université Libre de Bruxelles,
CP 226, Boulevard du Triomphe, 1050 Bruxelles, Belgium
2 -
Universities Space Research Association, Division of Astronomy and Space
Physics, 300 D Street SW, Washington,
D.C. 20024, USA
3 -
U.S. Naval Observatory, 3450 Massachusetts Ave., NW, Washington D.C.
20392-5420, USA
4 -
Sternberg Astronomical Institute and Isaac Newton Institute of Chile,
Moscow Branch, 13 Universitetskij Prosp.,
Moscow 119992, Russia
5 -
Institute of Astronomy, Russian Academy of Sciences, 48 Pyatnitskaya Str.,
Moscow 119017, Russia
6 -
School of Physics and Astronomy, University of St Andrews, North Haugh, St Andrews, Fife, Scotland KY16 9SS
7 -
Institut für Astronomie, Universität Wien, Türkenschanzstr. 17,
1180 Vienna, Austria
8 -
Vilnius University Observatory, Ciurlionio 29, Vilnius 2009, Lithuania
Received 20 September 2002 / Accepted 28 October 2002
Abstract
For Hipparcos M, S, and C spectral type stars, we provide calibrated
instantaneous (epoch) Cousins V-I color indices
using newly derived
![]() photometry.
Three new sets of ground-based Cousins VI data have been
obtained for more than 170 carbon and red M giants. These datasets
in combination with the published sources of VI photometry served
to obtain the calibration curves linking Hipparcos/Tycho
photometry.
Three new sets of ground-based Cousins VI data have been
obtained for more than 170 carbon and red M giants. These datasets
in combination with the published sources of VI photometry served
to obtain the calibration curves linking Hipparcos/Tycho
![]() with
the Cousins V-I index. In total, 321 carbon stars and 4464 M- and
S-type stars have new V-I indices. The standard error of the
mean V-I is about 0.1 mag or better down to
with
the Cousins V-I index. In total, 321 carbon stars and 4464 M- and
S-type stars have new V-I indices. The standard error of the
mean V-I is about 0.1 mag or better down to
![]() although it deteriorates rapidly at fainter magnitudes.
These V-I indices can be used
to verify the published Hipparcos V-I color indices. Thus, we
have identified a handful of new cases where, instead of the real
target, a random field star has been observed.
A considerable fraction of the DMSA/C and DMSA/V
solutions for red stars appear not to be warranted. Most likely such
spurious solutions may originate from usage of a heavily biased
color in the astrometric processing.
although it deteriorates rapidly at fainter magnitudes.
These V-I indices can be used
to verify the published Hipparcos V-I color indices. Thus, we
have identified a handful of new cases where, instead of the real
target, a random field star has been observed.
A considerable fraction of the DMSA/C and DMSA/V
solutions for red stars appear not to be warranted. Most likely such
spurious solutions may originate from usage of a heavily biased
color in the astrometric processing.
Key words: stars: late type - stars: carbon - techniques: photometric - techniques: radial velocities
The Hipparcos Catalogue (ESA 1997) includes two sets of Cousins V-Icolor indices - a functional V-I (entry H75 in the main Hipparcos
Catalogue) and
a best available V-I at the time of the Catalogue's release (entry H40).
This color index is an important temperature indicator for late-type
stars (Dumm & Schild 1998; Bessell et al. 1998).
Since only 2989 Hipparcos stars are listed
as having direct measurements of the Cousins V-I index, nineteen
different
methods of variable accuracy were used to obtain V-I photometry
(see ESA 1997, Sect. 1.3, Appendix 5). In numerous cases the reductions
of Hipparcos V-I photometry relied heavily upon the satellite's
star mapper photometry - the Tycho
![]() color indices. However,
the Tycho photometric system alone is not well-suited for the studies of
fainter red stars. A combination of intrinsically low fluxes from these stars
in the
color indices. However,
the Tycho photometric system alone is not well-suited for the studies of
fainter red stars. A combination of intrinsically low fluxes from these stars
in the ![]() bandpass and a short crossing time (
bandpass and a short crossing time (![]() 22 ms)
of the star mapper's four vertical slits resulted in low S/N ratios.
This, in combination with the residual bias that was not fully
corrected by the de-censoring analysis (Halbwachs et al. 1997)
in deriving the Tycho photometry for faint stars, diminishes
the reliability of much of the published Hipparcos
V-I indices for stars with
22 ms)
of the star mapper's four vertical slits resulted in low S/N ratios.
This, in combination with the residual bias that was not fully
corrected by the de-censoring analysis (Halbwachs et al. 1997)
in deriving the Tycho photometry for faint stars, diminishes
the reliability of much of the published Hipparcos
V-I indices for stars with ![]() .
As demonstrated by
Koen et al. (2002), the listed Hipparcos V-I photometry of red
stars shows a disappointingly
large scatter with respect to the ground-based photoelectric V-Imeasurements. In extreme cases the disagreement can reach
up to 2-3 mag.
.
As demonstrated by
Koen et al. (2002), the listed Hipparcos V-I photometry of red
stars shows a disappointingly
large scatter with respect to the ground-based photoelectric V-Imeasurements. In extreme cases the disagreement can reach
up to 2-3 mag.
Our interest in the V-I photometry of red stars is primarily motivated
by the potential effect of incorrect V-I color indices on the chromaticity
corrections in Hipparcos astrometry. On average, a one magnitude offset
in the V-I value could introduce a ![]() 1 mas bias in the
star's position
(abscissa) along the scan direction. Besides grossly incorrect V-Iindices for some red stars (Koen et al. 2002), there is a systematic color
bias related to neglecting in the Hipparcos reductions the intrinsic color
variation in large amplitude variables such as Miras.
1 mas bias in the
star's position
(abscissa) along the scan direction. Besides grossly incorrect V-Iindices for some red stars (Koen et al. 2002), there is a systematic color
bias related to neglecting in the Hipparcos reductions the intrinsic color
variation in large amplitude variables such as Miras.
In retrospect, the Hipparcos V-I photometry would have gained
considerably from the parallel-in-time ground-based V-I observations
of stars with extreme colors and/or considerable color variability.
For a number of reasons, most importantly, a prorogated decision to choose
the V-I index, this opportunity was lost. Is it possible to improve
the Hipparcos V-I photometry now? Here we attempt to answer
this question. It appears that high-grade
V-I photometry for red stars
is possible down to ![]() and may even be used to obtain an estimate
of effective temperatures. In general, the re-calibrated V-I photometry
is useful in identifying some difficult cases in the Hipparcos Catalogue,
such as red and variable stars in binary systems.
Throughout the paper we refer to
Cousins V-I color indices, unless it is explicitly stated otherwise.
and may even be used to obtain an estimate
of effective temperatures. In general, the re-calibrated V-I photometry
is useful in identifying some difficult cases in the Hipparcos Catalogue,
such as red and variable stars in binary systems.
Throughout the paper we refer to
Cousins V-I color indices, unless it is explicitly stated otherwise.
The advantages of the broadband Cousins VRI photometric system such as high
internal precision and maintaining this precision over the whole range
of spectral types are discussed by Bessell (1979). This system emerged
with the advent of Ga-As photocathode photomultipliers in the early
1970s. There are two issues which should be considered in the broadband
photometry of red stars. First, the majority of cool red stars are
variable and no standard stars are available redder than
![]() .
Second, the presence of numerous molecular bands in the spectra of
red stars requires stable and easily reproducible bandpasses in order
to avoid possible
nonlinear transformations from the instrumental to the standard system.
In other words, to exclude the transformation uncertainties, such stars
must be observed in the natural Cousins VRI system, i.e. using the
same filters and detector. Examination of the published sources of
Cousins VRI photometry indicates that many extremely red Hipparcos
stars actually lack this photometry.
Therefore, we have obtained new sets of UBVRI photometry
of the Southern carbon stars and BVI photometry for the reddest M and C spectral-type stars.
.
Second, the presence of numerous molecular bands in the spectra of
red stars requires stable and easily reproducible bandpasses in order
to avoid possible
nonlinear transformations from the instrumental to the standard system.
In other words, to exclude the transformation uncertainties, such stars
must be observed in the natural Cousins VRI system, i.e. using the
same filters and detector. Examination of the published sources of
Cousins VRI photometry indicates that many extremely red Hipparcos
stars actually lack this photometry.
Therefore, we have obtained new sets of UBVRI photometry
of the Southern carbon stars and BVI photometry for the reddest M and C spectral-type stars.
The observations of 85 carbon stars including a few hydrogen-deficient
(Hd) stars were made in 1984 and 1987
using the single channel Modular Photometer on the
0.5 m reflector at the Sutherland station of the SAAO. The photometer uses a
Hamamatsu R943-02 GaAs photomultiplier and a filter set which reproduces the
Johnson UBV and Cousins
![]() photometric systems,
with a need for only very small linear and
non-linear terms in transformations onto the standard system.
The observations were made with frequent
reference to the E-region standard stars of Menzies et al. (1989).
The results of
photometric systems,
with a need for only very small linear and
non-linear terms in transformations onto the standard system.
The observations were made with frequent
reference to the E-region standard stars of Menzies et al. (1989).
The results of
![]() photometry are provided in
Table 1. The CGCS numbers are those in Stephenson (1989).
The last column indicates the total number of observations, usually
obtained over 2-3 nights. The standard error of individual observations is
about 0.01 mag. It was necessary, however, to extrapolate the
color system as some of the stars here are redder than any standard star in
one color or another and in any case these are carbon stars (or helium
stars in the case of Hd stars) whose colors differ
systematically from the oxygen-rich M spectral type standard stars.
In addition, most of our programme stars are variable to some degree.
All cases with apparent variability or uncertain photometry are marked by
(v) or (:), accordingly. Since in
the UBVRI photoelectric photometry the aperture size varied from
photometry are provided in
Table 1. The CGCS numbers are those in Stephenson (1989).
The last column indicates the total number of observations, usually
obtained over 2-3 nights. The standard error of individual observations is
about 0.01 mag. It was necessary, however, to extrapolate the
color system as some of the stars here are redder than any standard star in
one color or another and in any case these are carbon stars (or helium
stars in the case of Hd stars) whose colors differ
systematically from the oxygen-rich M spectral type standard stars.
In addition, most of our programme stars are variable to some degree.
All cases with apparent variability or uncertain photometry are marked by
(v) or (:), accordingly. Since in
the UBVRI photoelectric photometry the aperture size varied from
![]() to
to
![]() ,
a nearby optical component, marked in
Table 1, may affect the accuracy of our photometry.
,
a nearby optical component, marked in
Table 1, may affect the accuracy of our photometry.
![\begin{figure}
\par\includegraphics[width=8.8cm,clip]{ms3108f1.eps}
\end{figure}](/articles/aa/full/2003/03/aa3108/img39.gif) |
Figure 1: Differences between the V-magnitude (top panel) and V-I color index (bottom panel) from Table 1 and that of Walker (1979). A relatively large spread visible in the top panel is mainly due to thevariability. |
| CGCS | HIP | GCVS | V | B-V | U-B | R-I | V-I | n | CGCS | HIP | GCVS | V | B-V | U-B | R-I | V-I | n |
| 177 | AM Scl | 12.33 | 2.16 | 3.42: | 1.02 | 1.85 | 3 | 3810 | 10.39 | 1.41 | 0.90 | 0.83 | 1.63 | 5 | |||
| 196 | 5809 | 10.02 | 1.33 | 1.34 | 0.59 | 1.09 | 5 | 3813 | 11.02v | 2.39 | 2.61 | 1.30 | 2.45 | 4 | |||
| 258 | 10.19 | 1.31 | 1.16 | 0.61 | 1.12 | 6 | 3842 | 85750 | 9.37 | 1.88 | 2.02 | 0.88 | 1.66 | 5 | |||
| 327 | 10472 | V Ari | 8.71 | 2.19 | 2.45 | 1.16 | 2.15 | 6 | 3855a | 11.20 | 1.30 | 0.91 | 0.64 | 1.19 | 2 | ||
| 378 | 12028 | 8.16 | 1.24 | 0.77 | 0.60 | 1.09 | 4 | 3864a | V450 Sco | 10.30v | 2.38 | 3.56: | 1.50 | 2.82 | 4 | ||
| 576 | 17933 | 8.30 | 1.65 | 1.72 | 0.75 | 1.41 | 6 | 3938 | 88584 | W CrA | 9.95 | 1.89 | 1.83 | 0.99 | 1.81 | 4 | |
| 639 | 19269 | 10.66 | 1.23 | 0.68 | 0.72 | 1.43 | 4 | 3939 | V1783 Sgr | 10.53 | 1.54 | 1.01 | 0.94 | 1.74 | 3 | ||
| 725 | 21051 | 8.91 | 1.14 | 1.12 | 0.55 | 1.04 | 6 | 3957 | 88887 | 9.80 | 1.52 | 1.18 | 0.96 | 1.87 | 4 | ||
| 1380 | 31725 | 9.37 | 1.37 | 1.28 | 0.58 | 1.07 | 3 | 3958 | 10.45 | 1.34 | 0.95 | 0.66 | 1.23 | 6 | |||
| 1460 | 33042 | KY CMa | 10.75 | 2.73 | 4.00: | 1.33 | 2.42 | 4 | 3966a | 11.06v | 1.95 | 1.76 | 1.05 | 1.95 | 4 | ||
| 1489 | 33550 | RV Mon | 6.88 | 2.65 | 7.16: | 3 | 3992 | 89783 | FO Ser | 8.42 | 1.85 | 1.85 | 1.15 | 2.21 | 3 | ||
| 1507 | 33794 | V614 Mon | 7.32v | 1.76 | 2.14: | 1.13 | 4 | 4021 | 90694 | 9.90 | 1.39 | 0.92 | 0.81 | 1.60 | 3 | ||
| 1659 | 35549 | MY CMa | 10.63 | 2.44 | 3.08: | 1.36 | 2.55 | 3 | 4042 | 11.13 | 2.08 | 2.01 | 1.05 | 1.90 | 3 | ||
| 1790 | 9.58 | 1.85 | 2.15 | 1.11 | 2.07 | 3 | 4070 | 9.33 | 1.29 | 1.00 | 0.58 | 1.06 | 3 | ||||
| 1871a | 10.16 | 1.23 | 0.82 | 0.56 | 1.02 | 3 | 4086 | 91929 | RV Sct | 10.02 | 2.35 | 2.52 | 1.54 | 2.92 | 3 | ||
| 1968 | 38787 | V406 Pup | 7.62v | 3.20: | 4.60: | 1.40 | 4 | 4094 | 92115 | 9.49 | 0.83 | 0.47 | 0.42 | 0.67 | 3 | ||
| 2153 | 40805 | V433 Pup | 9.54v | 1.67 | 1.66 | 1.07 | 2.05 | 3 | 4145 | 93181 | V4152 Sgr | 9.33 | 1.16 | 0.84 | 0.57 | 0.94 | 1 |
| 2331 | 43093 | UZ Pyx | 7.32 | 2.01 | 2.99 | 1.09 | 4 | 4168 | 9.95 | 1.29 | 1.22 | 0.59 | 1.10 | 4 | |||
| 2449 | 45295 | GM Cnc | 8.65 | 1.57 | 1.50 | 1.00 | 1.93 | 3 | 4179a | 94049 | 10.29 | 1.26 | 0.83 | 0.60 | 1.14 | 3 | |
| 2759 | 50994 | 9.53 | 1.30 | 1.07 | 0.59 | 1.09 | 4 | 4194 | 94294 | V1445 Aql | 11.31 | 2.08 | 2.35: | 1.31 | 2.51 | 3 | |
| 2787 | 9.48 | 1.29 | 0.96 | 0.60 | 1.11 | 5 | 4196 | 10.82 | 1.42 | 1.24 | 0.68 | 1.31 | 3 | ||||
| 2829 | 52271 | 7.08 | 1.33 | 1.16 | 0.59 | 1.11 | 4 | 4229 | 94940 | V1942 Sgr | 7.06 | 2.56 | 4.45: | 1 | |||
| 2852 | 52656 | TZ Car | 8.71v | 2.10 | 2.60 | 1.30 | 2.50 | 4 | 4247 | 95289 | 6.96 | 1.07 | 0.58 | 0.57 | 0.97 | 1 | |
| 2925 | 53810 | 8.33 | 1.16 | 1.08 | 0.55 | 1.05 | 4 | 4498 | 11.14 | 1.32 | 1.19 | 0.61 | 1.12 | 3 | |||
| 2975 | 54806 | 10.16 | 1.44 | 1.14 | 0.85 | 1.64 | 4 | 4524a | 98117 | 9.18 | 1.21 | 0.61 | 0.54 | 1.01 | 3 | ||
| 2986 | DI Car | 10.5 v | 1.4 v | 1.30v | 0.64v | 1.2v | 6 | 4567 | 98223 | 9.35 | 2.03 | 2.06 | 0.92 | 1.73 | 4 | ||
| 3001 | 55448 | V905 Cen | 10.51v | 1.80 | 1.87 | 1.15 | 2.20 | 4 | 4595 | 98542 | V1468 Aql | 10.36 | 2.04 | 2.55 | 1.16 | 2.13 | 3 |
| 3066 | 56551 | 8.76 | 1.06 | 0.51 | 0.51 | 0.92 | 4 | 4598 | 98538 | V1469 Aql | 8.37 | 2.08 | 2.52 | 0.96 | 1.77 | 3 | |
| 3141 | 58513 | DD Cru | 8.87 | 2.20 | 2.94: | 1.04 | 2.03 | 4 | 4614 | 98958 | 8.05 | 1.07 | 0.97 | 0.51 | 0.98 | 3 | |
| 3199 | TV Cen | 8.02v | 2.74 | 2.89 | 1.42 | 2.57 | 5 | 4873 | 101277 | BI Cap | 9.67v | 1.42 | 1.09 | 0.95 | 1.85 | 3 | |
| 3227 | 60534 | S Cen | 7.66v | 1.89 | 2.70: | 1.11 | 2.10 | 5 | 4972 | 102726 | 10.30 | 1.29 | 0.92 | 0.63 | 1.14 | 3 | |
| 3286 | 62401 | RU Vir | 9.97v | 4.63 | 5.10: | 1.99 | 3.42 | 4 | 4978 | 102706 | 8.16v | 1.28 | 0.94 | 0.58 | 1.14 | 3 | |
| 3335 | 63955 | 8.50 | 1.17 | 1.03 | 0.54 | 1.01 | 4 | 5147 | 104522 | 9.82 | 1.56 | 1.49 | 0.97 | 1.86 | 6 | ||
| 3405 | 66070 | V971 Cen | 8.50 | 1.87 | 2.12 | 1.02 | 1.94 | 5 | 5227 | 105212 | 9.67 | 1.26 | 0.87 | 0.57 | 1.06 | 5 | |
| 3492 | 70339 | RS Lup | 9.62v | 2.69 | 4.70: | 1.35 | 2.46 | 5 | 5408 | 107349 | BU Ind | 10.15v | 1.45 | 1.28 | 0.95 | 1.85 | 4 |
| 3545 | 10.95 | 1.40 | 0.80 | 0.77 | 1.44 | 5 | 5420 | 107490 | RR Ind | 9.34v | 2.84v | 5.29v | 1.31v | 2.36v | 7 | ||
| 3558 | 10.42 | 1.51 | 1.26 | 1.01 | 1.98 | 5 | 5561 | 108953 | HP Peg | 8.89 | 1.45 | 1.13 | 0.61 | 1.15 | 2 | ||
| 3606 | 75694 | HM Lib | 7.48v | 1.20 | 0.86 | 0.61 | 1.07 | 4 | 5627 | 10.71 | 1.72 | 1.63 | 0.82 | 1.50 | 3 | ||
| 3657 | 9.84 | 1.59 | 1.32 | 0.69 | 1.28 | 5 | 5761 | 113150 | 10.82 | 1.17 | 0.55 | 0.59 | 1.11 | 6 | |||
| 3672 | 79484 | 10.36 | 1.69 | 1.46 | 0.77 | 1.42 | 5 | 5823 | 114509 | 9.26 | 1.22 | 0.81 | 0.60 | 1.11 | 5 | ||
| 3707 | 81254 | LV TrA | 8.30 | 0.95 | 0.67 | 0.45 | 0.72 | 5 | 5937 | 117467 | 8.48 | 1.37 | 1.30 | 0.62 | 1.15 | 5 | |
| 3756 | 83387 | T Ara | 9.03v | 2.78 | 4.90: | 1.40 | 2.55 | 5 | 5980 | 168 | 9.55 | 1.12 | 0.48 | 0.51 | 0.96 | 4 | |
| 3765 | 9.11 | 1.39 | 1.26 | 0.65 | 1.25 | 4 |
In March-April 2002 additional
![]() photometry for 47 very red Hipparcos
carbon and M stars was secured at the Siding Spring Observatory, Australia.
The data were obtained using the 24 inch reflector and a single channel
photometer. A cooled unit containing a Hamamatsu GaAs photomultiplier tube
and a set of filters allow us to match closely the Cousins photometric
system, in the same way as was done at SAAO. Each night a set
of the E-region standards (Menzies et al. 1989) was measured to obtain
the atmospheric extinction coefficients and the transformation
coefficients to the standard system. Mean transformation coefficients
for this run were as follows:
photometry for 47 very red Hipparcos
carbon and M stars was secured at the Siding Spring Observatory, Australia.
The data were obtained using the 24 inch reflector and a single channel
photometer. A cooled unit containing a Hamamatsu GaAs photomultiplier tube
and a set of filters allow us to match closely the Cousins photometric
system, in the same way as was done at SAAO. Each night a set
of the E-region standards (Menzies et al. 1989) was measured to obtain
the atmospheric extinction coefficients and the transformation
coefficients to the standard system. Mean transformation coefficients
for this run were as follows:
![]() ,
,
![]() ,
and
,
and
![]() (see Berdnikov & Turner 2001, Eq. (2)). Hence
the instrumental system is very close to the standard BVIC system,
which greatly alleviates the problem of color-related extrapolation
in the reductions of very red programme stars.
Every 60-90 min two standard stars (red and blue) were used to
define instantaneous zeropoints in the transformation relations.
Some very bright programme stars were observed with the addition of an
Oriel 50550 neutral density filter. The
(see Berdnikov & Turner 2001, Eq. (2)). Hence
the instrumental system is very close to the standard BVIC system,
which greatly alleviates the problem of color-related extrapolation
in the reductions of very red programme stars.
Every 60-90 min two standard stars (red and blue) were used to
define instantaneous zeropoints in the transformation relations.
Some very bright programme stars were observed with the addition of an
Oriel 50550 neutral density filter. The
![]() photometry
is presented in Table 2.
photometry
is presented in Table 2.
| HIP | GCVS | JD -2 450 000 | V | B-V | V-I |
| 23203 | R Lep | 2353.915 | 11.63 | 4.60 | 3.75 |
| 23636 | T Lep | 2376.883 | 12.18 | 1.75 | 5.92 |
| 24055 | U Dor | 2376.977 | 8.61 | 1.62 | 4.17 |
| 2378.889 | 8.62 | 1.60 | 4.17 | ||
| 25004 | V1368 Ori | 2376.871 | 10.07 | 3.53 | 3.48 |
| 25673 | S Ori | 2376.874 | 8.71 | 1.65 | 4.66 |
| 28041 | U Ori | 2376.870 | 10.22 | 1.87 | 5.40 |
| 2378.880 | 9.94 | 2.00 | 5.45 | ||
| 29896 | GK Ori | 2353.919 | 9.96 | 4.22 | 3.52 |
| 34413 | W CMa | 2361.980 | 6.74 | 2.69 | 2.43 |
| 35793 | VY CMa | 2353.922 | 8.19 | 2.28 | 3.28 |
| 39967 | AS Pup | 2376.928 | 9.01 | 1.50 | 4.61 |
| 2378.919 | 9.01 | 1.48 | 4.60 | ||
| 40534 | R Cnc | 2376.925 | 11.22 | 2.26 | 5.77 |
| 2378.931 | 11.31 | 2.30 | 5.81 | ||
| 41061 | AC Pup | 2376.908 | 8.99 | 3.23 | 2.78 |
| 2378.933 | 9.04 | 3.31 | 2.80 | ||
| 43905 | T Cnc | 2353.926 | 8.23 | 4.31 | 3.29 |
| 48036 | R Leo | 2353.929 | 7.28 | 1.71 | 5.02 |
| 53085 | V Hya | 2354.036 | 7.34 | 4.66 | 3.61 |
| 53809 | R Crt | 2354.038 | 8.43 | 2.01 | 4.81 |
| 57607 | V919 Cen | 2354.039 | 6.93 | 1.59 | 4.15 |
| 63642 | RT Vir | 2354.175 | 8.25 | 1.81 | 4.67 |
| 64569 | SW Vir | 2354.178 | 7.09 | 1.72 | 4.53 |
| 67419 | W Hya | 2354.179 | 8.42 | 2.44 | 5.64 |
| 69754 | R Cen | 2354.178 | 7.48 | 1.94 | 4.22 |
| 70969 | Y Cen | 2354.181 | 8.12 | 1.60 | 4.50 |
| 75393 | RS Lib | 2354.182 | 10.79 | 1.96 | 5.41 |
| 80365 | RT Nor | 2354.183 | 10.08 | 1.01 | 0.94 |
| 80488 | U Her | 2379.168 | 8.68 | 1.60 | 4.84 |
| 80550 | V Oph | 2357.168 | 9.21 | 4.13 | 3.19 |
| 82392 | V TrA | 2364.266 | 8.16 | 2.23 | 2.24 |
| 84876 | V1079 Sco | 2354.185 | 9.40 | 3.31 | 3.34 |
| 85617 | TW Oph | 2357.168 | 7.86 | 4.24 | 3.32 |
| 85750 | 2357.174 | 9.36 | 1.93 | 1.65 | |
| 86873 | SZ Sgr | 2357.170 | 8.78 | 2.36 | 2.73 |
| 87063 | SX Sco | 2357.172 | 7.65 | 2.86 | 2.65 |
| 88341 | V4378 Sgr | 2379.172 | 10.37 | 2.97 | 3.24 |
| 88838 | VX Sgr | 2379.174 | 9.20 | 2.82 | 4.34 |
| 89739 | RS Tel | 2357.254 | 10.01 | 0.85 | 0.77 |
| 90694 | 2357.252 | 9.93 | 1.37 | 1.61 | |
| 93605 | SU Sgr | 2357.258 | 8.33 | 1.73 | 4.39 |
| 93666 | V Aql | 2357.260 | 6.78 | 3.98 | 3.07 |
| 98031 | S Pav | 2379.201 | 7.82 | 1.64 | 4.63 |
| 99082 | V1943 Sgr | 2379.195 | 7.67 | 1.77 | 4.58 |
| 99512 | X Pav | 2357.256 | 8.97 | 1.91 | 4.92 |
| 100935 | T Mic | 2357.265 | 7.68 | 1.78 | 4.76 |
Since 1996 the University of Vienna has been obtaining
UBV(RI)Cphotometry in Arizona using two 0.75 m automatic photoelectric
telescopes![]() (APT)
located on the grounds of Fairborn Observatory.
The photometer of the APT dubbed Amadeus (Strassmeier et al. 1997), has
an EMI-9828 S-20/B multi-alkali cathode photomultiplier,
which is sensitive up to
(APT)
located on the grounds of Fairborn Observatory.
The photometer of the APT dubbed Amadeus (Strassmeier et al. 1997), has
an EMI-9828 S-20/B multi-alkali cathode photomultiplier,
which is sensitive up to ![]() 900 nm. This photomultiplier in combination
with filters close to those suggested by Bessell (1976)
reproduces a
900 nm. This photomultiplier in combination
with filters close to those suggested by Bessell (1976)
reproduces a
![]() system close to the one used by Walker (1979).
In 1997 a monitoring programme of nearly 60 late spectral type semiregular and
irregular variables was initiated. Typical light curves resulting from
this programme can be found in Lebzelter (1999) and
Kerschbaum et al. (2001). A complete sample of light curves will be published
elsewhere (Lebzelter et al., in preparation). In Table 3
we present median V,
system close to the one used by Walker (1979).
In 1997 a monitoring programme of nearly 60 late spectral type semiregular and
irregular variables was initiated. Typical light curves resulting from
this programme can be found in Lebzelter (1999) and
Kerschbaum et al. (2001). A complete sample of light curves will be published
elsewhere (Lebzelter et al., in preparation). In Table 3
we present median V,
![]() ,
and an intercept a0 and slope a1
from the fit V-I vs. V for 45 selected Hipparcos variables used in the
following calibration (Sect. 3). The total number of observations
n is indicated in the last column.
,
and an intercept a0 and slope a1
from the fit V-I vs. V for 45 selected Hipparcos variables used in the
following calibration (Sect. 3). The total number of observations
n is indicated in the last column.
| HIP | GCVS | V |
|
a0 | a1 | n |
| 4008 | VY Cas | 9.49 | 4.14 | 0.66 | 0.366 | 217 |
| 5914 | Z Psc | 6.85 | 2.54 | -0.18 | 0.396 | 49 |
| 6191 | AA Cas | 8.24 | 3.47 | 0.00 | 0.422 | 206 |
| 10472 | V Ari | 8.52 | 2.07 | -1.15 | 0.379 | 30 |
| 17821 | BR Eri | 7.15 | 3.16 | -0.15 | 0.465 | 270 |
| 21046 | RV Cam | 8.16 | 3.81 | 0.38 | 0.420 | 326 |
| 22667 | o1 Ori | 4.84 | 2.50 | -0.10 | 0.536 | 83 |
| 32083 | VW Gem | 8.32 | 2.41 | -0.86 | 0.391 | 36 |
| 33369 | BG Mon | 9.66 | 2.46 | -1.40 | 0.400 | 35 |
| 41061 | AC Pup | 9.05 | 2.83 | -1.42 | 0.474 | 360 |
| 41201 | FK Hya | 7.29 | 3.48 | 0.22 | 0.446 | 388 |
| 43063 | EY Hya | 9.60 | 4.49 | 1.01 | 0.366 | 85 |
| 44601 | TT UMa | 9.02 | 3.68 | -0.17 | 0.427 | 425 |
| 44862 | CW Cnc | 8.70 | 4.03 | 0.90 | 0.360 | 67 |
| 56976 | AK Leo | 8.54 | 2.87 | -1.37 | 0.497 | 68 |
| 57504 | AZ UMa | 8.50 | 3.97 | 0.57 | 0.400 | 440 |
| 59108 | RW Vir | 7.33 | 3.63 | 0.66 | 0.405 | 377 |
| 61022 | BK Vir | 7.81 | 4.24 | 2.13 | 0.268 | 98 |
| 61839 | Y UMa | 8.39 | 4.40 | 1.92 | 0.295 | 411 |
| 66562 | V UMi | 7.91 | 2.92 | -0.95 | 0.488 | 78 |
| 69449 | EV Vir | 6.91 | 2.62 | -1.05 | 0.533 | 223 |
| 70236 | CI Boo | 6.48 | 2.93 | -0.63 | 0.549 | 182 |
| 70401 | RX Boo | 7.43 | 4.33 | 2.97 | 0.184 | 105 |
| 71644 | RV Boo | 8.24 | 4.06 | 1.30 | 0.333 | 190 |
| 73213 | FY Lib | 7.24 | 3.65 | 0.30 | 0.460 | 225 |
| 74982 | FZ Lib | 7.10 | 3.04 | -1.00 | 0.570 | 367 |
| 78574 | X Her | 6.28 | 3.92 | 1.60 | 0.371 | 346 |
| 80259 | RY CrB | 9.63 | 4.02 | 0.24 | 0.393 | 255 |
| 80704 | g Her | 4.86 | 3.47 | 1.23 | 0.461 | 291 |
| 81188 | TX Dra | 7.26 | 2.96 | -0.58 | 0.488 | 153 |
| 81747 | AX Sco | 8.73 | 4.00 | -0.60 | 0.527 | 120 |
| 82249 | AH Dra | 7.54 | 3.52 | 0.00 | 0.465 | 301 |
| 84027 | CX Her | 9.86 | 4.04 | 1.85 | 0.225 | 33 |
| 84329 | UW Her | 7.97 | 3.42 | -0.29 | 0.464 | 298 |
| 84346 | V438 Oph | 9.12 | 4.26 | 2.41 | 0.199 | 164 |
| 93989 | V398 Lyr | 7.39 | 3.30 | -0.32 | 0.490 | 265 |
| 95173 | T Sge | 9.29 | 4.66 | 2.45 | 0.236 | 276 |
| 96919 | V1351 Cyg | 6.56 | 3.06 | 0.00 | 0.466 | 226 |
| 102440 | U Del | 6.77 | 3.61 | 0.88 | 0.402 | 299 |
| 103933 | DY Vul | 7.09 | 3.58 | 0.55 | 0.425 | 207 |
| 107516 | EP Aqr | 6.63 | 4.01 | 2.16 | 0.279 | 183 |
| 109070 | SV Peg | 8.67 | 4.47 | 0.18 | 0.490 | 69 |
| 110099 | UW Peg | 8.89 | 3.39 | -0.82 | 0.473 | 207 |
| 112155 | BD Peg | 8.66 | 3.82 | 0.56 | 0.376 | 159 |
| 113173 | GO Peg | 7.37 | 2.66 | -0.76 | 0.464 | 168 |
Only two large surveys of relatively bright
red stars are available in the
![]() system - a survey of the Southern carbon stars (Walker 1979)
and the recent photometry of nearly 550 Hipparcos M stars (Koen et al. 2002).
Additional literature on the
system - a survey of the Southern carbon stars (Walker 1979)
and the recent photometry of nearly 550 Hipparcos M stars (Koen et al. 2002).
Additional literature on the
![]() photometry of Hipparcos
red stars is not rich,
therefore we included some other sources containing Johnson
photometry of Hipparcos
red stars is not rich,
therefore we included some other sources containing Johnson
![]() photometry. We used normal color indices for M0 to M8 spectral type stars
(Celis 1986, Table 4) to obtain the following relationship
between the Johnson
photometry. We used normal color indices for M0 to M8 spectral type stars
(Celis 1986, Table 4) to obtain the following relationship
between the Johnson
![]() and Cousins
and Cousins
![]() :
:
 |
(1) |
| Source | n | Type | System | Remarks |
| Bagnulo et al. (1998) | 1 | C | Cousins | |
| Barnes (1973) | 11 | M | Johnson | narrow-band I |
| Celis (1982) | 24 | M | Kron(?) | |
| Celis (1986) | 20 | M | Cousins | |
| Eggen (1972) | 30 | C | Eggen | |
| de Laverny et al. (1997) | 2 | C | Cousins | |
| Kizla (1982) | 36 | C, M | Johnson | |
| Koen et al. (2002) | 80 | M | Cousins | only V<8.4 |
| Lee (1970) | 43 | M | Johnson | |
| Mendoza & Johnson (1965) | 33 | C | Johnson | |
| Olson & Richer (1975) | 11 | C | Johnson | |
| Percy et al. (2001) | 16 | C, M | Johnson | |
| Walker (1979) | 119 | C | Cousins | |
| Table 1 | 61 | C | Cousins | this study |
| Table 2 | 42 | C, M | Cousins | this study |
| Table 3 | 45 | C, M | Cousins | this study |
Although radial velocities have no direct bearing on the photometry, they could be used to identify spectroscopic binaries and hence shed light on possible discrepancies in the photometry caused by duplicity. We selected 19 Hipparcos carbon stars, mostly R type. The radial velocity measurements were made with a Coravel-type spectrometer using the Steward Observatory 1.6 m Kuiper Telescope at Mt. Bigelow, Arizona in February, 2002. Additional measurements were also obtained with the Moletai Observatory 1.65 m telescope in Lithuania and the 1.5 m telescope of the Turkish National Observatory near Antalya. A detailed description of the spectrometer is given in Upgren et al. (2002). On average, the estimated precision of a single measurement is 0.7 km s-1. A total of 61 measurements of radial velocity are given in Table 5, where columns 1-6 are Hipparcos number, carbon star number from Stephenson (1989), GCVS variable star name (Kholopov et al. 1985-1995), Julian date, heliocentric radial velocity and its estimated standard error, both in km s-1. More details on the observing and reduction procedure can be found in Upgren et al. (2002). By examining the ratio of external and internal error in accordance with Jasniewicz & Mayor (1988), it is evident that two stars in Table 5, HIP 53522 and 53832, are new SB1 spectroscopic binaries, although the time span is too short for the orbit determination. Both stars are suspected CH-like carbon stars (Hartwick & Cowley 1985), which adds more weight to the paradigm that most CH stars are binaries.
| HIP | CGCS | GCVS | JD-2 450 000 |
|
|
HIP | CGCS | GCVS | JD-2 450 000 |
|
|
| 26927 | 1035 | 2327.617 | 42.5 | 0.6 | 53832 | 2919 | 2327.946 | 5.2 | 0.7 | ||
| 2332.630 | 42.2 | 0.6 | 2332.843 | 3.4 | 0.6 | ||||||
| 29896 | 1222 | GK Ori | 2330.729 | 54.6 | 1.5 | 2363.492 | -2.8 | 0.7 | |||
| 1226 | V1393 Oria | 2332.641 | 34.2 | 0.6 | 2368.389 | -3.1 | 0.7 | ||||
| 29961 | 1230 | V1394 Ori | 2327.658 | 70.8 | 0.7 | 2382.344 | -5.5 | 0.7 | |||
| 31829 | 1337 | NY Gem | 2327.732 | -123.0 | 0.8 | 2386.347 | -6.4 | 0.7 | |||
| 32187 | 1373 | V738 Mon | 2327.706 | 60.3 | 0.7 | 2399.392 | -8.9 | 0.7 | |||
| 2332.650 | 61.2 | 0.7 | 2403.329 | -8.4 | 0.7 | ||||||
| 33369 | 1474 | BG Mon | 2327.752 | 71.4 | 0.7 | 2419.261 | -11.5 | 0.7 | |||
| 2333.745 | 71.6 | 0.7 | 2423.270 | -12.1 | 0.7 | ||||||
| 2350.255 | 71.4 | 0.7 | 58786 | 3156 | 2349.500 | -21.3 | 0.7 | ||||
| 34413 | 1565 | W CMa | 2330.686 | 18.9 | 0.6 | 2368.400 | -21.4 | 0.7 | |||
| 2333.737 | 19.6 | 0.6 | 2386.299 | -21.2 | 0.7 | ||||||
| 35681 | 1622 | RU Cam | 2350.266 | -24.4 | 0.6 | 62944 | 2327.992 | 8.5 | 0.6 | ||
| 2356.253 | -26.3 | 0.7 | 2332.853 | 6.5 | 0.6 | ||||||
| 2375.335 | -24.9 | 0.7 | 2363.504 | 6.7 | 0.6 | ||||||
| 38242 | 1891 | 2327.760 | 13.7 | 0.7 | 2368.416 | 6.2 | 0.6 | ||||
| 2332.664 | 15.7 | 0.7 | 2382.382 | 7.3 | 0.6 | ||||||
| 39118 | 1981 | 2327.772 | 95.5 | 0.7 | 63955 | 3335 | 2327.957 | -9.2 | 0.7 | ||
| 2332.670 | 96.2 | 0.7 | 2332.919 | -10.1 | 0.6 | ||||||
| 44812 | 2428 | 2327.917 | 20.2 | 0.7 | 69089 | 2330.980 | -20.3 | 0.6 | |||
| 2350.314 | 20.1 | 0.8 | 2332.906 | -20.3 | 0.7 | ||||||
| 2375.300 | 20.7 | 0.7 | 2359.572 | -21.4 | 0.6 | ||||||
| 50412 | 2715 | 2349.486 | -84.8 | 0.7 | 2382.449 | -20.2 | 0.6 | ||||
| 2386.284 | -84.9 | 0.7 | 2399.479 | -20.9 | 0.6 | ||||||
| 53354 | 2892 | 2330.801 | 4.7 | 0.7 | |||||||
| 2332.827 | 5.8 | 0.8 | |||||||||
| 53522 | 2900 | 2327.938 | 28.0 | 0.6 | |||||||
| 2369.333 | 31.5 | 0.7 | |||||||||
| 2375.326 | 33.3 | 0.7 | |||||||||
| 2382.336 | 34.9 | 0.7 | |||||||||
| 2386.337 | 34.3 | 0.7 | |||||||||
| 2399.377 | 36.3 | 0.7 | |||||||||
| 2403.322 | 37.5 | 0.7 | |||||||||
| 2419.255 | 37.5 | 0.7 | |||||||||
| 2423.255 | 38.5 | 0.7 |
The central idea of this study is to derive new sets of V-I color
indices for
red stars bypassing all various methods used in the original derivation
of V-I (ESA 1997). We abandon the calibration methods based upon the
ground-based B-V or Tycho
![]() for two reasons. First, the
B-V color index, at least for carbon stars, is a poor representative
of effective temperature due to the severe blanketing effect by molecular
bands (Alksne et al. 1991) in the BV bandpasses.
Second, many Hipparcos red stars have such a large
B-V color index that their measurements are uncertain or, in the case of
Tycho magnitudes, missing due to extremely low fluxes in the
for two reasons. First, the
B-V color index, at least for carbon stars, is a poor representative
of effective temperature due to the severe blanketing effect by molecular
bands (Alksne et al. 1991) in the BV bandpasses.
Second, many Hipparcos red stars have such a large
B-V color index that their measurements are uncertain or, in the case of
Tycho magnitudes, missing due to extremely low fluxes in the ![]() bandpass. In this sense the potential of Tycho
bandpass. In this sense the potential of Tycho
![]() photometry
for red stars is limited. However, there is a color index,
photometry
for red stars is limited. However, there is a color index,
![]() ,
which to our knowledge, has been used neither in the Hipparcos
reductions nor the following studies.
,
which to our knowledge, has been used neither in the Hipparcos
reductions nor the following studies.
![\begin{figure}
\par\includegraphics[width=8.8cm,clip]{ms3108f2.eps}
\end{figure}](/articles/aa/full/2003/03/aa3108/img59.gif) |
Figure 2:
Normalized response curves for the Hipparcos
Hp (solid line), Tycho |
First trials using the published Tycho ![]() photometry indicated
two problems. First, a large fraction of red stars lack Tycho
photometry. Second, the
photometry indicated
two problems. First, a large fraction of red stars lack Tycho
photometry. Second, the ![]() photometry shows a progressively
increasing bias at faint magnitudes (
photometry shows a progressively
increasing bias at faint magnitudes (
![]() ). This effect is
illustrated by Fig. 3 where
). This effect is
illustrated by Fig. 3 where
![]() values are
abnormally small at Hp>8, equivalent to the "brightening'' of
values are
abnormally small at Hp>8, equivalent to the "brightening'' of
![]() at these Hp magnitudes.
at these Hp magnitudes.
All transits of about 2.5 million stars included in the
Tycho-2 Catalogue are represented in the ICDB by sequences of
13 time-ordered photon
counts, separately for the inclined and vertical slits, and the
![]() and
and ![]() bandpasses. Combined with some instrument calibration
files, this data base is sufficient to reproduce a complete astrometric
solution for any Tycho-2 star, including its possible binarity status,
photometric variability, etc. In this paper, we exploit the
possibility to extract epoch photometry for selected stars by estimating
the signal at the pre-computed, mission-averaged astrometric position.
bandpasses. Combined with some instrument calibration
files, this data base is sufficient to reproduce a complete astrometric
solution for any Tycho-2 star, including its possible binarity status,
photometric variability, etc. In this paper, we exploit the
possibility to extract epoch photometry for selected stars by estimating
the signal at the pre-computed, mission-averaged astrometric position.
The working version of Tycho-2 epoch photometry was derived some time ago for a search of a particular kind of variable stars, although it has not been implemented in the construction of the Tycho-2 Catalogue. It should be noted that, even though based on the same observational data, the Tycho-2 epoch photometry used here differs significantly from the published Tycho epoch photometry (ESA 1997). Nevertheless, the global calibrations of our current epoch photometry are consistent with the Tycho mission-average calibrations. On the star-by-star level, the Tycho-2 processing (both astrometric and photometric) is based on a single so-called Maximum Cross-Correlation estimator, while the original Tycho epoch photometry is the result of a series of successive linear and non-linear filterings (Halbwachs et al. 1997; ESA 1997, vol. 4). The main difference in the reduction procedure is that for a given star in Tycho-2, the determination of astrometric parameters was done over all collected transits at once; whereas in Tycho, a complete cycle of astrometric and photometric reductions was performed for each transit.
The latter method proved to be unreliable at a low signal-to-noise ratio, as the noise may mimic a signal from the star and produce a spurious astrometric detection and a subsequent false photometric estimate at the derived location. Such false detections tend to be abnormally bright, which then produce a bias in the faint magnitudes and hence necessitate the de-censoring analysis (Halbwachs et al. 1997) as the lesser of two evils.
The Tycho-2 epoch photometry is largely free of this de-censoring bias,
since all photometric estimations are made at the correct location of a star
image (within the astrometric precision), and all observations are retained.
Still, Tycho-2 epoch photometry can only find restricted applications
due to a possibly high background and contamination from other stars
which could be present in the
![]() -long slits of the star mapper.
-long slits of the star mapper.
We will denote the re-processed Tycho photometry as
![]() to
distinguish it from the original Tycho
to
distinguish it from the original Tycho ![]() epoch photometry.
epoch photometry.
Due to the differences in spectral features, we kept the processing
of carbon and oxygen- and zirconium-rich (M, S) stars separately.
There are 321 carbon stars and 4464 stars of M and S spectral type, which
have a pair of Hp and
![]() values. These
stars were selected according to the listed spectral type in the
Hipparcos Catalogue (field H76) but not fainter than Hp=11. In the case
of a missing spectral type, we included the stars having Hipparcos
V-I>1.5. Finally, the stars of K spectral-type were also considered if
their V-I>2. Note that for the Hipparcos photometry we used the
so-called
values. These
stars were selected according to the listed spectral type in the
Hipparcos Catalogue (field H76) but not fainter than Hp=11. In the case
of a missing spectral type, we included the stars having Hipparcos
V-I>1.5. Finally, the stars of K spectral-type were also considered if
their V-I>2. Note that for the Hipparcos photometry we used the
so-called
![]() magnitude
estimate derived from the unmodulated part of a signal intensity
(ESA 1997), since the mean photometric parameters have been obtained
from
magnitude
estimate derived from the unmodulated part of a signal intensity
(ESA 1997), since the mean photometric parameters have been obtained
from
![]() .
In addition, the ground-based photoelectric photometry
is always integrated over some aperture (usually with
.
In addition, the ground-based photoelectric photometry
is always integrated over some aperture (usually with
![]() )
centered onto the target and hence, the flux
from any object within this aperture is going to be included.
However, in Tycho-2 photometry, if the star was found
to be a binary (minimum separation
)
centered onto the target and hence, the flux
from any object within this aperture is going to be included.
However, in Tycho-2 photometry, if the star was found
to be a binary (minimum separation ![]()
![]() ), only the brightest
component has been retained and subsequently used for this study.
Because of that, the color index
), only the brightest
component has been retained and subsequently used for this study.
Because of that, the color index
![]() of resolved binaries could be
biased to some degree and thus, should be considered with caution.
of resolved binaries could be
biased to some degree and thus, should be considered with caution.
For each
star, the color index
![]() was visually examined as a function of Hpignoring the listed status flags. A pair of
was visually examined as a function of Hpignoring the listed status flags. A pair of
![]() photometry
was deleted if it deviated
from the mean trend by more than
photometry
was deleted if it deviated
from the mean trend by more than ![]() .
.
The calculated color gradients
![]() vs. the observed amplitude in Hp within the 5-to-95 percentile range,
Hp95-Hp5, are shown
in Fig. 5, separately for 136 carbon and 906 M and S stars.
For both groups of stars, the color gradient ranges between -0.1 and -0.45.
For carbon stars, the mean gradient is
vs. the observed amplitude in Hp within the 5-to-95 percentile range,
Hp95-Hp5, are shown
in Fig. 5, separately for 136 carbon and 906 M and S stars.
For both groups of stars, the color gradient ranges between -0.1 and -0.45.
For carbon stars, the mean gradient is
![]() ,
whereas it is -0.26 for the M and S stars. This indicates that on average
the gradient
,
whereas it is -0.26 for the M and S stars. This indicates that on average
the gradient
![]() is only marginally sensitive to the
C/O ratio in the atmospheres of red stars. On the other hand, for M and S
stars, the gradient is definitely correlated with the amplitude
of a brightness variation in Hp - the color gradient increases at the rate
-0.025 per mag of amplitude. Similarly, the gradient is correlated with
the median V-I for M and S stars: this merely reflects another correlation
between the amplitude of brightness variation and median V-I.
is only marginally sensitive to the
C/O ratio in the atmospheres of red stars. On the other hand, for M and S
stars, the gradient is definitely correlated with the amplitude
of a brightness variation in Hp - the color gradient increases at the rate
-0.025 per mag of amplitude. Similarly, the gradient is correlated with
the median V-I for M and S stars: this merely reflects another correlation
between the amplitude of brightness variation and median V-I.
We have not been able to find any ground-based
![]() data for the red
stars concurrent with the Hipparcos lifetime. To relate the ground-based
V-I observations to Hipparcos/Tycho photometry we postulate that a
star's luminosity-color relation (encapsulated by parameters b0 and
b1 in Eq. (2)) is constant over several decades and
adopt the
data for the red
stars concurrent with the Hipparcos lifetime. To relate the ground-based
V-I observations to Hipparcos/Tycho photometry we postulate that a
star's luminosity-color relation (encapsulated by parameters b0 and
b1 in Eq. (2)) is constant over several decades and
adopt the
![]() magnitude as a proxy to tie ground-based observations
into the Hipparcos
magnitude as a proxy to tie ground-based observations
into the Hipparcos
![]() system. In practice, it
involves two important steps. First, the ground based V magnitude should
be transformed into the system of Tycho
system. In practice, it
involves two important steps. First, the ground based V magnitude should
be transformed into the system of Tycho ![]() .
This is not trivial for
red stars, therefore we provide step-by-step instructions explaining how
to do that for carbon and M, S stars. Second, the derived
.
This is not trivial for
red stars, therefore we provide step-by-step instructions explaining how
to do that for carbon and M, S stars. Second, the derived
![]() magnitude now allows us to find the corresponding Hp value using
Eq. (2) and thus, the color
magnitude now allows us to find the corresponding Hp value using
Eq. (2) and thus, the color
![]() .
Only then, it is possible to
relate a ground-based measurement of V-I to the corresponding
.
Only then, it is possible to
relate a ground-based measurement of V-I to the corresponding
![]() value and be reasonably certain that both measurements are
on the same phase of a light curve in the case of variable stars.
As demonstrated by
Kerschbaum et al. (2001), there is no phase shift between the variability
in the V and
value and be reasonably certain that both measurements are
on the same phase of a light curve in the case of variable stars.
As demonstrated by
Kerschbaum et al. (2001), there is no phase shift between the variability
in the V and ![]() bandpasses for asymptotic giant branch stars, a dozen
of which can also be found in Table 3. A small and consistent rms
scatter of the residuals in the linear fits given in Table 3 for
additional M stars and a few carbon stars, is another reassuring sign of
the lack of a phase shift - a crucial assumption in the calibration procedure.
bandpasses for asymptotic giant branch stars, a dozen
of which can also be found in Table 3. A small and consistent rms
scatter of the residuals in the linear fits given in Table 3 for
additional M stars and a few carbon stars, is another reassuring sign of
the lack of a phase shift - a crucial assumption in the calibration procedure.
Many carbon stars are too faint in the ![]() bandpass, hence their
bandpass, hence their
![]() color index is either unreliable or is not available at all. Therefore, we
first derived a relationship between the ground-based
color index is either unreliable or is not available at all. Therefore, we
first derived a relationship between the ground-based
![]() and
and
![]() using the Walker (1979) data:
using the Walker (1979) data:
 |
(3) |
| (4) |
 |
(5) |
Owing to some, albeit
weak, dependence of TiO absorption upon the surface gravity, the stars of
spectral type M can be divided into giants and dwarfs (main sequence stars).
All stars in our sample with Hipparcos parallaxes smaller than 10 mas are
considered to be giants. For M giants,
![]() follows directly from
Eq. (1.3.36) (see ESA 1997, vol. 1):
follows directly from
Eq. (1.3.36) (see ESA 1997, vol. 1):
From the sources listed in Table 4, we have chosen 274
measurements of V-I for carbon stars and 252 for M and S stars.
Quite often there
is more than one V-I measurement for a given star. In the case of
multi-epoch ground-based V-I data, we first obtained a linear
fit to V-I as a function of V (e.g., Table 3).
The coefficients of that fit were used to estimate the
V-I index of variable stars at maximum brightness.
The corresponding
![]() color index at maximum brightness has the
advantage of being relatively insensitive to the uncertainties
affecting the
color index at maximum brightness has the
advantage of being relatively insensitive to the uncertainties
affecting the
![]() vs. Hp relation at its faint end
(see Figs. 3 and 4).
This is especially important at the
blue end of the relationship between V-I and
vs. Hp relation at its faint end
(see Figs. 3 and 4).
This is especially important at the
blue end of the relationship between V-I and
![]() (corresponding to the maximum brightness in the case of
variable stars) requires more care due to its steepness.
(corresponding to the maximum brightness in the case of
variable stars) requires more care due to its steepness.
The calibration curves for oxygen (actually M and S) stars and carbon stars are presented in Fig. 6.
Since many calibrating stars are fainter than
Hp=8, the scatter is mainly along the
![]() axis
(see also Fig. 4).
The relationship between
axis
(see also Fig. 4).
The relationship between
![]() and
and
![]() cannot be represented by a single polynomial, hence we provide segments of
calibration curves along with a color interval of their validity
(Table 6). Within this interval, a Hipparcos
cannot be represented by a single polynomial, hence we provide segments of
calibration curves along with a color interval of their validity
(Table 6). Within this interval, a Hipparcos
![]() is
is
| Spectral Type | Color Range | c0 | c1 | c2 | c3 | c4 |
| M, S |
|
1.296 | -6.362 | -5.128 | -1.8096 | 0.0 |
| M, S |
|
2.686 | -1.673 | 0.0 | 0.0 | 0.0 |
| C |
|
1.297 | -4.757 | -4.587 | -2.4904 | -0.5343 |
| C |
|
3.913 | 0.0 | 0.0 | 0.0 | 0.0 |
An important issue is to verify the system of our
![]() photometry
for red stars. The differences between the new median
photometry
for red stars. The differences between the new median
![]() and
the best available Hipparcos V-I photometry (entry H40) are plotted in
Fig. 7.
and
the best available Hipparcos V-I photometry (entry H40) are plotted in
Fig. 7.
![\begin{figure}
\par\includegraphics[width=8.8cm,clip]{ms3108f7.eps}
\end{figure}](/articles/aa/full/2003/03/aa3108/img91.gif) |
Figure 7:
Hipparcos median V-I (ESA 1997, entry H40) vs. newly derived
median
|
From the variety of available sources, we have chosen the two largest sets of
ground-based Cousins V-I data to test our
![]() color indices;
that is Koen et al. (2002) for M stars and Walker (1979) for carbon stars.
We also selected the data of Lahulla (1987), which is an independent
source of V-I, albeit in the system of Johnson VI which was not used
in the calibration.
color indices;
that is Koen et al. (2002) for M stars and Walker (1979) for carbon stars.
We also selected the data of Lahulla (1987), which is an independent
source of V-I, albeit in the system of Johnson VI which was not used
in the calibration.
![\begin{figure}
\par\includegraphics[width=8.8cm,clip]{ms3108f8.eps}
\end{figure}](/articles/aa/full/2003/03/aa3108/img94.gif) |
Figure 8:
Differences between our instantaneous
|
The differences,
![]() ,
are plotted as a function of
ground-based V (Fig. 8).
For the Walker (1979) and Lahulla (1987) datasets, the mean offset
,
are plotted as a function of
ground-based V (Fig. 8).
For the Walker (1979) and Lahulla (1987) datasets, the mean offset
![]() is not more than
+0.01 mag; the scatter
of individual differences is 0.12 mag. The Koen et al. (2002) data
are instrumental to test the reliability of
is not more than
+0.01 mag; the scatter
of individual differences is 0.12 mag. The Koen et al. (2002) data
are instrumental to test the reliability of
![]() for early-type
M stars, both dwarfs and giants. We note that at
for early-type
M stars, both dwarfs and giants. We note that at
![]() the
calibration curve is very steep (left panel, Fig. 6).
At this V-I, a variation in
the
calibration curve is very steep (left panel, Fig. 6).
At this V-I, a variation in
![]() by only 0.01
mag corresponds to a 0.05 mag change in V-I. For relatively
bright Hipparcos stars (V<9), the mean offset
by only 0.01
mag corresponds to a 0.05 mag change in V-I. For relatively
bright Hipparcos stars (V<9), the mean offset
![]() is +0.04 but it increases to +0.20 for fainter stars (9<V<11).
The scatter also rises from 0.13 to 0.40 in these two intervals.
A noticeable bias in the mean
is +0.04 but it increases to +0.20 for fainter stars (9<V<11).
The scatter also rises from 0.13 to 0.40 in these two intervals.
A noticeable bias in the mean
![]() towards faint magnitudes
might be an indication of some residual systematic error either in
the Hipparcos Hp epoch photometry or in Tycho-2
towards faint magnitudes
might be an indication of some residual systematic error either in
the Hipparcos Hp epoch photometry or in Tycho-2
![]() magnitudes.
As expected, rapidly increasing errors in
magnitudes.
As expected, rapidly increasing errors in
![]() as a function of
magnitude (Fig. 4) clearly set a limitation on
the accuracy of
as a function of
magnitude (Fig. 4) clearly set a limitation on
the accuracy of
![]() .
.
We have calculated instantaneous (epoch)
![]() color indices for
4414 M stars, 50 S stars
from the list by van Eck et al. (1998), and 321 carbon stars, which include
R, N, and Hd sub-types. A condensed version of this effort is presented
in Table 7
color indices for
4414 M stars, 50 S stars
from the list by van Eck et al. (1998), and 321 carbon stars, which include
R, N, and Hd sub-types. A condensed version of this effort is presented
in Table 7![]() ,
which contains HIP number, GCVS name for variable
stars, median Hp magnitude (entry H44, ESA 1997, vol. 1),
5-to-95 percentile Hp range or the Hp "amplitude'', coefficients
b0,b1 (if b1 has not been determined, it is set equal to zero),
median V-I from this study, spectral type (M, S, or C).
,
which contains HIP number, GCVS name for variable
stars, median Hp magnitude (entry H44, ESA 1997, vol. 1),
5-to-95 percentile Hp range or the Hp "amplitude'', coefficients
b0,b1 (if b1 has not been determined, it is set equal to zero),
median V-I from this study, spectral type (M, S, or C).
We note that about 2% of Hipparcos M, S, and C stars do not have adequate Tycho-2 photometry and, hence, are not given in Table 7. Those include some very bright stars and a number of faint stars. More than a dozen stars of intermediate brightness with 8.0>Hp>5.0failed in the Tycho-2 photometry reductions due to poor astrometry, high background and/or a parasitic signal, which corrupted the signal from the target object.
We used the derived
![]() color index and in some cases individual
slopes from the
color index and in some cases individual
slopes from the
![]() vs. Hp plot to scrutinize the identity
of some Hipparcos carbon stars. If an anonymous field star is
measured instead of a real carbon star, it could yield a positive
slope in the fit of
vs. Hp plot to scrutinize the identity
of some Hipparcos carbon stars. If an anonymous field star is
measured instead of a real carbon star, it could yield a positive
slope in the fit of
![]() vs. Hp. This is because the
Hp measures have been overcorrected, using a V-I
color index appropriate for an expected carbon star but not for the actual
target. On the other hand, the Tycho-2
vs. Hp. This is because the
Hp measures have been overcorrected, using a V-I
color index appropriate for an expected carbon star but not for the actual
target. On the other hand, the Tycho-2
![]() photometry appears to be
insensitive to the color a star really has. The net result is
a very small or even positive slope. After identifying such cases,
we checked the 2MASS Atlas Images for the true location of a carbon
star in question. The offset in position is
given in Table 8. If a carbon star has incorrect coordinates
in Alksnis et al. (2001), it is coded by "GCGCS:'' in Remarks.
If an incorrect identification is already acknowledged in the Hipparcos
Catalogue, it is indicated by the "HIP note'' in Remarks.
In the case of contradictory spectral classifications, we list
only the alternative classification, since in nearly all such cases
Hipparcos spectral type is "R...''.
None of them can be found in Alksnis et al. (2001);
therefore, the true identity of these stars has yet to be confirmed
by spectroscopic means. An exception is HIP 94049 = CGCS 4179 which is
a genuine carbon star (Houk, private communication; see also
Table 1).
photometry appears to be
insensitive to the color a star really has. The net result is
a very small or even positive slope. After identifying such cases,
we checked the 2MASS Atlas Images for the true location of a carbon
star in question. The offset in position is
given in Table 8. If a carbon star has incorrect coordinates
in Alksnis et al. (2001), it is coded by "GCGCS:'' in Remarks.
If an incorrect identification is already acknowledged in the Hipparcos
Catalogue, it is indicated by the "HIP note'' in Remarks.
In the case of contradictory spectral classifications, we list
only the alternative classification, since in nearly all such cases
Hipparcos spectral type is "R...''.
None of them can be found in Alksnis et al. (2001);
therefore, the true identity of these stars has yet to be confirmed
by spectroscopic means. An exception is HIP 94049 = CGCS 4179 which is
a genuine carbon star (Houk, private communication; see also
Table 1).
| HIP | CGCS | Remarks | ||
| 4266 | M0 (SAO) | |||
| 14055 | M0 (SAO) | |||
| 21392 | M0 (SAO) | |||
| 22767 | 808 | -21.0 | +9 | HIP note |
| 24548 | 893 | 0.0 | -242 | |
| 29564 | M0 (SAO) | |||
| 29899 | 1226 | +3.4 | +26 | GCGCS: |
| 35015 | 1615 | +7.1 | -146 | GCGCS: |
| 35119 | 1616 | +0.3 | +59 | HIP note, GCGCS: |
| 37022 | 1787 | -2.6 | +32 | HIP note, GCGCS: |
| 39337 | 2007 | +16.7 | +31 | |
| 40765 | G1V (Houk & Swift 1999) | |||
| 44235 | not C-star? (Stephenson 1989) | |||
| 75691 | 3614 | +8.38 | +94 | GCGCS: |
| 83404 | 3762 | -0.4 | -197 | GCGCS: |
| 85148 | 3820 | -1.6 | +58 | GCGCS: |
| 88170 | M0 (SAO) | |||
| 94049 | C-star, not F5V | |||
| 95024 | 4241 | +5.3 | +10 | HIP note, GCGCS: |
| 106599 | 5371 | -7.7 | +4 | HIP note, GCGCS: |
| 113840 | M0 (SAO) | |||
| 118252 | 5970 | -2.3 | -13 | HIP note, GCGCS: |
| 258 | -3.0 | 0 | ||
| 3765 | -0.6 | -42 | ||
| 3810 | +10.3 | +10 | ||
| 3813 | +0.4 | +9 | ||
| 3864 | +0.3 | -10 | ||
| 3939 | +0.5 | -2 | ||
| 3966 | 0.0 | +25 | ||
| 4042 | +0.8 | -2 | ||
| 4168 | +0.8 | -14 | ||
| 4498 | +3.7 | -35 |
Perhaps, the star HIP 12086 = 15 Tri is a prototype of a very rare but
characteristic Hipparcos problem due to the neglected poor input
coordinates. The declination of HIP 12086 listed in the Hipparcos
Input Catalogue (ESA 1992) is off
by
![]() ,
hence in the detector's instantaneous field of view
(see ESA 1997, vol. 3, Fig. 5.2) the signal has apparently been
affected by the sensitivity attenuation profile. This kind of bias
is absent in the star mapper's instrumentation. As a result,
there is a very large positive slope in the
,
hence in the detector's instantaneous field of view
(see ESA 1997, vol. 3, Fig. 5.2) the signal has apparently been
affected by the sensitivity attenuation profile. This kind of bias
is absent in the star mapper's instrumentation. As a result,
there is a very large positive slope in the
![]() vs. Hp plot.
Not only is the Hp photometry clearly corrupted but the astrometry
is also degraded as indicated by unusually large errors in the astrometric
parameters. A similar effect of poor Hipparcos performance is known
to be present, if the targets were wide binaries with separations in the
range
vs. Hp plot.
Not only is the Hp photometry clearly corrupted but the astrometry
is also degraded as indicated by unusually large errors in the astrometric
parameters. A similar effect of poor Hipparcos performance is known
to be present, if the targets were wide binaries with separations in the
range ![]()
![]() (Fabricius & Makarov 2000a).
Here we list such binaries among red stars when the epoch Hp photometry
is clearly biased: HIP 7762, 13714 & 13716, 17750, 18465, 45343,
57473, 86961, 87820, 108943, 116191, 114994. We note that from
this list the revised astrometry is already available
for HIP 17750, 86961, 87820, 116191 (Fabricius & Makarov 2000a).
(Fabricius & Makarov 2000a).
Here we list such binaries among red stars when the epoch Hp photometry
is clearly biased: HIP 7762, 13714 & 13716, 17750, 18465, 45343,
57473, 86961, 87820, 108943, 116191, 114994. We note that from
this list the revised astrometry is already available
for HIP 17750, 86961, 87820, 116191 (Fabricius & Makarov 2000a).
Strictly speaking the V-I index derived in this study for Hipparcos
binary and multiple stars could be affected by the component(s) and,
hence should be considered with caution. On the other hand, a peculiar
V-I value may very well signal a genuine problem,
be it of astrophysical or instrumental character. With this in
mind, we examined the location of complex astrometric solutions in the plot
given in Fig. 7. It turns out that certain areas,
as seen in Fig. 9, are heavily populated by such cases.
Why is it so? It is helpful to look at the relative fraction of
DMSA C,G,V, and X solutions as a function of differences between our
median
![]() and Hipparcos
and Hipparcos
![]() .
Figure 10 shows that the relative fraction of
supposedly complex systems, i.e., binary or multiple stars,
is abnormally high for red stars. For
.
Figure 10 shows that the relative fraction of
supposedly complex systems, i.e., binary or multiple stars,
is abnormally high for red stars. For
![]() and Hp<10
(see unshaded and hatched areas in Fig. 10), the relative
fraction of such systems is 40% and higher as compared to only
and Hp<10
(see unshaded and hatched areas in Fig. 10), the relative
fraction of such systems is 40% and higher as compared to only
![]()
![]() among the stars having correct
among the stars having correct
![]() index
(dark-shaded histogram).
index
(dark-shaded histogram).
Table 9 lists all red stars with
![]() .
As indicated from comparisons with
an independent ground based V-I color index (see Col. 3 in
Table 9), such differences are real. In essence,
the stars listed in Table 9 have been processed with
the
.
As indicated from comparisons with
an independent ground based V-I color index (see Col. 3 in
Table 9), such differences are real. In essence,
the stars listed in Table 9 have been processed with
the
![]() color index off by more than 2 mag!
Among such stars, the fraction of DMSA C,G,V, and X solutions - nearly
75% - is conspicuous in itself.
For example, in the case of HIP 19488 and HIP 91703, it is evident that
speckle interferometry could not confirm duplicity and, hence the
Hipparcos DMSA/C solution must be spurious. This is nearly a watertight result
since the limiting angular resolution of speckle interferometry
(Mason et al. 1999; Prieur et al. 2002) is 2-3 times higher than the separation
given in the Hipparcos Catalogue.
The other stars with a DMSA/C solution listed in Table 9
have not been observed so far under similar conditions nor are they listed
in the Fourth Catalog of Interferometric Measurements of Binary Stars
color index off by more than 2 mag!
Among such stars, the fraction of DMSA C,G,V, and X solutions - nearly
75% - is conspicuous in itself.
For example, in the case of HIP 19488 and HIP 91703, it is evident that
speckle interferometry could not confirm duplicity and, hence the
Hipparcos DMSA/C solution must be spurious. This is nearly a watertight result
since the limiting angular resolution of speckle interferometry
(Mason et al. 1999; Prieur et al. 2002) is 2-3 times higher than the separation
given in the Hipparcos Catalogue.
The other stars with a DMSA/C solution listed in Table 9
have not been observed so far under similar conditions nor are they listed
in the Fourth Catalog of Interferometric Measurements of Binary Stars![]() ,
so that their possible spurious nature has yet to be established.
Nevertheless, the high fraction of failed confirmations of binarity for
Hipparcos stars with a DMSA/C solution
(e.g., Mason et al. 1999, 2001; Prieur et al. 2002) is indicative that many such
solutions might be spurious. We suspect that the phenomenon of such
non-existent binaries among the red stars could very well be rooted
in the improper chromaticity correction applied to these stars
due to the poor knowledge of their true V-I color.
,
so that their possible spurious nature has yet to be established.
Nevertheless, the high fraction of failed confirmations of binarity for
Hipparcos stars with a DMSA/C solution
(e.g., Mason et al. 1999, 2001; Prieur et al. 2002) is indicative that many such
solutions might be spurious. We suspect that the phenomenon of such
non-existent binaries among the red stars could very well be rooted
in the improper chromaticity correction applied to these stars
due to the poor knowledge of their true V-I color.
| HIP |
|
|
Hp | DMSA |
|
Remarks | |
| 19488 | 2.41 | 0.13 | 9.535 | C | 0.18 | unresolved (Mason et al. 1999) | |
| 78501 | 2.19 | 0.14 | 10.285 | C | 0.17 | ||
| 24661 | 2.31 | 0.15 | 10.170 | ||||
| 87221 | 2.61 | 0.19 | 8.763 | C | 0.17 | ||
| 87433 | 2.27 | -0.44 | 0.28 | 8.537 | |||
| 76296 | 2.26 | 0.33 | 8.878 | C | 0.16 | ||
| 42068 | 2.33 | -0.49 | 0.41 | 8.511 | C | 0.18 | |
| 91703 | 2.65 | 0.46 | 8.799 | C,V | 0.21 | unresolved (Prieur et al. 2002) | |
| 7762 | 2.03 | 0.48 | 8.615 | X | companion star at
|
||
| 84346 | 2.05 | 0.61 | 8.454 | V | unresolved (Prieur et al. 2002) | ||
| 100404 | 2.14 | -0.76 | 0.61 | 8.464 | V | unresolved (Mason et al. 2001) | |
| 37433 | 2.17 | 0.64 | 8.984 | ||||
| 56533 | 2.64 | 0.65 | 8.581 | C | 0.24 | ||
| 84004 | 2.40 | 0.78 | 7.499 | X | |||
| 80259 | 2.19 | 0.91 | 9.017 | V | unresolved (Prieur et al. 2002) | ||
| 16328 | 2.10 | 0.98 | 9.612 | C | 0.30 | ||
| 90850 | 2.32 | 1.38 | 11.001 | ||||
| 78872 | 2.06 | -0.47 | 1.70 | 9.841 | G | ||
| 703 | 2.43 | -0.59 | 2.09 | 11.112 | V | ||
| 9767 | 2.19 | 2.10 | 9.773 | V | |||
| 11093 | 2.52 | 0.16 | 2.10 | 9.756 | V | ||
| 89886 | 3.27 | 2.26 | 10.883 | ||||
| 96031 | 2.29 | 2.64 | 10.512 | ||||
| 75393 | 3.06 | 0.32 | 2.73 | 8.554 | V | ||
| 16647 | 3.23 | 2.87 | 10.376 | V | |||
| 81026 | 2.66 | 2.89 | 11.538 | ||||
| 1901 | 2.61 | 1.27 | 2.97 | 10.705 | V | unresolved (Prieur et al. 2002) | |
| 86836 | 3.43 | 3.15 | 11.196 | V | |||
| 47066 | 2.61 | 0.87 | 3.49 | 10.073 | V | ||
| 57642 | 2.32 | 0.78 | 3.60 | 9.968 | V | ||
| 60106 | 2.04 | 3.81 | 9.854 | ||||
| 110451 | 2.01 | 3.90 | 11.460 | ||||
| 94706 | 2.81 | 0.67 | 3.97 | 10.826 | V | T Sgr: composite spectrum | |
| 25412 | 2.39 | 0.29 | 4.00 | 9.974 | V | ||
| 33824 | 2.02 | 0.97 | 4.05 | 9.922 |
Due to very complex spectra the red stars are cumbersome objects
for getting their effective temperature - one of the fundamental
stellar parameters. From different vantage points this has been
investigated, e.g., by Bessell et al. (1998), Bergeat et al. (2001), Houdashelt et al. (2000).
Although the Cousins V-I color index may not be the optimal
color to calibrate effective temperature due to the strong influence by
molecular absorption bands and possible reddening, nevertheless we
attempted to derive an empirical calibration of effective temperatures
for carbon and M giants.
We used median
![]() for Hipparcos stars having interferometric
angular diameter measurements in K (
for Hipparcos stars having interferometric
angular diameter measurements in K (
![]()
![]() m) bandpass
(Dyck et al. 1996; van Belle et al. 1997, 1999) and corresponding effective
temperature estimates. It is expected that the interstellar reddening
is low for the chosen Hipparcos stars because of their relative proximity
to the Sun. In total, from these sources of effective temperature
determinations, we selected 27 small amplitude (
m) bandpass
(Dyck et al. 1996; van Belle et al. 1997, 1999) and corresponding effective
temperature estimates. It is expected that the interstellar reddening
is low for the chosen Hipparcos stars because of their relative proximity
to the Sun. In total, from these sources of effective temperature
determinations, we selected 27 small amplitude (
![]() )
M giants in the range
3.6>V-I>1.5 and 16 carbon stars
(
3.8>V-I>2.4) with no restriction on variability.
Similarly to Dumm & Schild (1998) we adopted a linear relationship
)
M giants in the range
3.6>V-I>1.5 and 16 carbon stars
(
3.8>V-I>2.4) with no restriction on variability.
Similarly to Dumm & Schild (1998) we adopted a linear relationship
The main result of this work is demonstrating the feasibility of the
![]() color index in studies of red stars. This color
index is tightly correlated with the Cousins V-Icolor and, thus, allows us to derive an independent estimate of
color index in studies of red stars. This color
index is tightly correlated with the Cousins V-Icolor and, thus, allows us to derive an independent estimate of
![]() for carbon, M and S stars. Such estimates are indispensable
in the analysis of red variable stars, which have been little studied in
the Cousins VI system.
for carbon, M and S stars. Such estimates are indispensable
in the analysis of red variable stars, which have been little studied in
the Cousins VI system.
We have shown that a considerable fraction of Hipparcos best estimates of V-I color index (entry H40, ESA 1997) for red stars might be in error by more than a full magnitude. Conspicuously, among the most discrepant cases we find an unusually large number of DMSA C, G, V, and X solutions implicating a binary or multiple star status for these stars. On the other hand, extensive speckle interferometric observations have largely failed to confirm the binarity, despite the 2-3 times better angular resolution. This strongly suggests that some DMSA C, G, V, X solutions are not real and maybe due to the poor knowledge of the V-I color index, which served as a measure of star's color in both photometric and astrometric reductions by the Hipparcos consortia.
However, our attempts have not succeeded in improving the astrometry for single red stars. It was expected that an incomplete correction for the chromaticity effects should leave a color-related "jitter'' in the abscissa data at the level of 1-3 mas due to incorrect V-I, used in accounting for these effects. Surprisingly, we were not able to find clear traces of residual chromaticity effects, for instance, in carbon star Hipparcos astrometry. Either they have been somehow accounted for in the original Hipparcos reductions or they are insignificant.
On the other hand, the re-analysis of so-called Variability-Induced
Movers (VIM) has benefited substantially from the new set of
![]() color indices. As indicated in Sect. 4.2, some of the DMSA/V
solutions are suspected to be not warranted. Much finer analysis of
all DMSA/V solutions for red stars (Pourbaix et al. 2002)
provides strong evidence that nearly half of DMSA/V solutions are
not justified, mainly thanks to reliable V-I colors now
available at all phases of lightcurve for long-period variables such
as Miras. This knowledge of V-I colors could be useful to further
investigate other difficult systems having an extreme and changing color
in combination with hints of duplicity, which can be resolved with
interferometric means.
color indices. As indicated in Sect. 4.2, some of the DMSA/V
solutions are suspected to be not warranted. Much finer analysis of
all DMSA/V solutions for red stars (Pourbaix et al. 2002)
provides strong evidence that nearly half of DMSA/V solutions are
not justified, mainly thanks to reliable V-I colors now
available at all phases of lightcurve for long-period variables such
as Miras. This knowledge of V-I colors could be useful to further
investigate other difficult systems having an extreme and changing color
in combination with hints of duplicity, which can be resolved with
interferometric means.
Acknowledgements
We thank A. Alksnis, C. Barnbaum, C. Fabricius, N. Houk, U. Jørgensen, D. Kilkenny, B. Mason, J. Percy, and G. Wallerstein for their expert advice and help at various stages of this project. This work is supported in part by the ESA Prodex grant C15152/NL/SFe(IC). I. P. would like to thank the staff of IAA for their generous hospitality during his stay in Brussels. L.N.B. thanks the staff of Siding Spring Observatory for hospitality and technical support. T.L.E. thanks his former colleagues at SAAO, especially R. M. Banfield and A. A. van der Wielen, for their assistance. T.L. has been supported by the Austrian Academy of Science (APART programme). The work with the Vienna APT has been made possible by the Austrian Science Fund under project numbers P14365-PHY and S7301-AST. J.S. acknowledges a travel support from the National Science Foundation grant AST 98-19777 to USRA. Illuminating comments and a number of suggestions by the referee, M. Bessell, are also greatly appreciated. This research has made use of the SIMBAD database operated at CDS, Strasbourg, France. This publication makes use of data products from the Two Micron All Sky Survey, which is a joint project of the University of Massachusetts and the Infrared Processing and Analysis Center/California Institute of Technology, funded by the National Aeronautics and Space Administration and the National Science Foundation.
![\begin{figure}
\par\includegraphics[width=8.8cm,clip]{ms3108f3.eps}
\end{figure}](/articles/aa/full/2003/03/aa3108/img61.gif)
![\begin{figure}
\par\includegraphics[width=8.8cm,clip]{ms3108f4.eps}
\end{figure}](/articles/aa/full/2003/03/aa3108/img69.gif)

![\begin{figure}
\par\includegraphics[width=8.8cm,clip]{ms3108f5.eps}
\end{figure}](/articles/aa/full/2003/03/aa3108/img72.gif)
![\begin{figure}
\par\includegraphics[width=8.8cm,clip]{ms3108f6.eps}
\end{figure}](/articles/aa/full/2003/03/aa3108/img83.gif)
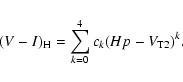
![\begin{figure}
\par\includegraphics[width=8.8cm,clip]{ms3108f9.eps}
\end{figure}](/articles/aa/full/2003/03/aa3108/img98.gif)
![\begin{figure}
\par\includegraphics[width=8.8cm,clip]{ms3108f10.eps}
\end{figure}](/articles/aa/full/2003/03/aa3108/img99.gif)