To determine the age, initial mass and E(B-V) of the clusters, we compare the observed energy distributions with energy distributions derived from theoretical cluster evolutionary synthesis models. We used two sets of models: the Starburst99 models for ages up to 1 Gyr, and the Frascati models for ages of 10 Myr to 5 Gyr. In this section the models are described.
To determine the age, initial mass and E(B-V) of the clusters, we compare the observed energy distributions with energy distributions derived from theoretical cluster evolutionary synthesis models. We used two sets of models: the Starburst99 models for ages up to 1 Gyr, and the Frascati models for ages of 10 Myr to 5 Gyr. In this section the models are described.
We compared the observed spectral energy distributions (SED) of our objects with the cluster evolutionary synthesis models of Leitherer et al. (1999), i.e. the Starburst99 models for instantaneous star formation. In these models, the stellar atmosphere models of Lejeune et al. (1997) are included. For stars with a strong mass loss the Schmutz et al. (1992) extended model atmospheres are used. The stellar evolution models of the Geneva group are included in these models. For our analysis we used the models of the Spectral Energy Distributions (SEDs).
In the cluster models the stars are assumed to be formed with a
classical Salpeter IMF-slope of
![]() .
The
lower cut-off mass is
.
The
lower cut-off mass is
![]() .
We adopt two values
for the upper cut-off mass: the standard value of
.
We adopt two values
for the upper cut-off mass: the standard value of
![]() ,
and the value of
,
and the value of
![]() .
This last value
is adopted because it is suggested by the lack of [OIII] emission (see Sect. 3.1). The total initial mass of all models is 106
.
This last value
is adopted because it is suggested by the lack of [OIII] emission (see Sect. 3.1). The total initial mass of all models is 106 ![]() .
Leitherer et al. (1999) present models for 5 different metallicities,
from Z= 0.001 to
.
Leitherer et al. (1999) present models for 5 different metallicities,
from Z= 0.001 to
![]() .
Observations of
HII-regions have shown that the metallicity of the inner region of M 51
is approximately
.
Observations of
HII-regions have shown that the metallicity of the inner region of M 51
is approximately
![]() or slightly higher (e.g. Diaz et al. 1991; Hill et al. 1997). Therefore we adopt the models with
Z=0.020 and 0.040. The almost solar metallicity agrees with the study
of Lamers et al. (2002), who found that the extinction properties and
the gas to dust-ratio in the bulge of M 51 is very similar to that in
the Milky Way. So we use four sets of models, denoted by the pair
or slightly higher (e.g. Diaz et al. 1991; Hill et al. 1997). Therefore we adopt the models with
Z=0.020 and 0.040. The almost solar metallicity agrees with the study
of Lamers et al. (2002), who found that the extinction properties and
the gas to dust-ratio in the bulge of M 51 is very similar to that in
the Milky Way. So we use four sets of models, denoted by the pair
![]() of (0.02, 100), (0.02, 30), (0.04, 100) and (0.04, 30). For
these combinations we calculated the SEDs of the cluster models,
taking into account the nebular continuum emission.
of (0.02, 100), (0.02, 30), (0.04, 100) and (0.04, 30). For
these combinations we calculated the SEDs of the cluster models,
taking into account the nebular continuum emission.
To obtain the absolute magnitudes from the theoretical spectral energy
distributions in the five broad-band filters and the two narrow-band filters
we convolved the predicted spectra of the Starburst99 models with the WFPC2
filter profiles.
The spectrum of Vega
was also convolved with the filter functions in order to find the
zero-points of the magnitudes in the VEGAMAG system.
For each combination of Z and
![]() we calculated the SED of 195 models
in the range of 0.1 Myr to 1 Gyr, with time steps increasing from
0.5 Myr for the youngest models to 10 Myr for the oldest models.
we calculated the SED of 195 models
in the range of 0.1 Myr to 1 Gyr, with time steps increasing from
0.5 Myr for the youngest models to 10 Myr for the oldest models.
The adopted lower mass limit of 1 ![]() for the cluster stars has
consequences for the derived masses of the clusters. If the IMF with a
slope of -2.35 has a lower mass limit of 0.2
for the cluster stars has
consequences for the derived masses of the clusters. If the IMF with a
slope of -2.35 has a lower mass limit of 0.2 ![]() ,
as for the
Orion Nebula Cluster (Hillenbrand 1997), the derived masses of the
clusters would be a factor 2.09 higher for an upper limit of 30
,
as for the
Orion Nebula Cluster (Hillenbrand 1997), the derived masses of the
clusters would be a factor 2.09 higher for an upper limit of 30 ![]() .
If the lower limit is
0.6
.
If the lower limit is
0.6 ![]() ,
the mass of the clusters will be a factor 1.28
higher than those of the Starburst99 models for
,
the mass of the clusters will be a factor 1.28
higher than those of the Starburst99 models for
![]()
![]() .
We will take this effect into account in the determination of the cluster masses.
.
We will take this effect into account in the determination of the cluster masses.
Some of the theoretical energy distributions in the WFPC2 wide-band filters used in this study are shown in
Fig. 5, for clusters with an initial
mass of 106 ![]() at the distance of M 51.
During the first 5 Myrs the UV flux remains high because most of
the O-type stars have main sequence ages longer than 5 Myr.
Between 5 and 10 Myr the O-type stars disappear. This results in a
general decrease at all magnitudes, except in the I band
where the red supergiants start to dominate. At later ages the flux
decreases at all wavelengths as stars end their lives. After 900 Myrs
only stars of types late-B and later have survived.
at the distance of M 51.
During the first 5 Myrs the UV flux remains high because most of
the O-type stars have main sequence ages longer than 5 Myr.
Between 5 and 10 Myr the O-type stars disappear. This results in a
general decrease at all magnitudes, except in the I band
where the red supergiants start to dominate. At later ages the flux
decreases at all wavelengths as stars end their lives. After 900 Myrs
only stars of types late-B and later have survived.
Figure 5 shows that at any wavelength in the observed range the flux decreases with time. This fading of the clusters indicates that the detection limit of the clusters will gradually shift to those of higher mass as the clusters age. This is because the flux of a cluster (for a given stellar initial mass function) at any age and wavelength is proportional to the initial number of stars. The more massive the initial cluster, the brighter the cluster and the longer the flux will remain above the detection limit as the cluster fades due to stellar evolution. For any given detection limit, we can calculate the lower mass limit of the observable cluster as a function of age.
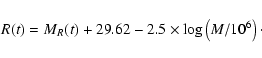
Figure 6 shows the relation between the initial mass of
a cluster and its age when it fades below the detection limit, derived
from the Starburst99 models. The R-magnitude (R) of a cluster
of initial mass Mi
without extinction at the adopted distance of 8.4 Mpc of M 51 (dm=29.62)
is related to the absolute R-magnitude (MR) predicted for the
Starburst99 models of 106 ![]() by
by
Figure 7 shows the variations of the colours
of the Starburst99 models for solar metallicity and with an upper mass
limit of 30 ![]() .
The figure shows that the colours do not change
monotonically, but that there are peaks and dips, especially in the
age range of
.
The figure shows that the colours do not change
monotonically, but that there are peaks and dips, especially in the
age range of
![]() .
These are related to the phases of
the appearance of red supergiants that also produced the dips in the
limiting magnitude curves of Fig. 6.
.
These are related to the phases of
the appearance of red supergiants that also produced the dips in the
limiting magnitude curves of Fig. 6.
Since the Starburst99 models only cover the age range up to 1 Gyr, we
also used synthetic cluster models for older ages from the Frascati group.
These "Frascati-models'' were calculated by Romaniello
(1998) from the evolutionary tracks of Brocato & Castellani (1993) and
Cassisi et al. (1994) using the HST-WFPC2 magnitudes derived from the
stellar atmosphere models by Kurucz (1993).
These models are for instantaneous formation
of a cluster of solar metallicity stars in the mass range of 0.6 to 25 ![]() ,
with a total initial mass of 50 000
,
with a total initial mass of 50 000 ![]() ,
distributed according to Salpeter's IMF. These models cover an
age range of 10 to 5000 Myr. There are 48 models with timesteps
increasing from 10 Myr for the youngest ones to 500 Myr for the oldest
ones. We have increased the magnitudes of the Frascati models
by -3.526 mag in order to scale these models to a total mass
of 106
,
distributed according to Salpeter's IMF. These models cover an
age range of 10 to 5000 Myr. There are 48 models with timesteps
increasing from 10 Myr for the youngest ones to 500 Myr for the oldest
ones. We have increased the magnitudes of the Frascati models
by -3.526 mag in order to scale these models to a total mass
of 106 ![]() in the mass range of 1.0 to 25
in the mass range of 1.0 to 25 ![]() ;
i.e. -3.25 mag
correction for the conversion from
;
i.e. -3.25 mag
correction for the conversion from
![]() to
to
![]()
![]() ,
and
0.279 mag correction for the conversion from a lower stellar mass limit of
0.6
,
and
0.279 mag correction for the conversion from a lower stellar mass limit of
0.6 ![]() to 1.0
to 1.0 ![]() .
In this way
the masses can be compared directly with those of the Starburst99 models.
.
In this way
the masses can be compared directly with those of the Starburst99 models.
The Starburst99 models are expected to be more accurate for the younger
clusters, because they are based on the evolutionary tracks of the
Geneva-group which include massive stars. The Frascati models are
expected to be more accurate for the old clusters, because they
include stars with masses down to 0.6 ![]() .
.
To determine the values of E(B-V) of the clusters we assume the mean galactic reddening law. Lamers et al. (2002) and Scuderi et al. (2002) have shown that the extinction law of respectively the bulge and the core of M 51 agree very well with the galactic law. The values of Ri=Ai/E(B-V) for the HST-WFPC2 filters have been calculated by Romaniello (1998). They are respectively 4.97, 4.13, 3.11, 2.41 and 1.91 for the U, B, V, R and I bands.
In the fitting of the energy distributions we did not take into account the disruption of clusters. We assumed that the stars contribute to the total energy distribution of the clusters until the cluster is completely dissolved and is no longer detectable as a point source. This is a reasonable assumption because we measured the magnitudes in a circle of 12 pc radius (see Sect. 2).
Copyright ESO 2003
![\begin{figure}
\par\includegraphics[width=8.8cm,clip]{h3780f5.ps} \end{figure}](/articles/aa/full/2003/02/aah3780/img96.gif)
![\begin{figure}
\par\includegraphics[width=8.8cm,clip]{h3780f6.ps}\end{figure}](/articles/aa/full/2003/02/aah3780/img99.gif)
![\begin{figure}
\par\includegraphics[width=8.8cm,clip]{h3780f7.ps}\end{figure}](/articles/aa/full/2003/02/aah3780/img104.gif)
![\begin{figure}
\par\includegraphics[width=10cm,clip]{h3780f8.ps} \end{figure}](/articles/aa/full/2003/02/aah3780/img108.gif)