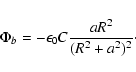
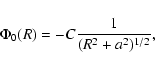
 |
(4) |
Our potential model has the benefit of being capable of analytically investigating gaseous orbits in the bar potential (Wada 1994), and has been well-studied in numerical simulations for the bar-driven gas fueling into galactic centers (Wada & Habe 1992, 1995), the gas kinematics in the Galaxy (Wada et al. 1994), the spatial distribution of mass-to-light ratio in a galaxy NGC 4321 (Wada et al. 1998), and the effects of a central black hole (Fukuda et al. 1998, 2000).
We fix
![]() and
and
![]() ;
the corresponding rotation
curve is shown in Fig. 1. The gas reaches the maximum circular
rotation velocity at
;
the corresponding rotation
curve is shown in Fig. 1. The gas reaches the maximum circular
rotation velocity at
![]() with a rotational period of
with a rotational period of
![]() .
Figure 2 shows the radial changes of frequencies,
.
Figure 2 shows the radial changes of frequencies, ![]() and
and
![]() ,
where
,
where ![]() and
and ![]() are circular and epicyclic
frequencies respectively. We set the pattern speed of the bar
are circular and epicyclic
frequencies respectively. We set the pattern speed of the bar
![]() at 0.4, 0.8, and 1.5 times the maximum of
at 0.4, 0.8, and 1.5 times the maximum of
![]() ,
indicated by horizontal
lines. Models with
,
indicated by horizontal
lines. Models with
![]() and
and
![]() have two inner Lindblad resonances (ILR),
while those with
have two inner Lindblad resonances (ILR),
while those with
![]() have no ILR.
have no ILR.
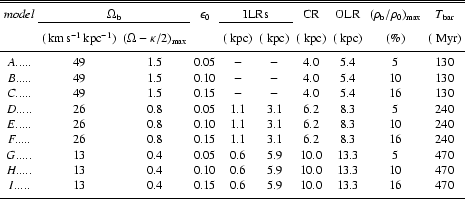
![]() is set to 0.05, 0.10,
and 0.15. Our nine models are listed in Table 1.
is set to 0.05, 0.10,
and 0.15. Our nine models are listed in Table 1.
![\begin{figure}
\par\includegraphics[width=8.8cm,clip]{h3838f1.eps} %
\end{figure}](/articles/aa/full/2002/48/aah3838/img41.gif) |
Figure 1:
Rotation curve from the axisymmetric potential, Eq. (3),
with the core radius
|
![\begin{figure}
\par\includegraphics[width=8.8cm,clip]{h3838f2.eps} %
\end{figure}](/articles/aa/full/2002/48/aah3838/img42.gif) |
Figure 2:
Radial changes of frequencies, |
The gas is initially distributed in a uniform-density disk
with an
![]() radius,
following pure circular-rotation that balances the centrifugal force.
The gas temperature is assumed to be a constant
radius,
following pure circular-rotation that balances the centrifugal force.
The gas temperature is assumed to be a constant
![]() ,
corresponding to the sound
speed of about
,
corresponding to the sound
speed of about
![]() ,
throughout evolution. The total gas mass is assumed to
be 5% of the total stellar mass within the radius of
,
throughout evolution. The total gas mass is assumed to
be 5% of the total stellar mass within the radius of
![]() .
The results are not significantly affected by the total gas mass,
because thermal pressure is much smaller than the rotational energy,
and we do not calculate self-gravity of the gas.
We advance the calculations up to about
.
The results are not significantly affected by the total gas mass,
because thermal pressure is much smaller than the rotational energy,
and we do not calculate self-gravity of the gas.
We advance the calculations up to about
![]() .
.
![\begin{figure}
\par\includegraphics[width=14cm,clip]{h3838f3.eps}
\end{figure}](/articles/aa/full/2002/48/aah3838/img51.gif) |
Figure 3:
Gas dynamical evolution in model E:
(
|
Gas dynamics in a barred potential have been well studied in numerical simulations
(Wada & Habe 1992; Heller & Shlosman 1994; Piner et al. 1995; Fukuda et al. 1998; Athanassoula & Bureau 1999). Our models evolve consistently with these
simulations.
Figure 3, model E, shows a typical evolution.
Three phases of the evolution can be seen in this model:
(a) linear perturbation phase,
![]() ,
(b) transient phase,
,
(b) transient phase,
![]() ,
and
(c) quasi-steady phase,
,
and
(c) quasi-steady phase,
![]() .
.
The characteristic structure appearing during the evolution depends strongly
on the positions
of resonances, i.e. the pattern speed of the bar
![]() .
In phase (a),
leading and trailing spiral arms are formed around the inner (
.
In phase (a),
leading and trailing spiral arms are formed around the inner (
![]() )
and
outer (
)
and
outer (
![]() )
ILRs respectively at
)
ILRs respectively at
![]() .
These resonant-driven spirals are expected in a linear
theory (Wada 1994).
While the outer trailing arms remain with increasing density contrasts,
the inner leading arms evolve into an oval ring, or a gaseous bar
(t= 71-107
.
These resonant-driven spirals are expected in a linear
theory (Wada 1994).
While the outer trailing arms remain with increasing density contrasts,
the inner leading arms evolve into an oval ring, or a gaseous bar
(t= 71-107![]() ), i.e. phase (b). The oval ring first leads the stellar bar
(
), i.e. phase (b). The oval ring first leads the stellar bar
(
![]() ), rotating opposite to the gas rotation (
), rotating opposite to the gas rotation (
![]() ), and being
aligned with the stellar bar (
), and being
aligned with the stellar bar (
![]() ), and thereafter, the system
develops toward a quasi-steady phase, i.e. phase (c). The ellipticity of
the nuclear ring grows as high as
), and thereafter, the system
develops toward a quasi-steady phase, i.e. phase (c). The ellipticity of
the nuclear ring grows as high as
![]() .
The ripple seen in the outer arms at
.
The ripple seen in the outer arms at
![]() would originate
in the Kelvin-Helmholtz instability (Piner et al. 1995).
Gas dynamics and structure in the inner region of the disk
are not affected by this instability.
would originate
in the Kelvin-Helmholtz instability (Piner et al. 1995).
Gas dynamics and structure in the inner region of the disk
are not affected by this instability.
![\begin{figure}
\par\includegraphics[width=11cm,clip]{h3838f5.eps} \end{figure}](/articles/aa/full/2002/48/aah3838/img64.gif) |
Figure 5: Final velocity fields for all nine models. The arrangement is the same as in Fig. 3. Arrows are drawn for 1500 out of total 30 000 gas particles. |
Figures 4 and 5 display the final snapshots and velocity
fields for nine models. Different pattern speeds
![]() and bar strength
and bar strength
![]() are arranged vertically and horizontally, respectively. It is evident
that the final structure depends strongly on
are arranged vertically and horizontally, respectively. It is evident
that the final structure depends strongly on
![]() ,
while
,
while
![]() changes
only the density contrasts.
Model A, B, and C have no ILRs, thus no spiral arms or ring in their inner
regions are formed.
The outer spiral arms are formed outside the radius of the corotation
resonance (CR) due to the outer Lindblad resonance (OLR).
Model D and F resemble model E. Model G, H and I also have arms and rings
similar to those in model E, but at different radii, corresponding to
the location of the ILRs.
Figure 5 clearly show that, in models D, E, F and G, most gaseous
orbits are x1-like, while in model H and I, the large separation
and low density between the two ILRs suffice to leave the gases on
x2-orbits, which form a stable oval ring, nearly perpendicular
to the stellar bar.
changes
only the density contrasts.
Model A, B, and C have no ILRs, thus no spiral arms or ring in their inner
regions are formed.
The outer spiral arms are formed outside the radius of the corotation
resonance (CR) due to the outer Lindblad resonance (OLR).
Model D and F resemble model E. Model G, H and I also have arms and rings
similar to those in model E, but at different radii, corresponding to
the location of the ILRs.
Figure 5 clearly show that, in models D, E, F and G, most gaseous
orbits are x1-like, while in model H and I, the large separation
and low density between the two ILRs suffice to leave the gases on
x2-orbits, which form a stable oval ring, nearly perpendicular
to the stellar bar.
Copyright ESO 2002
![\begin{figure}
\par\includegraphics[width=11cm,clip]{h3838f4.eps} \end{figure}](/articles/aa/full/2002/48/aah3838/img63.gif)