A&A 394, 691-699 (2002)
DOI: 10.1051/0004-6361:20021165
B. Y. Welsh1,2 - S. Sallmen1 - D. Sfeir3 - R. L. Shelton4 - R. Lallement5
1 - Experimental Astrophysics Group, Space Sciences Laboratory, UC Berkeley, Berkeley, CA 94720, USA
2 - Eureka Scientific, 2452 Delmer Street, Oakland, CA 94602-3017, USA
3 - Department of Aerospace and Mechanical Engineering, University of Southern California, Los Angeles, CA 90089, USA
4 - Department of Physics and Astronomy, Johns Hopkins University, Baltimore, MD 21218, USA
5 - Service d'Aéronomie du CNRS, 91371 Verrières-le-Buisson, France
Received 12 March 2002 / Accepted 7 August 2002
Abstract
We present Far Ultraviolet Spectroscopic
Explorer (![]() )
satellite
measurements of the absorption
and emission characteristics of interstellar gas
associated with the Local Interstellar Chimney, which is
an extension of the rarefied
Local Bubble cavity that extends outward from the galactic disk
towards
the lower galactic halo. Far ultraviolet (FUV) diffuse background emission
has been detected in the high ionization line of
O VI (
)
satellite
measurements of the absorption
and emission characteristics of interstellar gas
associated with the Local Interstellar Chimney, which is
an extension of the rarefied
Local Bubble cavity that extends outward from the galactic disk
towards
the lower galactic halo. Far ultraviolet (FUV) diffuse background emission
has been detected in the high ionization line of
O VI (![]() 1032 Å) for two
lines-of-sight (
1032 Å) for two
lines-of-sight (
![]() ,
,
![]() )
and (
)
and (
![]() ,
,
![]() )
at emission
levels of
)
at emission
levels of
![]() photons cm-2 s-1 sr-1 (LU) and
photons cm-2 s-1 sr-1 (LU) and
![]() LU respectively.
These levels of O VI emission are very similar to
those found for four other
lines-of-sight sampled thus far by the
LU respectively.
These levels of O VI emission are very similar to
those found for four other
lines-of-sight sampled thus far by the ![]() satellite, implying
a fairly constant level of average O VI surface brightness emission
at high galactic latitudes of about 2700 LU with a standard
deviation of 450 LU.
satellite, implying
a fairly constant level of average O VI surface brightness emission
at high galactic latitudes of about 2700 LU with a standard
deviation of 450 LU.
These emission-line data are supplemented by FUV
interstellar absorption line measurements taken
towards the hot DA white dwarf
star, REJ 1032+532 (
![]() ,
,
![]() ), whose distance of 116 pc
places it within the Local Bubble region. No
high ionization interstellar O VI
), whose distance of 116 pc
places it within the Local Bubble region. No
high ionization interstellar O VI ![]() 1032 Å absorption
has been detected
1032 Å absorption
has been detected
![]() cm-2), which is consistent
with the non-detections of interstellar C IV and Si IV absorption
reported towards this star by Holberg et al. (#!holberg99a!#).
Taken together, our FUV absorption and emission data
may be explained by a scenario in which the O VI emission and
absorption lines
are
cm-2), which is consistent
with the non-detections of interstellar C IV and Si IV absorption
reported towards this star by Holberg et al. (#!holberg99a!#).
Taken together, our FUV absorption and emission data
may be explained by a scenario in which the O VI emission and
absorption lines
are ![]() formed at the
conductive interface of the neutral boundary to the Local Bubble.
For the presently sampled sight-lines we have found
no correlation between the OVI emission line intensity and the associated
0.25 keV soft X-ray background flux as measured in the R1 and R2 bands by
the
formed at the
conductive interface of the neutral boundary to the Local Bubble.
For the presently sampled sight-lines we have found
no correlation between the OVI emission line intensity and the associated
0.25 keV soft X-ray background flux as measured in the R1 and R2 bands by
the ![]() satellite. The OVI line intensities also show
no correlation with the soft X-ray background flux attributable
to emission from the million degree K gas of the Local Hot Bubble
as modeled by Kuntz & Snowden (#!kuntz00!#).
Any (new) model of the Local
Bubble must now be able to explain (i) the low levels of
variability in
both the O VI emission-line intensity
and the associated soft X-ray background flux for galactic sight-lines
>|40|
satellite. The OVI line intensities also show
no correlation with the soft X-ray background flux attributable
to emission from the million degree K gas of the Local Hot Bubble
as modeled by Kuntz & Snowden (#!kuntz00!#).
Any (new) model of the Local
Bubble must now be able to explain (i) the low levels of
variability in
both the O VI emission-line intensity
and the associated soft X-ray background flux for galactic sight-lines
>|40|![]() ,
(ii) the observed
pressure of
,
(ii) the observed
pressure of
![]() cm-3 K for
the local hot interstellar gas, and (iii) the paucity of high ionization
absorption lines observed within the local ISM and the sudden
increase in their measured column density
for distances beyond the Local Bubble neutral boundary.
cm-3 K for
the local hot interstellar gas, and (iii) the paucity of high ionization
absorption lines observed within the local ISM and the sudden
increase in their measured column density
for distances beyond the Local Bubble neutral boundary.
Key words: ISM: atoms - ISM: bubbles - Galaxy: solar neighbourhood
Although it has been over 40 years since the prediction
(and subsequent discovery) of a
hot (
![]() K) component to
the interstellar gas in our Galaxy (Spitzer 1956),
we still know very little about the distribution, state
or evolution of this hot plasma. Although several models
for the origin of this gas have been proposed, which include (i) the
cloud-evaporation model of
McKee-Ostriker (1977), (ii) the galactic fountain model
of Shapiro & Field (1976), and (iii) the supernova
bubble model of Cox & Smith (1974), we
note that no single model has
yet to be verified by current observations. This situation is
exacerbated further by the fact that most of the major plasma cooling theories
have also yet to be verified by observation, although we note that
this may change in the near future with the anticipated launch of the
NASA Cosmic Hot Interstellar Plasma Spectrometer (
K) component to
the interstellar gas in our Galaxy (Spitzer 1956),
we still know very little about the distribution, state
or evolution of this hot plasma. Although several models
for the origin of this gas have been proposed, which include (i) the
cloud-evaporation model of
McKee-Ostriker (1977), (ii) the galactic fountain model
of Shapiro & Field (1976), and (iii) the supernova
bubble model of Cox & Smith (1974), we
note that no single model has
yet to be verified by current observations. This situation is
exacerbated further by the fact that most of the major plasma cooling theories
have also yet to be verified by observation, although we note that
this may change in the near future with the anticipated launch of the
NASA Cosmic Hot Interstellar Plasma Spectrometer (![]() )
satellite
in mid-2002 (Dixon et al. 1998) and the Korean-NASA
)
satellite
in mid-2002 (Dixon et al. 1998) and the Korean-NASA
![]() satellite in 2003 (Edelstein et al. 2000).
satellite in 2003 (Edelstein et al. 2000).
Our most detailed knowledge of hot interstellar (IS) gas in the galactic
disk and halo has been deduced from far ultraviolet (FUV) absorption
spectra of highly ionized species such as the
doublet resonance lines of CIV (![]() 1550 Å),
SiIV (
1550 Å),
SiIV (![]() 1394 Å) and NV (
1394 Å) and NV (![]() 1238 Å). These ions
sample interstellar gas with temperatures
1238 Å). These ions
sample interstellar gas with temperatures ![]() 60 000 K-180 000 K and all
possess scale-heights in excess of z> 3 kpc (Savage et al. 1997). It is probable that these line-species
co-exist above the lower neutral halo (whose extent of
60 000 K-180 000 K and all
possess scale-heights in excess of z> 3 kpc (Savage et al. 1997). It is probable that these line-species
co-exist above the lower neutral halo (whose extent of ![]() 500 pc
is generally defined by a rarefied, warm neutral layer of
gas called the "Lockman Layer'', Lockman 1984)
in a region of hot gas possibly advected
from the galaxy by supernovae.
However at present
there is still no strong evidence to support any outflow of
hot, ionized gas through a galactic fountain effect, and instead,
halo observations of the C IV ion favor formation toward mostly negative
velocities (Savage et al. 1997).
Interestingly, the small value of N(C IV):N(O VI) found
recently for low z objects by Savage et al. (2000) is
best explained by a conductive heating model in which the high ions are
produced mainly
in isolated low halo SNRs with hot gas properties
similar to those of the ten million year old
Local Bubble (LB) interstellar cavity.
These conclusions have been supported by the recent observations
of O VI (
500 pc
is generally defined by a rarefied, warm neutral layer of
gas called the "Lockman Layer'', Lockman 1984)
in a region of hot gas possibly advected
from the galaxy by supernovae.
However at present
there is still no strong evidence to support any outflow of
hot, ionized gas through a galactic fountain effect, and instead,
halo observations of the C IV ion favor formation toward mostly negative
velocities (Savage et al. 1997).
Interestingly, the small value of N(C IV):N(O VI) found
recently for low z objects by Savage et al. (2000) is
best explained by a conductive heating model in which the high ions are
produced mainly
in isolated low halo SNRs with hot gas properties
similar to those of the ten million year old
Local Bubble (LB) interstellar cavity.
These conclusions have been supported by the recent observations
of O VI (![]() 1032, 1038 Å) diffuse emission recorded
in the high latitude sight-line towards (
1032, 1038 Å) diffuse emission recorded
in the high latitude sight-line towards (
![]() ,
,
![]() )
by Shelton (2002).
These data suggest that most of the O VI emission (which samples
gas with a temperature of
)
by Shelton (2002).
These data suggest that most of the O VI emission (which samples
gas with a temperature of ![]() 300 000 K)
originates in the thick galactic disk or lower halo,
and such gas may have
been heated long ago rather than in a
recent (SNR) shock event. We note, however, that the recent
300 000 K)
originates in the thick galactic disk or lower halo,
and such gas may have
been heated long ago rather than in a
recent (SNR) shock event. We note, however, that the recent
![]() survey of O VI
absorption in the galactic halo by Savage et al. (2001)
reveals that gas parcels containing O VI are moving both towards and away from
the plane with roughly equal frequency at velocities in
excess of |50| km s-1.
These new
survey of O VI
absorption in the galactic halo by Savage et al. (2001)
reveals that gas parcels containing O VI are moving both towards and away from
the plane with roughly equal frequency at velocities in
excess of |50| km s-1.
These new ![]() data
require a combination of models involving
the radiative cooling of hot gas in a galactic fountain flow and the turbulent
mixing of hot gases.
data
require a combination of models involving
the radiative cooling of hot gas in a galactic fountain flow and the turbulent
mixing of hot gases.
Although the distribution
of both high and low ionization UV absorption lines towards many
directions in the outer halo is well
documented (Savage et al. 1997),
conversely the region encompassing the high galactic disk and
the beginning of the low inner halo gas
(
z = 0.2 - 0.5 kpc) is far
less studied. Also, all
previous selections of halo lines-of-sight have been
made without prior knowledge of the intervening
absorption contribution from both the ionized and neutral components
of the LB
cavity.
Recently, Sfeir et al. (1999) have
completed a survey of NaI (neutral
gas) absorption for distances <300 pc of the Sun that has
revealed an absorption boundary
of cold and relatively dense,
![]() cm-2, neutral
gas surrounding the rarefied LB cavity with
radii of between 65 to 250 pc.
This interstellar cavity
of low neutral gas density (
cm-2, neutral
gas surrounding the rarefied LB cavity with
radii of between 65 to 250 pc.
This interstellar cavity
of low neutral gas density (
![]() cm-3) has
a well defined neutral boundary in the
galactic plane, but at high galactic latitudes the
LB appears to be partially open-ended in both hemispheres with no
well-defined dense absorption boundary
for z < 200 pc.
This extension of the
LB cavity as it begins to reach into the lower galactic halo has been
confirmed by maps of the local distribution of EUV
sources, such that
this finger-like interstellar feature
has been termed the
"Local Chimney'' (LC) (Welsh et al. 1999).
In the northern
galactic hemisphere the LC points in
the general direction of Ursa Major towards
(
cm-3) has
a well defined neutral boundary in the
galactic plane, but at high galactic latitudes the
LB appears to be partially open-ended in both hemispheres with no
well-defined dense absorption boundary
for z < 200 pc.
This extension of the
LB cavity as it begins to reach into the lower galactic halo has been
confirmed by maps of the local distribution of EUV
sources, such that
this finger-like interstellar feature
has been termed the
"Local Chimney'' (LC) (Welsh et al. 1999).
In the northern
galactic hemisphere the LC points in
the general direction of Ursa Major towards
(
![]() ,
,
![]() )
and has
a diameter of
)
and has
a diameter of ![]() 20
20![]() .
This area of the sky contains the
famous Lockman Hole line-of-sight,
which is a small 4 deg2 region
centered on (
.
This area of the sky contains the
famous Lockman Hole line-of-sight,
which is a small 4 deg2 region
centered on (
![]() ,
,
![]() )
with a low neutral HI column density of
)
with a low neutral HI column density of
![]() cm-2(Lockman et al. 1986).
This general area is also associated with a significant enhancement
of the 0.25 keV soft X-ray background (SXRB) intensity as
measured by the
cm-2(Lockman et al. 1986).
This general area is also associated with a significant enhancement
of the 0.25 keV soft X-ray background (SXRB) intensity as
measured by the ![]() satellite (Snowden et al. 1997).
This region has
been mapped in detail by Snowden et al. (1994), such that
the enhanced SXRB flux in this direction can
be attributed to an extragalactic
component to the total measured soft X-ray flux.
This
low neutral-density IS cavity, perhaps extending as
far as the lower
halo region iteself, clearly provides a unique opportunity to
sample local interstellar plasma over a long sight-line,
as well as searching for
any interaction between possible outflowing/inflowing LB gas
and the local inner halo.
satellite (Snowden et al. 1997).
This region has
been mapped in detail by Snowden et al. (1994), such that
the enhanced SXRB flux in this direction can
be attributed to an extragalactic
component to the total measured soft X-ray flux.
This
low neutral-density IS cavity, perhaps extending as
far as the lower
halo region iteself, clearly provides a unique opportunity to
sample local interstellar plasma over a long sight-line,
as well as searching for
any interaction between possible outflowing/inflowing LB gas
and the local inner halo.
In this Paper we present both
absorption and emission observations of interstellar
plasma within the Local Chimney extension of
the Local Bubble using the
NASA Far Ultraviolet
Spectroscopic Explorer (![]() )
satellite (Moos et al. 2000).
Far UV absorption observations of the interstellar gas towards
the hot white dwarf star REJ 1032+532 (d = 116 pc) are
presented, together with
supplementary
)
satellite (Moos et al. 2000).
Far UV absorption observations of the interstellar gas towards
the hot white dwarf star REJ 1032+532 (d = 116 pc) are
presented, together with
supplementary ![]() observations of emitting
gas from two very nearby regions within 5
observations of emitting
gas from two very nearby regions within 5![]() on the sky.
By combining the presently derived
characteristics of the absorbing and emitting gas
along this local sight-line with
4 other sets of
on the sky.
By combining the presently derived
characteristics of the absorbing and emitting gas
along this local sight-line with
4 other sets of ![]() O VI observations,
we are able to comment on the relation
between the emission from the O VI
O VI observations,
we are able to comment on the relation
between the emission from the O VI ![]() 1032 Å line and the
associated SXRB flux. These observations indicate
that the level of diffuse emission from the O VI
1032 Å line and the
associated SXRB flux. These observations indicate
that the level of diffuse emission from the O VI ![]() 1032 Å line
is constant over the high galactic regions thus far sampled.
1032 Å line
is constant over the high galactic regions thus far sampled.
Spectral data were recorded during
observations of three lines-of-sight along the Local
Chimney direction of the local interstellar medium
using the ![]() spectrograph (Sahnow et al. 2000).
These observations consisted of one FUV absorption spectrum
recorded towards the hot white dwarf
star REJ 1032+532 (Sp = DA,
Mv = 14.3,
spectrograph (Sahnow et al. 2000).
These observations consisted of one FUV absorption spectrum
recorded towards the hot white dwarf
star REJ 1032+532 (Sp = DA,
Mv = 14.3,
![]() ,
,
![]() ), and observations of the FUV background emission from two
nearby sight-lines.
), and observations of the FUV background emission from two
nearby sight-lines.
The absorption data taken
towards REJ 1032+532 were recorded
in four separate integrations (7450 s total),
with the spectral
photon data being recorded in the detector histogram mode.
Each of these data sets (which
consist of 8 different spectral channels covering the
![]() 912-1180 Å range) was individually processed using
version 1.8.7 of the
912-1180 Å range) was individually processed using
version 1.8.7 of the ![]() science data reduction (CALFUSE) pipeline,
which corrects for geometric image distortions, background
subtraction, image thermal drifts, detector deadtime, wavelength
and flux calibration
(Sahnow et al. 2000).
These spectral channel
data sets were subsequently co-added and averaged
using standard IDL data reduction routines. Inspection
of these averaged spectra revealed that data contained
in the LiF 1A, LiF 1B and SiC 2B detector segments were of superior S/N ratio,
and these have been used in the subsequent absorption line analysis (although
use was made of the other spectral channels as a confidence check on
all subsequent line detections).
The absorption spectra (shown in Fig. 1) were fairly well-exposed for
wavelengths >1000 Å with
typical S/N ratios of
science data reduction (CALFUSE) pipeline,
which corrects for geometric image distortions, background
subtraction, image thermal drifts, detector deadtime, wavelength
and flux calibration
(Sahnow et al. 2000).
These spectral channel
data sets were subsequently co-added and averaged
using standard IDL data reduction routines. Inspection
of these averaged spectra revealed that data contained
in the LiF 1A, LiF 1B and SiC 2B detector segments were of superior S/N ratio,
and these have been used in the subsequent absorption line analysis (although
use was made of the other spectral channels as a confidence check on
all subsequent line detections).
The absorption spectra (shown in Fig. 1) were fairly well-exposed for
wavelengths >1000 Å with
typical S/N ratios of ![]() 12, whereas
the spectra <1000 Å were of poor S/N ratio (<5).
The
12, whereas
the spectra <1000 Å were of poor S/N ratio (<5).
The ![]() instrument typically has an on-orbit
velocity resolution of
instrument typically has an on-orbit
velocity resolution of ![]() 13 km s-1, as determined
from the fitting of weak interstellar
absorption lines.
13 km s-1, as determined
from the fitting of weak interstellar
absorption lines.
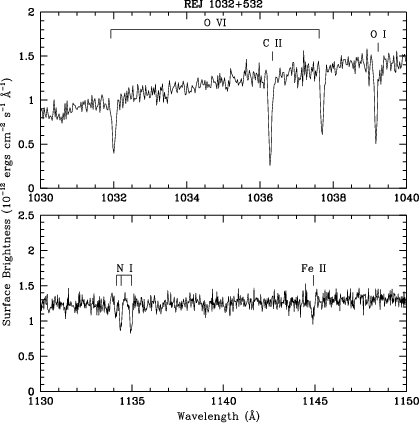 |
Figure 1:
Averaged |
| Open with DEXTER | |
The two observations of the far UV background
emission consisted of (i) a
38 600 s integration, split into
16 exposures, that recorded diffuse emission
from the galactic direction (
![]() ,
,
![]() )
- which we term sight-line "A'' - which is a position
some 20 arcsec away from the
hot white dwarf star REJ 1043+490 as listed
by Vennes et al. (1997),
and (ii) a 34 100 s
integration, split into 14 exposures, recording emission from
(
)
- which we term sight-line "A'' - which is a position
some 20 arcsec away from the
hot white dwarf star REJ 1043+490 as listed
by Vennes et al. (1997),
and (ii) a 34 100 s
integration, split into 14 exposures, recording emission from
(
![]() ,
,
![]() ), a position on
the sky
), a position on
the sky ![]() 18 arcsec away from the hot white dwarf
star REJ 1059+514 (which we term sight-line "B'').
All data were taken with the
18 arcsec away from the hot white dwarf
star REJ 1059+514 (which we term sight-line "B'').
All data were taken with the
![]() LWRS aperture of size
LWRS aperture of size
![]() .
.
Both sets of diffuse background emission data,
which were recorded in the time-tag detection mode,
were processed using the full data sets,
and also screened into night-only
data. This screening, as well as event-burst removal,
were performed using version 2.0.5 of the
CALFUSE data processing pipeline.
These data were further reduced to
an extracted spectrum as described by Dixon et al. (2001),
with the data being summed into 8 detector pixel bins (![]() 15 km s-1).
For sight-line "A'' we recorded 28.6 ksec of night-only data and
10.0 ksec of day-time data. For sight-line "B'', 24.9 ksec of
night-only and 9.2 ksec of day-time data were recorded.
For
sight-line "A'' it was found that the best resultant S/N spectra came
from using the co-added (and exposure-weighted) day-time + night-only
data (see Fig. 3). However, for sight-line "B'' we
present the night-only data, since addition of the day-time data
resulted in a narrow emission (noise?) feature close to
the O VI
15 km s-1).
For sight-line "A'' we recorded 28.6 ksec of night-only data and
10.0 ksec of day-time data. For sight-line "B'', 24.9 ksec of
night-only and 9.2 ksec of day-time data were recorded.
For
sight-line "A'' it was found that the best resultant S/N spectra came
from using the co-added (and exposure-weighted) day-time + night-only
data (see Fig. 3). However, for sight-line "B'' we
present the night-only data, since addition of the day-time data
resulted in a narrow emission (noise?) feature close to
the O VI ![]() 1032 Å line that significantly reduced the resultant
S/N of the spectrum.
A small number of off-axis photons associated with the
FUV continuum flux from the angularly
close white dwarf star, REJ 1059+514, also appeared
on the detector, but these events were easily identifiable and did
not contaminate the photon flux associated with the
diffuse emission from sight-line "B''.
Wavelengths for the emission line spectra (over
the range
1032 Å line that significantly reduced the resultant
S/N of the spectrum.
A small number of off-axis photons associated with the
FUV continuum flux from the angularly
close white dwarf star, REJ 1059+514, also appeared
on the detector, but these events were easily identifiable and did
not contaminate the photon flux associated with the
diffuse emission from sight-line "B''.
Wavelengths for the emission line spectra (over
the range ![]() 1028-1040 Å) were derived from
interpolating between nearby telluric emission lines
of accurately known wavelengths. The spectral resolution of
the
1028-1040 Å) were derived from
interpolating between nearby telluric emission lines
of accurately known wavelengths. The spectral resolution of
the ![]() instrument for observations
of diffuse sources when used with
the LWRS aperture is
instrument for observations
of diffuse sources when used with
the LWRS aperture is ![]() 100 km s-1, and
the resulting absolute wavelength accuracy is typically
100 km s-1, and
the resulting absolute wavelength accuracy is typically ![]() 20 km s-1.
All velocities in this
paper are reported in the heliospheric frame of reference (for LSR velocities
add 4 km s-1).
20 km s-1.
All velocities in this
paper are reported in the heliospheric frame of reference (for LSR velocities
add 4 km s-1).
The entire FUV spectrum of REJ 1032+532 (![]() 912-1180 Å)
was searched
for the presence of interstellar absorption lines.
We were guided
in this search in two ways: (i) by
reference to the list of FUV interstellar lines detected
towards 4 white dwarfs in the local ISM by Jenkins et al. (2000),
and (ii) by measurement of the relative wavelength shift between the
observed
912-1180 Å)
was searched
for the presence of interstellar absorption lines.
We were guided
in this search in two ways: (i) by
reference to the list of FUV interstellar lines detected
towards 4 white dwarfs in the local ISM by Jenkins et al. (2000),
and (ii) by measurement of the relative wavelength shift between the
observed ![]() line wavelength and the
vacuum wavelengths of atomic lines.
It was found that absorption
feature detections fell into two groups, (a) those with wavelength shifts
of
line wavelength and the
vacuum wavelengths of atomic lines.
It was found that absorption
feature detections fell into two groups, (a) those with wavelength shifts
of ![]() +0.42 Å, and (b) those with
shifts of
+0.42 Å, and (b) those with
shifts of ![]() +0.26 Å. The former set
of lines were recognized as being stellar in origin (see the discussion
of the O VI line later in this section), and the latter set were
identified with an interstellar origin.
Detections were only deemed valid if a line
was present in more than one of the
+0.26 Å. The former set
of lines were recognized as being stellar in origin (see the discussion
of the O VI line later in this section), and the latter set were
identified with an interstellar origin.
Detections were only deemed valid if a line
was present in more than one of the ![]() spectral channels, and
these interstellar lines are listed in Table 1.
In Fig. 1 we show two wavelength regions of the FUV absorption
spectrum of REJ 1032+532 that show the majority of the interstellar
lines detected in this line-of-sight.
spectral channels, and
these interstellar lines are listed in Table 1.
In Fig. 1 we show two wavelength regions of the FUV absorption
spectrum of REJ 1032+532 that show the majority of the interstellar
lines detected in this line-of-sight.
| Line |
|
V | N | S/N | |
| (mÅ) | (km s-1) | (1012 at. cm-2) | |||
| C II |
|
10 | |||
| C III |
<20 | <0.85 | |||
| N I |
blended | +0.4 | N/A | N/A | N/A |
| N I |
|
11 | |||
| N I |
|
12 | |||
| N II |
|
5 | |||
| O I |
|
5 | |||
| O I |
|
13 | |||
| O VI |
<13 | <10 | |||
| Si II |
+ |
5 | |||
| Fe II |
|
8 |
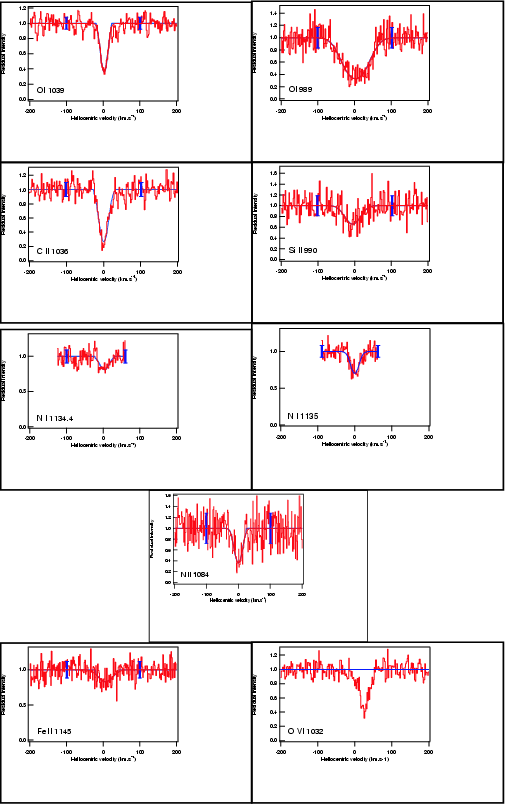 |
Figure 2:
Far ultraviolet interstellar absorption-line residual intensities and their best-fit profiles for REJ 1032+532. Solid bars indicate typical error sizes to the continuum level fits. Note that the O VI |
| Open with DEXTER | |
In Fig. 1 we note the detection of both O VI (![]() 1032, 1038 Å)
lines in absorption.
However, we reject these lines as being of interstellar origin for the
following 2 reasons. (i) The equivalent width
of the
1032, 1038 Å)
lines in absorption.
However, we reject these lines as being of interstellar origin for the
following 2 reasons. (i) The equivalent width
of the ![]() 1032 Å line is
1032 Å line is
![]() 69 mÅ (with a corresponding log N(O VI) = 13.7 cm-1), which
is an order of magnitude greater than
the marginal detection limits found for
this ion in a study of 11 lines-of-sight in the local
ISM by Oegerle et al. (2000). An interstellar O VI line
of this strength is more compatible with that found at distances
>1 kpc as determined from the
69 mÅ (with a corresponding log N(O VI) = 13.7 cm-1), which
is an order of magnitude greater than
the marginal detection limits found for
this ion in a study of 11 lines-of-sight in the local
ISM by Oegerle et al. (2000). An interstellar O VI line
of this strength is more compatible with that found at distances
>1 kpc as determined from the ![]() survey of galactic O VI
by Savage et al. (2001). (ii) The observed
survey of galactic O VI
by Savage et al. (2001). (ii) The observed ![]() shift of both lines from their rest wavelength is consistent
with that of all the other stellar lines in this spectrum (see Fig. 2).
In particular,
the value of this wavelength shift is identical to that of the
strong C III stellar line sextuplet around
shift of both lines from their rest wavelength is consistent
with that of all the other stellar lines in this spectrum (see Fig. 2).
In particular,
the value of this wavelength shift is identical to that of the
strong C III stellar line sextuplet around ![]() 1175 Å,
whose photospheric
origin has been confirmed
by Holberg et al. (1999b). It was initially somewhat
surprising that a (relatively cool) 47 000 K DA white dwarf could produce
this anomalously high level of photospheric O VI absorption, but confirmation
of this stellar line in the FUV spectra of
several other (cool) white dwarfs has recently been
made by Oliveira et al. (2001).
1175 Å,
whose photospheric
origin has been confirmed
by Holberg et al. (1999b). It was initially somewhat
surprising that a (relatively cool) 47 000 K DA white dwarf could produce
this anomalously high level of photospheric O VI absorption, but confirmation
of this stellar line in the FUV spectra of
several other (cool) white dwarfs has recently been
made by Oliveira et al. (2001).
Finally we note that there is a (noise) feature in the blue wing of the
aforementioned O VI (![]() 1032 Å) line
close to the expected rest wavelength
of the O VI interstellar line (see Fig. 2). However, this absorption
feature is not observed
in the O VI
1032 Å) line
close to the expected rest wavelength
of the O VI interstellar line (see Fig. 2). However, this absorption
feature is not observed
in the O VI ![]() 1038 Å line and thus cannot be confirmed as
a real detection. However, its presence enables us to place
a firm upper limit of
1038 Å line and thus cannot be confirmed as
a real detection. However, its presence enables us to place
a firm upper limit of
![]() cm-2 for interstellar
O VI along this line-of-sight (see Table 1).
cm-2 for interstellar
O VI along this line-of-sight (see Table 1).
Although the resultant S/N of the spectra are low (due to
the relatively short exposure times),
weak emission line features near ![]() 1032 Å, which
we associate with O VI ion emission, can be clearly seen in the
night-time spectra of both "A'' and "B''
sight-lines.
Using methods similar to those presented in Dixon et al. (2001),
we have used IDL software routines to fit these
O VI emission profiles by convolving the
1032 Å, which
we associate with O VI ion emission, can be clearly seen in the
night-time spectra of both "A'' and "B''
sight-lines.
Using methods similar to those presented in Dixon et al. (2001),
we have used IDL software routines to fit these
O VI emission profiles by convolving the ![]() instrumental
function
(here estimated to be a
instrumental
function
(here estimated to be a ![]() 106 km s-1 "top-hat''
function) with a best-fit Gaussian
of 150 km s-1 FWHM for sight-line "A'' and of 210 km s-1 for
sight-line "B''. The emission flux determined for the
O VI (
106 km s-1 "top-hat''
function) with a best-fit Gaussian
of 150 km s-1 FWHM for sight-line "A'' and of 210 km s-1 for
sight-line "B''. The emission flux determined for the
O VI (![]() 1032 Å) line
is
1032 Å) line
is
![]() LU
(a line unit, LU, is photons cm-2 s-1 sr-1)
for sight-line "A'' and
LU
(a line unit, LU, is photons cm-2 s-1 sr-1)
for sight-line "A'' and
![]() LU for sight-line "B''.
We quote one-sigma formal errors in these fluxes such that
the two O VI lines have been detected with a significance level
of 3.4-
LU for sight-line "B''.
We quote one-sigma formal errors in these fluxes such that
the two O VI lines have been detected with a significance level
of 3.4-![]() for
sight-line "A'' and 3.1-
for
sight-line "A'' and 3.1-![]() for sight-line "B''.
We have measured the central velocity for both of the OVI emission
lines to be
for sight-line "B''.
We have measured the central velocity for both of the OVI emission
lines to be
![]() km s-1
and
km s-1
and
![]() km s-1 for sight-lines
"A'' and "B'' respectively (add 4 km s-1 to
obtain the equivalent LSR velocities).
We note that the
km s-1 for sight-lines
"A'' and "B'' respectively (add 4 km s-1 to
obtain the equivalent LSR velocities).
We note that the ![]() instrument is not ideally
suited for obtaining diffuse emission-line measurements and
the derived
wavelength scale accuracy is not well constrained. Given the magnitude of
our 1-
instrument is not ideally
suited for obtaining diffuse emission-line measurements and
the derived
wavelength scale accuracy is not well constrained. Given the magnitude of
our 1-![]() errors on the derived central velocity of the
OVI lines, our results
are consistent with both of the OVI emission lines being formed at
approximately the same, slightly
negative velocity when compared with the local standard of rest.
For comparison we note that
the bulk of neutral hydrogen in the Ursa Major region as
sampled by 21 cm radio observations is dominated
by two components
of FWHM 25 km s-1 near
errors on the derived central velocity of the
OVI lines, our results
are consistent with both of the OVI emission lines being formed at
approximately the same, slightly
negative velocity when compared with the local standard of rest.
For comparison we note that
the bulk of neutral hydrogen in the Ursa Major region as
sampled by 21 cm radio observations is dominated
by two components
of FWHM 25 km s-1 near
![]() and -55 km s-1 (Jahoda et al. 1990). Thus,
our
and -55 km s-1 (Jahoda et al. 1990). Thus,
our ![]() observations of the OVI emitting gas
are consistent with an overall
negative velocity flow in this general
galactic direction.
observations of the OVI emitting gas
are consistent with an overall
negative velocity flow in this general
galactic direction.
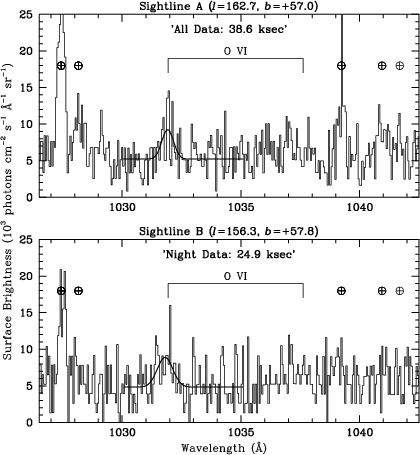 |
Figure 3:
Upper panel: far ultraviolet emission-line spectrum of the sight-line "A'' (
|
| Open with DEXTER | |
The O VI ![]() 1037.6 Å line is
intrinsically weaker than
1037.6 Å line is
intrinsically weaker than ![]() 1032 Å
and is made even more difficult to detect due to profile contamination
by the nearby CII
1032 Å
and is made even more difficult to detect due to profile contamination
by the nearby CII ![]() 1037 Å line.
However, we report a 3-
1037 Å line.
However, we report a 3-![]() upper
limit value for the O VI
upper
limit value for the O VI ![]() 1038 Å line in sight-line "A''
of <2100 LU, and <3000 LU for sight-line "B''. Similarly, we
have been able to determine a marginal (2.5-
1038 Å line in sight-line "A''
of <2100 LU, and <3000 LU for sight-line "B''. Similarly, we
have been able to determine a marginal (2.5-![]() )
detection for
the astrophysically interesting C III (
)
detection for
the astrophysically interesting C III (![]() 977 Å) emission line
of
977 Å) emission line
of
![]() LU for sight-line "A'' (based on the night-only data).
Such a value is
consistent with the only other (two)
LU for sight-line "A'' (based on the night-only data).
Such a value is
consistent with the only other (two) ![]() detections of this
line by by Dixon et al. (2001).
No meaningful upper limit can be
determined for the C III line in the very low S/N spectrum of
sight-line "B''.
detections of this
line by by Dixon et al. (2001).
No meaningful upper limit can be
determined for the C III line in the very low S/N spectrum of
sight-line "B''.
The DA white dwarf, REJ 1032+532, is located within an
extension of the
rarefied Local Bubble region that
reaches out from
the galactic disk towards the lower galactic halo (see Fig. 4).
A physical boundary to this neutral
gas-free interstellar chimney (if one exists) has yet to be accurately
determined, but EUV data suggest that low values of neutral HI column density
exist towards targets with a distance of at least ![]() 400 pc
in this direction (see Sect. 5.2).
Although the LB is widely believed to contain hot and highly
ionized interstellar gas, the detection of such gas in absorption
has remained elusive (Oegerle et al. 2000). Although
photoionization of the nearby (d < 5 pc) Local Interstellar Cloud (LIC)
can seemingly account for the low levels of
interstellar CIV and SiIV
observed towards the star
400 pc
in this direction (see Sect. 5.2).
Although the LB is widely believed to contain hot and highly
ionized interstellar gas, the detection of such gas in absorption
has remained elusive (Oegerle et al. 2000). Although
photoionization of the nearby (d < 5 pc) Local Interstellar Cloud (LIC)
can seemingly account for the low levels of
interstellar CIV and SiIV
observed towards the star
![]() CMa (Gry & Jenkins 2001; Slavin
& Frisch 2002), the failure
to detect significant amounts of interstellar Si IV, C IV and O VI absorption
towards all other lines-of-sight
CMa (Gry & Jenkins 2001; Slavin
& Frisch 2002), the failure
to detect significant amounts of interstellar Si IV, C IV and O VI absorption
towards all other lines-of-sight
![]() the LB region suggests that
the major local contribution from these high ions (which are all
routinely detected towards more distant sight-lines)
is most probably due to their formation at a conductive interface with the neutral boundary
of the LB. We also note that alternative theories that invoke a far
lower temperature for the LB gas due to
extreme non-equilibrium conditions have also been forwarded to
explain this apparent lack of high ion absorption detection (Breitschwerdt
& Schmutzler 1994).
the LB region suggests that
the major local contribution from these high ions (which are all
routinely detected towards more distant sight-lines)
is most probably due to their formation at a conductive interface with the neutral boundary
of the LB. We also note that alternative theories that invoke a far
lower temperature for the LB gas due to
extreme non-equilibrium conditions have also been forwarded to
explain this apparent lack of high ion absorption detection (Breitschwerdt
& Schmutzler 1994).
Our ![]() spectrum of REJ 1032+532 reveals only 8 detections
of interstellar absorption lines (see Table 1). The ionization
state of the interstellar plasma in which these far UV ions
are formed
is presently governed by the
detection of the NII
absorption line at
spectrum of REJ 1032+532 reveals only 8 detections
of interstellar absorption lines (see Table 1). The ionization
state of the interstellar plasma in which these far UV ions
are formed
is presently governed by the
detection of the NII
absorption line at ![]() 1084 Å (ionization potential 29.6 eV).
This ionization level provides a
natural explanation to the non-detection of the high ionization
interstellar CIV and SiIV absorption lines towards REJ 1032+532.
Holberg et al. proposed that the bulk of the observed neutral interstellar
gas absorption detected
towards REJ 1032+532 is formed in the local interstellar
cloud (LIC) within 5 pc of the Sun, such that
the remaining 100 pc line-of-sight to the white dwarf star
is of
extremely low neutral gas density.
Unfortunately, due to the modest spectral resolution
of the
1084 Å (ionization potential 29.6 eV).
This ionization level provides a
natural explanation to the non-detection of the high ionization
interstellar CIV and SiIV absorption lines towards REJ 1032+532.
Holberg et al. proposed that the bulk of the observed neutral interstellar
gas absorption detected
towards REJ 1032+532 is formed in the local interstellar
cloud (LIC) within 5 pc of the Sun, such that
the remaining 100 pc line-of-sight to the white dwarf star
is of
extremely low neutral gas density.
Unfortunately, due to the modest spectral resolution
of the ![]() spectrograph and the limited number
of IS lines presently detected,
the derived best-fit
doppler broadening parameters,
spectrograph and the limited number
of IS lines presently detected,
the derived best-fit
doppler broadening parameters, ![]() ,
listed in Table 1 do
not provide very meaningful limits to the temperature of
the absorbing interstellar gas in this direction.
Finally, we note Holberg's
anomalous detection of the (presumed) interstellar
SiIII line (
,
listed in Table 1 do
not provide very meaningful limits to the temperature of
the absorbing interstellar gas in this direction.
Finally, we note Holberg's
anomalous detection of the (presumed) interstellar
SiIII line (![]() 1206 Å)
with an ionization potential of 16.3 eV,
the possible origin of which we discuss later in Sect. 5.2.
1206 Å)
with an ionization potential of 16.3 eV,
the possible origin of which we discuss later in Sect. 5.2.
Holberg et al. (1999a) have determined a
total hydrogen column density,
![]() ,
for this
line-of-sight of
,
for this
line-of-sight of
![]() cm-2. They also
calculate that
cm-2. They also
calculate that
![]() ,
indicating
there are similar amounts of neutral and ionized
hydrogen gas in this sight-line. Such a relatively
low total hydrogen column density is typical for many other sight-lines within
the LB cavity (Frisch 1998).
Using this value of N(H) we can derive gas-phase abundances
for the elements of C, N, O, Si and Fe
relative to that of hydrogen using the total ion column densities
listed in Table 1 (assuming that those ions listed
are the dominant
state of these elements in the local ISM). We note that
although both the OI and NI ions are tightly coupled to HI gas by
charge exchange reactions, they can (and do) exist in
ionized HII regions (Sembach & Savage 1996).
For nitrogen we have detected lines from both NI and NII and
thus the true elemental abundance of N relative
to N(H) can be derived.
However, for oxygen only the OI absorption lines are available
and thus the derived abundance of O (which ignores the contribution from OII)
is only an approximation.
Ignoring the effects of ionization
of this ion can typically result in a
an error of
,
indicating
there are similar amounts of neutral and ionized
hydrogen gas in this sight-line. Such a relatively
low total hydrogen column density is typical for many other sight-lines within
the LB cavity (Frisch 1998).
Using this value of N(H) we can derive gas-phase abundances
for the elements of C, N, O, Si and Fe
relative to that of hydrogen using the total ion column densities
listed in Table 1 (assuming that those ions listed
are the dominant
state of these elements in the local ISM). We note that
although both the OI and NI ions are tightly coupled to HI gas by
charge exchange reactions, they can (and do) exist in
ionized HII regions (Sembach & Savage 1996).
For nitrogen we have detected lines from both NI and NII and
thus the true elemental abundance of N relative
to N(H) can be derived.
However, for oxygen only the OI absorption lines are available
and thus the derived abundance of O (which ignores the contribution from OII)
is only an approximation.
Ignoring the effects of ionization
of this ion can typically result in a
an error of ![]() 0.15 dex in the presently derived abundance of O.
0.15 dex in the presently derived abundance of O.
For the sight-line
towards REJ 1032+532 we find
![]() ,
,
![]() ,
,
![]() ,
,
![]() and
and
![]() for
these elements. Apart from our derived value of
for
these elements. Apart from our derived value of ![]() (C/H),
such element abundance values are within 0.2 dex of those
found by Holberg et al. (1999a) towards this
star, who also made abundance comparisons with a total value of N(H).
Our findings also support the corresponding pattern of elemental
depletion that characterizes interstellar
sight-lines through the LIC to other stars in the Local Bubble
(Vidal-Madjar et al. 1998; Jenkins et al. 2000). We note that our value of log (C/H) is 1.0 dex lower than
that found by Holberg et al.
and this difference may be due to line saturation effects of
the CII
(C/H),
such element abundance values are within 0.2 dex of those
found by Holberg et al. (1999a) towards this
star, who also made abundance comparisons with a total value of N(H).
Our findings also support the corresponding pattern of elemental
depletion that characterizes interstellar
sight-lines through the LIC to other stars in the Local Bubble
(Vidal-Madjar et al. 1998; Jenkins et al. 2000). We note that our value of log (C/H) is 1.0 dex lower than
that found by Holberg et al.
and this difference may be due to line saturation effects of
the CII ![]() 1334 Å line used by Holberg et al. in their
curve-of-growth column density derivation.
Recently Moos et al. (2002) have investigated the interstellar
abundances of OI/HI and NI/HI for lines-of-sight towards 7 white dwarf
stars within 180 pc of the Sun and found average relative abundances
of log (OI/HI) = -3.47 and log (NI/HI) = -4.41, both values being
1334 Å line used by Holberg et al. in their
curve-of-growth column density derivation.
Recently Moos et al. (2002) have investigated the interstellar
abundances of OI/HI and NI/HI for lines-of-sight towards 7 white dwarf
stars within 180 pc of the Sun and found average relative abundances
of log (OI/HI) = -3.47 and log (NI/HI) = -4.41, both values being
![]() 0.5 dex higher than our abundances derived for the REJ 1032+532
sight-line (which include
the contribution of HII gas). Moos et al. find that the variability of
the OI/NI ratio in
the local ISM is largely due to
the variation in the local intensity of ionizing radiation that
in turn affects the relative ionization balance of NI (i.e. a
significant fraction of N resides in the form of
NII, as confirmed by our present detection of the NII line).
In summary, our
0.5 dex higher than our abundances derived for the REJ 1032+532
sight-line (which include
the contribution of HII gas). Moos et al. find that the variability of
the OI/NI ratio in
the local ISM is largely due to
the variation in the local intensity of ionizing radiation that
in turn affects the relative ionization balance of NI (i.e. a
significant fraction of N resides in the form of
NII, as confirmed by our present detection of the NII line).
In summary, our ![]() observations of the
absorption profiles of gas in
the interstellar direction towards REJ 1032+532 support the findings of
Holberg et al. (1999a) in which the bulk of
absorption resides in a single interstellar cloud, presumed
to be the LIC, at a velocity of
observations of the
absorption profiles of gas in
the interstellar direction towards REJ 1032+532 support the findings of
Holberg et al. (1999a) in which the bulk of
absorption resides in a single interstellar cloud, presumed
to be the LIC, at a velocity of
![]() km s-1.
In addition, the FUV absorption profiles show
no evidence that REJ 1032+532 lies beyond a cold, dense neutral boundary
to the Local Bubble, in accord with the boundary contours
of the LC feature as defined
by Sfeir et al. (1999), and shown in Fig. 4.
Additionally, we find no signs of the confined, cool
(T < 500 K) layer of neutral gas that generally defines the
inner galactic halo in most other galactic directions,
nor have we detected signs of the warmer (
km s-1.
In addition, the FUV absorption profiles show
no evidence that REJ 1032+532 lies beyond a cold, dense neutral boundary
to the Local Bubble, in accord with the boundary contours
of the LC feature as defined
by Sfeir et al. (1999), and shown in Fig. 4.
Additionally, we find no signs of the confined, cool
(T < 500 K) layer of neutral gas that generally defines the
inner galactic halo in most other galactic directions,
nor have we detected signs of the warmer (
![]() K) more diffuse
gas of the Lockman Layer (Lockman 1984).
Thus, if all of the neutral interstellar absorption observed
towards REJ 1032+532 is associated with the LIC (i.e. within 10 pc)
then the remaining 100 pc of the interstellar medium between the LIC
and the white dwarf is an ionized region with
K) more diffuse
gas of the Lockman Layer (Lockman 1984).
Thus, if all of the neutral interstellar absorption observed
towards REJ 1032+532 is associated with the LIC (i.e. within 10 pc)
then the remaining 100 pc of the interstellar medium between the LIC
and the white dwarf is an ionized region with
![]() cm-2(Holberg et al. 1999a).
cm-2(Holberg et al. 1999a).
Both the "A'' and "B'' sight-lines sample emitting gas located in
an extension of the LB cavity that
extends towards the lower galactic halo.
To date there have been four other measurements of diffuse O VI
emission recorded by the ![]() satellite, all
taken towards lines-of-sight
with similarly
high galactic latitudes >|40|
satellite, all
taken towards lines-of-sight
with similarly
high galactic latitudes >|40|![]() (Shelton et al. 2001;
Dixon et al. 2001; Shelton 2002).
In Table 2 we summarize all relevent information concerning
these six
O VI emission observations by
(Shelton et al. 2001;
Dixon et al. 2001; Shelton 2002).
In Table 2 we summarize all relevent information concerning
these six
O VI emission observations by ![]() .
We also list estimates
of the
.
We also list estimates
of the ![]() line-of-sight
SXRB for the summed
R1 and R2 bands averaged over a radius of 0.4
line-of-sight
SXRB for the summed
R1 and R2 bands averaged over a radius of 0.4![]() (see the NASA HEASARC X-Ray Background Tool web-page
at http://heasarc.gsfc.nasa.gov/cgi-bin/Tools/xraybg/xraybg.pl,
which uses the data of Snowden et al. 1997).
(see the NASA HEASARC X-Ray Background Tool web-page
at http://heasarc.gsfc.nasa.gov/cgi-bin/Tools/xraybg/xraybg.pl,
which uses the data of Snowden et al. 1997).
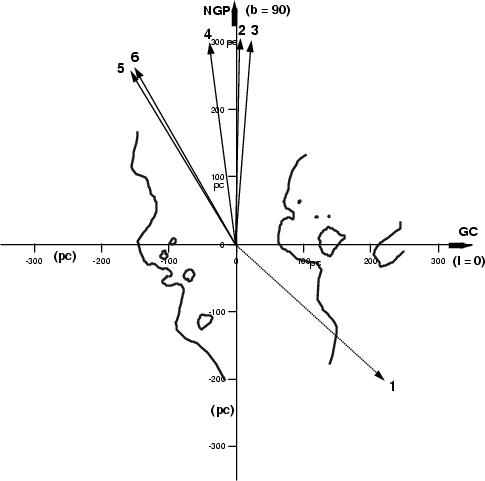 |
Figure 4:
Plot of the neutral gas boundary of the Local Bubble in the Meridian Plane with the 6 lines-of-sight in which O VI |
| Open with DEXTER | |
The directions of these, and the present "A'' and "B'' sight-lines, in relation to the
neutral boundary of the Local Bubble
are shown in Fig. 4.
This neutral boundary contour has been defined by an
interstellar line-of-sight NaI D2-line equivalent width >50 mÅ (Sfeir et al. 1999).
A NaI D2-line of this strength corresponds to
a neutral hydrogen column density >1020 cm-2,
which provides an optical depth of at least unity for a 0.25 keV soft X-ray
photon. Note that both "ends'' of the
high latitude extensions to the LB are, as yet, undefined by
the NaI observations (due to a dearth of suitable stellar targets).
Thus, at present we are unable to estimate
with great confidence if (and at what distance) these
sight-lines encounter a plausible neutral boundary to the LB. However,
a neutral boundary to the LB should exist in the northern hemisphere
direction (at some, as yet undetermined distance) since
values of the hydrogen column density, N(HI), derived from
21 cm observations along sight-lines "A'' and "B''
are both of a similar (high) value of
![]() cm-2 (Dickey & Lockman 1990).
Additionally, we note that in the galactic maps of the distribution of sources
detected by the
cm-2 (Dickey & Lockman 1990).
Additionally, we note that in the galactic maps of the distribution of sources
detected by the ![]() satellite, there is only one direction
at positive galactic latitudes in which sources (hot white dwarfs)
were detected to distances >150 pc (Welsh et al. 1999).
This direction covers a relatively small area of
7
satellite, there is only one direction
at positive galactic latitudes in which sources (hot white dwarfs)
were detected to distances >150 pc (Welsh et al. 1999).
This direction covers a relatively small area of
7![]() radius centered on (
radius centered on (
![]() ,
,
![]() )
and contains EUV detections of 3 white dwarfs
with distances (taken from
Vennes et al. 1997) of 230 pc (REJ 1043+490), 316 pc (REJ 1059+514)
and 404 pc (REJ 1043+449). Since the ability to detect EUV sources
is critically dependent on the line-of-sight neutral hydrogen
column density, we can confidently place a minimum
distance to the neutral boundary to the LB in this one particular direction at
)
and contains EUV detections of 3 white dwarfs
with distances (taken from
Vennes et al. 1997) of 230 pc (REJ 1043+490), 316 pc (REJ 1059+514)
and 404 pc (REJ 1043+449). Since the ability to detect EUV sources
is critically dependent on the line-of-sight neutral hydrogen
column density, we can confidently place a minimum
distance to the neutral boundary to the LB in this one particular direction at ![]() 400 pc.
Both of our "A'' and "B'' sight-lines are within
400 pc.
Both of our "A'' and "B'' sight-lines are within ![]() 5
5![]() of
this particular direction and they are similarly close to the 100 deg2field in Ursa Major that has the least neutral hydrogen
column density of any direction in the sky (Jahoda et al. 1990).
of
this particular direction and they are similarly close to the 100 deg2field in Ursa Major that has the least neutral hydrogen
column density of any direction in the sky (Jahoda et al. 1990).
| Direction (l, b) | O VI |
O VI Reference | LHB SXRB Flux* | |
| (photons cm-2 s-1 sr-1) | (10-6 counts s-1 arcmin-2) | (10-6 counts s-1 arcmin-2) | ||
| 1: (315.0 |
|
Shelton et al. (2001) | 930 | 450 |
| 2: (57.6 |
|
Dixon et al. (2001) | 4435 | 760 |
| 3: (284.2 |
|
Dixon et al. (2001) | 5530 | 385 |
| 4: (113.0 |
|
Shelton (2002) | 1000 | 500 |
| 5: (162.7 |
|
This Paper ("A'') | 1130 | 730 |
| 6: (156.3 |
|
This Paper ("B'') | 1140 | 870 |
| * = Derived from the Kuntz & Snowden (2000) model of the Local Hot Bubble. | ||||
It is immediately apparent from
the information listed in Table 2 that the intensity of diffuse
emission from the O VI ![]() 1032 Å line recorded by
the
1032 Å line recorded by
the ![]() instrument is remarkably similar for all six directions
thus far sampled. This implies a fairly constant
distribution of OVI surface brightness at
high galactic latitudes of about 2700 LU with a
standard deviation of 450 LU.
All of these sight-lines sample
emission from high galactic latitudes and thus it is still unknown
if the same levels of O VI surface brightness apply
in sight-lines that sample emission from only the galactic disk. Clearly
further
instrument is remarkably similar for all six directions
thus far sampled. This implies a fairly constant
distribution of OVI surface brightness at
high galactic latitudes of about 2700 LU with a
standard deviation of 450 LU.
All of these sight-lines sample
emission from high galactic latitudes and thus it is still unknown
if the same levels of O VI surface brightness apply
in sight-lines that sample emission from only the galactic disk. Clearly
further ![]() observations are required to resolve this point,
and to determine if a possible sight-line selection bias currently
exists for these six observations.
Absorption measurements of O VI towards
high latitude sight-lines show a relatively large variation (of
about an order of magnitude)
in the measured O VI column density values (Savage et al. 2000),
such that the majority of O VI absorption probably
originates in a (highly) variable
contribution from the hot halo gas. However, in
contrast, the relative low levels of
variability in the
presently determined
observations are required to resolve this point,
and to determine if a possible sight-line selection bias currently
exists for these six observations.
Absorption measurements of O VI towards
high latitude sight-lines show a relatively large variation (of
about an order of magnitude)
in the measured O VI column density values (Savage et al. 2000),
such that the majority of O VI absorption probably
originates in a (highly) variable
contribution from the hot halo gas. However, in
contrast, the relative low levels of
variability in the
presently determined ![]() O VI emission intensities would argue
for a more local origin in which there is little
contribution from halo O VI ions. Therefore,
bearing in mind the small number of sight-lines
thus far sampled, the present observations of constancy of
O VI emission
intensity would seem to favor its production at a local
interface, which we presently identify as the
(thin) neutral boundary zone to the Local Bubble.
Shelton et al. (2001) have
used the observed intensity of O VI emission
to a halo sight-line (which is of a very similar intensity value
to our present findings) to estimate the column
density, intrinsic intensity, electron density, thermal pressure and
depth of the emitting hot gas.
Their predicted O VI intensities are too large for the observed
emission to originate solely in the hot Local Bubble, and
they favor some additional O VI emission forming in the galactic thick disk
and/or lower halo region. Also, if all of the emission came from
just the LB then the
thermal pressure
of the O VI emitting gas would be
O VI emission intensities would argue
for a more local origin in which there is little
contribution from halo O VI ions. Therefore,
bearing in mind the small number of sight-lines
thus far sampled, the present observations of constancy of
O VI emission
intensity would seem to favor its production at a local
interface, which we presently identify as the
(thin) neutral boundary zone to the Local Bubble.
Shelton et al. (2001) have
used the observed intensity of O VI emission
to a halo sight-line (which is of a very similar intensity value
to our present findings) to estimate the column
density, intrinsic intensity, electron density, thermal pressure and
depth of the emitting hot gas.
Their predicted O VI intensities are too large for the observed
emission to originate solely in the hot Local Bubble, and
they favor some additional O VI emission forming in the galactic thick disk
and/or lower halo region. Also, if all of the emission came from
just the LB then the
thermal pressure
of the O VI emitting gas would be
![]() K cm-3, contrary
to the far lower observed pressure values
of
K cm-3, contrary
to the far lower observed pressure values
of ![]() 2200 K cm-3 for the LIC
(Lallement 1998) and
2200 K cm-3 for the LIC
(Lallement 1998) and
![]() 10 000 K cm-3 for the hot LB gas
found from the
emission measure of the SXRB emission
(Snowden et al. 1990).
Also the calculated emitting depth of the
O VI emission seems to be small (<1 pc), suggesting that the
O VI-bearing gas fills a small volume which is consistent with
it being formed at a conductive interface. We deem it
highly unlikeley that OVI could be formed by photoionization
processes in the LB since it would require a
stellar ionizing flux of at least 114 eV to form this ion.
10 000 K cm-3 for the hot LB gas
found from the
emission measure of the SXRB emission
(Snowden et al. 1990).
Also the calculated emitting depth of the
O VI emission seems to be small (<1 pc), suggesting that the
O VI-bearing gas fills a small volume which is consistent with
it being formed at a conductive interface. We deem it
highly unlikeley that OVI could be formed by photoionization
processes in the LB since it would require a
stellar ionizing flux of at least 114 eV to form this ion.
The total ![]() 0.25 keV SXRB R1 and R2 (R12) intensities
from the six sight-lines listed in Table 2
are very similar for 4 of the sight-lines (with
an average of
0.25 keV SXRB R1 and R2 (R12) intensities
from the six sight-lines listed in Table 2
are very similar for 4 of the sight-lines (with
an average of ![]()
![]() counts s-1 arcmin-2),
but are a factor
counts s-1 arcmin-2),
but are a factor ![]() 5 higher towards the two sight-lines
sampled by Dixon et al. (2001).
We note that these latter two sight-lines are very close to
the Coma and Virgo Clusters,
which accounts for both of their
anomalously high observed SXRB count-rates.
It has generally been assumed that the emission from the
million K degree
soft X-ray emitting plasma, whose distribution has
been demonstrated to be
anti-correlated with that of neutral HI gas,
should correlate with the O VI
emitting gas.
Although the results shown in Table 2 clearly show a constancy in
the emission levels of both O VI and the R12 SXRB flux (for
the 4 sight-lines), we
are unable at present to show that there is an
actual correlation between
these two fluxes.
Future
5 higher towards the two sight-lines
sampled by Dixon et al. (2001).
We note that these latter two sight-lines are very close to
the Coma and Virgo Clusters,
which accounts for both of their
anomalously high observed SXRB count-rates.
It has generally been assumed that the emission from the
million K degree
soft X-ray emitting plasma, whose distribution has
been demonstrated to be
anti-correlated with that of neutral HI gas,
should correlate with the O VI
emitting gas.
Although the results shown in Table 2 clearly show a constancy in
the emission levels of both O VI and the R12 SXRB flux (for
the 4 sight-lines), we
are unable at present to show that there is an
actual correlation between
these two fluxes.
Future ![]() O VI observations towards galactic
regions with associated anomalously high and very low SXRB fluxes would
perhaps resolve this point.
O VI observations towards galactic
regions with associated anomalously high and very low SXRB fluxes would
perhaps resolve this point.
In a recent re-analysis of the ![]() SXRB
survey data, Kuntz & Snowden (2000) have shown that
at least 3 sources are required to explain the observed distribution
of the 0.1-1 keV flux: (i) a hot LB contribution, (ii) an extragalactic
contribution and (iii) a galactic contribution that resides outside
of the galactic disk ISM.
Using their model we list the
estimated SXRB R12 count rates that can be
attributed solely to emission from the presumed million
degree K Local Hot
Bubble gas in the last
column of Table 2 (K. D. Kuntz, private communication).
We note that this local contribution to
the SXRB flux is variable and is
not correlated with the measured intensities of
the OVI emission lines. Parenthetically, we also
note that the OVI emission line intensity is
aslo uncorrelated with the remainder of the SXRB flux
that the Kuntz and Snowden model attribute to
emission sources residing beyond the galactic disk.
Finally, we suggest that
the local conductive interface at
the LB boundary that we favor to be responsible for the
similar levels of observed O VI emission surface brightness
may also be responsible for producing the observed levels of
local O VI absorption.
If the majority of local O VI absorption is
formed at a neutral LB interface, then this
could well explain the sudden increase
in the levels of O VI absorption measured towards targets with
distances in excess of the LB boundary. It would also explain
our present non-detection of O VI absorbing gas towards REJ 1032+532 and
also the similar non-detections by
SXRB
survey data, Kuntz & Snowden (2000) have shown that
at least 3 sources are required to explain the observed distribution
of the 0.1-1 keV flux: (i) a hot LB contribution, (ii) an extragalactic
contribution and (iii) a galactic contribution that resides outside
of the galactic disk ISM.
Using their model we list the
estimated SXRB R12 count rates that can be
attributed solely to emission from the presumed million
degree K Local Hot
Bubble gas in the last
column of Table 2 (K. D. Kuntz, private communication).
We note that this local contribution to
the SXRB flux is variable and is
not correlated with the measured intensities of
the OVI emission lines. Parenthetically, we also
note that the OVI emission line intensity is
aslo uncorrelated with the remainder of the SXRB flux
that the Kuntz and Snowden model attribute to
emission sources residing beyond the galactic disk.
Finally, we suggest that
the local conductive interface at
the LB boundary that we favor to be responsible for the
similar levels of observed O VI emission surface brightness
may also be responsible for producing the observed levels of
local O VI absorption.
If the majority of local O VI absorption is
formed at a neutral LB interface, then this
could well explain the sudden increase
in the levels of O VI absorption measured towards targets with
distances in excess of the LB boundary. It would also explain
our present non-detection of O VI absorbing gas towards REJ 1032+532 and
also the similar non-detections by
![]() towards other targets with distances
within the LB neutral boundary (Oegerle
et al. 2000).
towards other targets with distances
within the LB neutral boundary (Oegerle
et al. 2000).
Alternatively, a more radical explanation for
our present results could be that there is no hot million degree K
gas
![]() the LB cavity and the SXRB emission arises entirely
at the LB interface and beyond. In this extreme scenario the
LB gas would possess a temperature of only
the LB cavity and the SXRB emission arises entirely
at the LB interface and beyond. In this extreme scenario the
LB gas would possess a temperature of only ![]() 40 000 K, as
suggested by the
non-collisional ionization model
of Breitschwerdt & Schmuztler (1994). In such a model
a low pressure of
40 000 K, as
suggested by the
non-collisional ionization model
of Breitschwerdt & Schmuztler (1994). In such a model
a low pressure of
![]() cm-3 K for the
LB can be explained, as
can the observed upper
limits for the high ionization absorption
lines of C IV, N V and O VI for
nearby sight-lines (but only under the assumption
of an element depleted local interstellar gas).
However, more recent calculations by Brietschwerdt (2001)
predict very strong emission from the C III
cm-3 K for the
LB can be explained, as
can the observed upper
limits for the high ionization absorption
lines of C IV, N V and O VI for
nearby sight-lines (but only under the assumption
of an element depleted local interstellar gas).
However, more recent calculations by Brietschwerdt (2001)
predict very strong emission from the C III ![]() 977 Å line,
which is inconsistent (by
an order of magnitude) with the marginal detections of this line
found presently by us, as well as
by other authors towards the sight-lines listed
in Table 2.
We note that such a "warm'' gas LB
model could account for the
anomalously high levels of interstellar SiIII (
977 Å line,
which is inconsistent (by
an order of magnitude) with the marginal detections of this line
found presently by us, as well as
by other authors towards the sight-lines listed
in Table 2.
We note that such a "warm'' gas LB
model could account for the
anomalously high levels of interstellar SiIII (![]() 1206 Å)
observed towards
1206 Å)
observed towards ![]() CMa (Dupin & Gry 1998),
CMa (Dupin & Gry 1998),
![]() CMA (Gry & Jenkins 2001), REJ 1032+532
(Holberg et al. 1999a), and several other nearby
hot white dwarfs (Holberg et al. 1998).
However the interstellar origin of these anomalously strong SiIII lines
is still in some doubt, which has
led some authors to speculate that they could
be of stellar or circumstellar origin.
CMA (Gry & Jenkins 2001), REJ 1032+532
(Holberg et al. 1999a), and several other nearby
hot white dwarfs (Holberg et al. 1998).
However the interstellar origin of these anomalously strong SiIII lines
is still in some doubt, which has
led some authors to speculate that they could
be of stellar or circumstellar origin.
In conclusion, we note that any theory of a hot or warm gas LB cavity
must now also explain the presently identified constancy of ![]() O VI
and total SXRB emission intensities for the
lines-of-sight >|40|
O VI
and total SXRB emission intensities for the
lines-of-sight >|40|![]() thus far sampled by
thus far sampled by
![]() ,
in addition to explaining the low thermal
pressure values and the seeming absence of high ionization
absorption lines in the local interstellar medium.
,
in addition to explaining the low thermal
pressure values and the seeming absence of high ionization
absorption lines in the local interstellar medium.
We have detected only eight interstellar absorption lines
in the far UV spectrum (![]() 912-1180 Å) of the hot
white dwarf star
REJ 1032+532. No high ionization O VI
912-1180 Å) of the hot
white dwarf star
REJ 1032+532. No high ionization O VI ![]() 1032 Å
absorption has been detected (to an upper limit of
1032 Å
absorption has been detected (to an upper limit of
![]() cm-2), which is consistent with
the non-detections of other high ions such as CIV and SiIV
reported by Holberg et al. (1999a)
towards this star. The detection of interstellar NII
towards this white dwarf presently sets an upper limit of
29.6 eV to the ionization potential of gas in this sight-line.
Using absorption line-profile fitting techniques we
have derived best-fit ion column densities for all eight lines
and compared these with the total hydrogen column,
cm-2), which is consistent with
the non-detections of other high ions such as CIV and SiIV
reported by Holberg et al. (1999a)
towards this star. The detection of interstellar NII
towards this white dwarf presently sets an upper limit of
29.6 eV to the ionization potential of gas in this sight-line.
Using absorption line-profile fitting techniques we
have derived best-fit ion column densities for all eight lines
and compared these with the total hydrogen column,
![]() cm-2, measured towards this star. Abundances of C, N, O, Si and Fe
with respect to hydrogen have been derived, and all are consistent with
the elemental abundances found by several
authors for other sight-lines in the local ISM that pass through
the Local Interstellar Cloud (d < 5 pc). No evidence is found to
support REJ 1032+532 lying beyond the neutral
boundary to Local Bubble, or that it resides in a warm diffuse neutral
medium similar to the lower halo Lockman Layer.
cm-2, measured towards this star. Abundances of C, N, O, Si and Fe
with respect to hydrogen have been derived, and all are consistent with
the elemental abundances found by several
authors for other sight-lines in the local ISM that pass through
the Local Interstellar Cloud (d < 5 pc). No evidence is found to
support REJ 1032+532 lying beyond the neutral
boundary to Local Bubble, or that it resides in a warm diffuse neutral
medium similar to the lower halo Lockman Layer.
Far ultraviolet diffuse background emission has been detected
in the high ionization line of O VI ![]() 1032 Å for both
lines of sight observed. In the direction of
sight-line "A'' (
1032 Å for both
lines of sight observed. In the direction of
sight-line "A'' (
![]() ,
,
![]() )
we have detected an O VI
)
we have detected an O VI ![]() 1032 Å emission
line intensity of
1032 Å emission
line intensity of
![]() LU
and for sight-line "B'' (
LU
and for sight-line "B'' (
![]() ,
,
![]() )
we have recorded an intensity of
)
we have recorded an intensity of
![]() LU.
These two O VI line intensity levels
are remarkably similar
to the levels of emission found by other authors
for the other (four) directions sampled thus far by the
LU.
These two O VI line intensity levels
are remarkably similar
to the levels of emission found by other authors
for the other (four) directions sampled thus far by the ![]() satellite. The present average intensity of
O VI
satellite. The present average intensity of
O VI ![]() 1032 Å emission to all six sight-lines
is 2700 LU with a standard deviation of 450 LU.
The apparent similarity of O VI emission level intensity
may be understood if this ion is formed locally, at a conductive
interface with the neutral boundary to the Local Bubble region.
This may also be the site for the production of the
observed absorption due to the O VI ion, which has thus far
been detected by the
1032 Å emission to all six sight-lines
is 2700 LU with a standard deviation of 450 LU.
The apparent similarity of O VI emission level intensity
may be understood if this ion is formed locally, at a conductive
interface with the neutral boundary to the Local Bubble region.
This may also be the site for the production of the
observed absorption due to the O VI ion, which has thus far
been detected by the ![]() satellite only towards
targets with distances beyond the LB neutral boundary.
satellite only towards
targets with distances beyond the LB neutral boundary.
The observed 0.25 keV total SXRB R12 flux intensities from
four of these sight-lines are also similar
(![]()
![]() counts s-1 arcmin-2).
However, the soft X-ray
contribution from emission originating locally
in the million degree K gas of the Local Hot Bubble
(as modelled by Kuntz & Snowden 2000)
is highly variable and is uncorrelated with the
corresponding
counts s-1 arcmin-2).
However, the soft X-ray
contribution from emission originating locally
in the million degree K gas of the Local Hot Bubble
(as modelled by Kuntz & Snowden 2000)
is highly variable and is uncorrelated with the
corresponding ![]() OVI line intensities.
OVI line intensities.
A model of the hot gas in which all of the
observed O VI intensity originates in the Local Bubble
predicts a thermal pressure for the hot gas that is
several times larger than that estimated from the
SXRB observations.
Even though a low LB pressure and the observed anomalous levels of
SiIII absorption can be explained by a
"warm'' (
![]() K), non-collisionally
ionized gas, this model is rejected due to the observed
low levels of C III
K), non-collisionally
ionized gas, this model is rejected due to the observed
low levels of C III ![]() 977 Å emission, which is
contrary to the far higher levels predicted by the model of
Breitschwerdt (2001).
In summary, any new theory of hot
gas in the Local Bubble will
have to explain not only the observed low levels of thermal pressure,
but also the presently identified constancy in
the levels of both O VI
and total SXRB emission observed at galactic latitudes >|40|
977 Å emission, which is
contrary to the far higher levels predicted by the model of
Breitschwerdt (2001).
In summary, any new theory of hot
gas in the Local Bubble will
have to explain not only the observed low levels of thermal pressure,
but also the presently identified constancy in
the levels of both O VI
and total SXRB emission observed at galactic latitudes >|40|![]() .
.
Acknowledgements
This work is based on data obtained under the NASAGuest Investigator Program. The NASA-CNES-CSA