A&A 393, 843-854 (2002)
DOI: 10.1051/0004-6361:20021082
The far-ultraviolet emission of early-type galaxies
J.-M. Deharveng - A. Boselli - J. Donas
Laboratoire d'Astrophysique de Marseille,
Traverse du Siphon, Les Trois Lucs,
BP 8, 13376 Marseille Cedex 12, France
Received 20 March 2002 / Accepted 12 July 2002
Abstract
We have assembled a UV-flux selected sample of 82 early-type
galaxies and collected additional information at other wavelengths.
These data confirm a large spread of the UV-V color in the range
2 to 5. The spread in UV-V is
accompanied by a spread in B-V that is mainly attributed
to the range of morphological types and luminosities.
A large fraction of the objects have red colors,
 ,
corresponding to a weak UV-upturn as observed with IUE.
If the current interpretation for the UV emission from early-type
galaxies is applicable to our sample, the PAGB (Post-Asymptotic
Giant Branch) tracks are the most common evolution path for the
low-mass stars responsible for the UV emission. A small number of
very blue (
UV-V < 1.4) objects have been found that
can be reasonably interpreted as harbouring some low level of
star formation. In contrast to a previous sample
based on IUE observations, no correlation is found between the
UV-V color and the Mg2 spectral line index;
possible explanations are reviewed. The potential
of a more extended UV survey like GALEX is briefly presented.
,
corresponding to a weak UV-upturn as observed with IUE.
If the current interpretation for the UV emission from early-type
galaxies is applicable to our sample, the PAGB (Post-Asymptotic
Giant Branch) tracks are the most common evolution path for the
low-mass stars responsible for the UV emission. A small number of
very blue (
UV-V < 1.4) objects have been found that
can be reasonably interpreted as harbouring some low level of
star formation. In contrast to a previous sample
based on IUE observations, no correlation is found between the
UV-V color and the Mg2 spectral line index;
possible explanations are reviewed. The potential
of a more extended UV survey like GALEX is briefly presented.
Key words: stars: AGB and post-AGB - stars: horizontal-branch
- galaxies: stellar content - galaxies: elliptical and lenticular, cD - ultraviolet: galaxies
The UV emission discovered in early-type galaxies
as early as 1969 by the Orbiting Astronomical Observatory-2
(Code et al. 1972) is now currently interpreted
in terms of low-mass, helium-burning stars in extreme horizontal branch and
subsequent stages of evolution. O'Connell (1999) has
extensively reviewed the built-up of that interpretation
thanks to the combination of high quality UV data and new generations of
theoretical models for advanced
stellar evolution (e.g. Greggio & Renzini
1990, 1999 and references therein).
The former include spectra with the Hopkins Ultraviolet
Telescope (HUT) (e.g. Ferguson & Davidsen 1993;
Brown et al. 1995) and high angular
resolution images with HST (e.g. Brown et al. 1998,
2000). Notorious difficulties for converging on a well
accepted interpretation were the large variety of advanced stages of
stellar evolution and the sensitivity of UV production to small changes
of physical properties.
Because the most detailed observations are both time consuming and
intrinsically difficult, the current interpretation of the far-UV
radiation from early-type galaxies relies on a small number of
objects. In addition to the bulge of M 31, only 7 elliptical
galaxies were spectroscopically observed with HUT; it is not yet
possible to resolve UV-bright stars down to the horizontal branch
beyond M 31 (bulge) and its companions (Brown et al. 2000).
Studying a large sample of
early-type galaxies would therefore require the use of cruder approaches,
such as broad-band and integrated UV fluxes, but would
still be of interest.
It would help to understand the generality of the conclusions
reached and to distinguish the possibility and frequency
of low level of star formation in the population of
early-type galaxies. Although this latter phenomenon is now excluded
as a general explanation for the UV emission, it may well be present
in a number of objects and have implications on galaxy evolution.
A sample of 32 early-type galaxies was already studied by
Burstein et al. (1988) (hereafter BBBFL) and, albeit observed
spectroscopically with IUE, was mostly discussed in terms of their
(1550-V) color (see also Dorman et al. 1995).
With the availability of
several UV imaging surveys performed in the IUE-era
(Brosch 1999; O'Connell 1999), it is now possible
to study a larger sample of early-type galaxies
in the far-UV. Such a sample would have the advantage to
be essentially UV-flux selected and to potentially reveal UV emission
from unexpected early-type objects. This is a significant difference
with the BBBFL sample made of objects with substantial
record in the refereed literature and selected
for one-by-one spectroscopic investigation.
An additional motivation of our approach is to prepare ourselves to
the extended UV survey of GALEX (Martin et al. 1999) and what
should be learnt of the early-type galaxies.
The paper is organized as follows. Section 2 describes how our sample
of UV selected early-type galaxies has been built and
is complemented by a wealth of data at other wavelengths.
The UV-V color distribution and color-color diagram
are presented in Sects. 3 and 4. The analysis follows in Sect. 5.
We first take advantage of the fact that the BBBFL
sample contains most of the objects that have been studied in details
to emphasize a possible relationship between the UV color and the
categories of stars responsible for the UV radiation.
We then discuss the relative frequencies of these categories of
stars in the population of early-type galaxies, the possible
cases of recent star formation, the role of global
properties such as the luminosity,
the relation with the Mg2 spectral line index and
the UV light profiles in a few objects.
The sample analysed in this work is composed of all the optically selected
early-type galaxies (type  S0a) belonging to the Zwicky catalogue
(CGCG, Zwicky et al. 1961-1968) (
S0a) belonging to the Zwicky catalogue
(CGCG, Zwicky et al. 1961-1968) (
 )
detected in the UV by the FOCA experiment during the observations
of the Coma, A1367 and Cancer clusters (Donas et al. 1990, 1995,
private communication).
To these, we add all the early-type galaxies belonging to the Virgo Cluster
Catalogue (VCC; Binggeli et al. 1985) (
)
detected in the UV by the FOCA experiment during the observations
of the Coma, A1367 and Cancer clusters (Donas et al. 1990, 1995,
private communication).
To these, we add all the early-type galaxies belonging to the Virgo Cluster
Catalogue (VCC; Binggeli et al. 1985) (
 18) detected by
SCAP, FOCA and FAUST in the direction of Virgo (Donas et al. 1987,
private communication;
Deharveng et al. 1994). The sample is thus composed primarily of cluster
galaxies, even though some background or foreground objects are also included.
Galaxies whose UV detection is doubtful because of confusion with nearby objects,
(such as VCC 311), unless specified, have been systematically excluded.
The sample, largely dominated by objects observed with FOCA (85%),
is complete to a UV magnitude of about 18 whereas only 7 objects come from
the less deep images of SCAP and FAUST.
Two additional early-type galaxies identified by Brosch et al. (1997) in
their detailed study of FAUST images in the direction of the Virgo cluster have
not been included. In order to preserve homogeneity and UV-flux selection,
the sample was not extended with other sources of UV data
(UIT archives, O'Connell et al. 1992; Maoz et al. 1996;
Rifatto et al. 1995 and references therein).
18) detected by
SCAP, FOCA and FAUST in the direction of Virgo (Donas et al. 1987,
private communication;
Deharveng et al. 1994). The sample is thus composed primarily of cluster
galaxies, even though some background or foreground objects are also included.
Galaxies whose UV detection is doubtful because of confusion with nearby objects,
(such as VCC 311), unless specified, have been systematically excluded.
The sample, largely dominated by objects observed with FOCA (85%),
is complete to a UV magnitude of about 18 whereas only 7 objects come from
the less deep images of SCAP and FAUST.
Two additional early-type galaxies identified by Brosch et al. (1997) in
their detailed study of FAUST images in the direction of the Virgo cluster have
not been included. In order to preserve homogeneity and UV-flux selection,
the sample was not extended with other sources of UV data
(UIT archives, O'Connell et al. 1992; Maoz et al. 1996;
Rifatto et al. 1995 and references therein).
The final combined sample comprises 82 early-type
galaxies, including a few dwarf ellipticals and spheroidals.
The accuracy of the morphological classification is excellent for the
Virgo galaxies (Binggeli et al. 1985).
Because of the higher distance, the morphology of galaxies belonging
to the other surveyed regions suffers from an uncertainty
of about 1.5 Hubble type bins.
Most of the
UV data are total integrated magnitudes obtained at 2000 Å with
the FOCA experiment described by Milliard et al. (1991).
The FOCA UV magnitudes from Donas et al. (1990, 1995)
have been reprocessed adopting a new zero-point calibration and
a revised version of the data reduction pipeline
(Donas et al., private communication).
A comparison of the FOCA magnitudes with IUE data (stars and galaxies)
has revealed large fluctuations from object to object, with the FOCA
fluxes being on average 0.3 mag brighter. Because of this dispersion
and various possible explanations on a case by case basis,
we decided to stay on the FOCA calibration in order
to be consistent with previous works.
The comparison with IUE will again be addressed in the specific
context of the colors of the galaxies in Sect. 3.
The UV magnitudes at 1650 Å of the additional galaxies (6) from FAUST
have been transformed to 2000 Å using the relation
UV(2000 Å) = UV(1650 Å) + 0.2. This relation is intended to account for the
average spectral trend of ellipticals between 1650 Å and 2000 Å as well as
the comparison of FAUST magnitudes with other UV measurements (Deharveng et al.
1994).
The estimated error on the (FOCA) UV magnitude due to the flux extraction procedure
and to the linearisation of the photographic plates is
0.3 mag in general, but it ranges from 0.2 mag for bright galaxies to 0.5 mag for weak sources.
This, combined with the previously discussed uncertainty on
the zero point, gives errors on the UV magnitudes of  0.5 mag.
This uncertainty should be reminded when discussing color trends
in our sample; it is extremely large in comparison with the current range
of optical colors (as B-V) but should be seen in the context
of the much larger range of variation of the UV color.
A comparison of 4 galaxies measured with both FOCA and FAUST (for homogeneity
only the FOCA data have been retained in the sample) shows the FOCA fluxes
0.55 mag fainter than FAUST fluxes on average. This number suggests a
possible systematic effect but remains consistent with our
evaluation of the uncertainty of UV magnitudes.
0.5 mag.
This uncertainty should be reminded when discussing color trends
in our sample; it is extremely large in comparison with the current range
of optical colors (as B-V) but should be seen in the context
of the much larger range of variation of the UV color.
A comparison of 4 galaxies measured with both FOCA and FAUST (for homogeneity
only the FOCA data have been retained in the sample) shows the FOCA fluxes
0.55 mag fainter than FAUST fluxes on average. This number suggests a
possible systematic effect but remains consistent with our
evaluation of the uncertainty of UV magnitudes.
Optical data, available for 63 objects in the V, 72 in the B and 51 in the U band
are from Gavazzi & Boselli (1996) and Boselli et al. (private communication).
NIR data, from Nicmos3 observations, are taken from Boselli et al. (1997)
and Gavazzi et al. (2000a, 2001) (74 galaxies).
From these data we derive total (extrapolated to infinity)
magnitudes  determined as described in Gavazzi et al. (2000b)
with typical uncertainties of 10%. For a few objects we
derive the H luminosity
from K band measurements assuming an average H-K color of
0.25 mag (independent of type; see Gavazzi et al. 2000b) when the true H-Kcolor is not available.
The estimated error on the optical and near-IR magnitudes is 0.1 mag.
determined as described in Gavazzi et al. (2000b)
with typical uncertainties of 10%. For a few objects we
derive the H luminosity
from K band measurements assuming an average H-K color of
0.25 mag (independent of type; see Gavazzi et al. 2000b) when the true H-Kcolor is not available.
The estimated error on the optical and near-IR magnitudes is 0.1 mag.
The multifrequency data used in this work are listed in Table 1,
arranged as follow:
- Column 1: VCC designation, from Binggeli et al. (1985) for Virgo galaxies,
or CGCG (Zwicky et al. 1961-1968) for A1367, Coma and Cancer cluster galaxies.
- Column 2: UGC name.
- Column 3: NGC/IC name.
- Column 4: morphological type as given in the VCC for Virgo galaxies or
in Gavazzi & Boselli (1996) for the other objects.
- Column 5: photographic magnitude from the VCC for Virgo galaxies,
from the CGCG for the other objects.
- Columns 6 and 7: major and minor optical diameters. For VCC galaxies the
diameters are measured on the du Pont plates at the faintest detectable isophote.
For CGCG galaxies these are the major and minor optical diameters
(a25, b25) (in arcmin) derived as explained in Gavazzi & Boselli (1996).
- Column 8: distance, in Mpc. Distances to the various
substructures of Virgo are as given in Gavazzi et al. (1999a).
A distance of 91.3 and 96 Mpc is assumed
for galaxies in the A1367 and Coma clusters respectively.
For Cancer cluster galaxies and for background and foreground objects the distance is determined
from the redshift assuming
 .
.
- Column 9: cluster membership as defined in Gavazzi et al. (1999a) for Virgo
and in Gavazzi et al. (1999b) for A1367 and Coma. P is for pairs, G for groups,
BkgV for galaxies in the background of Virgo,
ForC for objects in the foreground of Coma.
- Columns 10 to 15: K, H, J, V, B and U magnitudes determined as in
Gavazzi & Boselli (1996),
corrected for galactic extinction according to Burstein & Heiles (1982).
S0a galaxies are corrected
for internal extinction as in Gavazzi & Boselli (1996).
- Column 16 and 17: UV (2000 Å) magnitude corrected for galactic extinction according
to Burstein & Heiles (1982) assuming
 (all the targets being high galactic
latitude objects,
(all the targets being high galactic
latitude objects,
 0.3 mag), and reference.
- Column 18: Mg2 data for the nuclear regions from Golev & Prugniel
(1998) and Jorgensen (1999). The index is defined as in Worthey
(1994).
- Column 19: logarithm of the H band luminosity, in solar units, determined from
the relation
 ,
where
is the total extrapolated
H magnitude
and D the distance (in Mpc).
,
where
is the total extrapolated
H magnitude
and D the distance (in Mpc).
- Column 20: the C31 index, defined as the ratio of the radii containing 75% to 25%
of the total H-band light of the galaxy.
- Column 21: comments to individual objects.
Table 1:
The sample galaxies: Virgo.
|
VCC |
UGC |
NGC/IC |
type |
|
a |
b |
Dist |
Cluster |
K mag |
H mag |
J mag |
V mag |
B mag |
U mag |
UV mag |
Ref. |
Mg2 |
log LH |
C31 |
Note |
|
(1) |
(2) |
(3) |
(4) |
(5) |
(6) |
(7) |
(8) |
(9) |
(10) |
(11) |
(12) |
(13) |
(14) |
(15) |
(16) |
(17) |
(18) |
(19) |
(20) |
(21) |
|
49 |
7203 |
4168 |
E |
12.21 |
1.76 |
1.40 |
32 |
M |
8.32 |
8.84 |
9.62 |
11.72 |
12.63 |
13.11 |
12.50 |
2 |
0.246 |
10.89 |
3.71 |
* |
| 288 |
- |
- |
dE |
17.70 |
0.52 |
0.31 |
17 |
N |
- |
- |
- |
- |
- |
- |
16.82 |
8 |
- |
- |
- |
|
| 355 |
7365 |
4262 |
S0 |
12.41 |
1.87 |
1.63 |
17 |
A |
8.37 |
8.59 |
9.33 |
11.62 |
12.56 |
13.10 |
14.93 |
8 |
0.294 |
10.38 |
5.72 |
|
| 389 |
- |
781 |
dS0 |
14.21 |
1.41 |
0.91 |
17 |
A |
- |
- |
- |
- |
- |
- |
16.85 |
8 |
- |
- |
- |
|
| 608 |
- |
4322 |
dE |
14.94 |
1.25 |
0.62 |
17 |
A |
11.80 |
11.70 |
12.62 |
14.52 |
15.24 |
15.46 |
16.89 |
8 |
- |
9.07 |
2.66 |
|
| 616 |
- |
4325 |
E |
14.40 |
1.55 |
0.97 |
102.8 |
BkgV |
- |
- |
- |
13.47 |
14.40 |
14.85 |
14.06 |
1 |
- |
- |
- |
|
| 715 |
- |
3274 |
S0 |
14.80 |
0.93 |
0.46 |
90.9 |
BkgV |
- |
- |
- |
- |
- |
- |
17.27 |
9 |
- |
- |
- |
|
| 731 |
7488 |
4365 |
E |
10.51 |
8.73 |
6.18 |
23 |
B |
6.50 |
6.78 |
7.48 |
9.66 |
10.64 |
11.25 |
13.75 |
1 |
0.312 |
11.42 |
6.00 |
* |
| 759 |
7493 |
4371 |
S0 |
11.80 |
5.10 |
2.48 |
17 |
A |
7.77 |
8.05 |
8.76 |
10.87 |
11.85 |
12.41 |
15.61 |
6 |
- |
10.62 |
3.93 |
|
| 763 |
7494 |
4374 |
E |
10.26 |
10.07 |
10.07 |
17 |
A |
6.43 |
6.69 |
7.43 |
9.16 |
10.16 |
10.76 |
13.71 |
6 |
0.287 |
11.16 |
4.70 |
* |
| 781 |
7500 |
3303 |
dS0 |
14.72 |
1.08 |
0.50 |
17 |
A |
12.11 |
- |
- |
14.34 |
15.03 |
- |
16.92 |
6 |
- |
8.94 |
3.04 |
* |
| 828 |
7517 |
4387 |
E |
12.84 |
1.84 |
0.83 |
17 |
A |
9.04 |
9.32 |
10.03 |
12.29 |
13.19 |
13.74 |
16.67 |
6 |
0.228 |
10.08 |
4.25 |
|
| 870 |
- |
3331 |
dS0 |
15.52 |
1.16 |
0.43 |
185.7 |
BkgV |
- |
- |
- |
- |
- |
- |
16.33 |
6 |
- |
- |
- |
|
| 881 |
7532 |
4406 |
E |
10.06 |
11.37 |
7.51 |
17 |
A |
6.04 |
6.27 |
6.98 |
8.95 |
9.94 |
10.51 |
14.11 |
6 |
0.290 |
11.38 |
7.06 |
* |
| 914 |
- |
- |
dE |
19.00 |
0.25 |
0.25 |
23 |
B |
- |
- |
- |
- |
- |
20.02 |
17.29 |
9 |
- |
- |
- |
|
| 944 |
7542 |
4417 |
S0 |
12.08 |
3.60 |
1.00 |
23 |
B |
8.21 |
8.42 |
9.20 |
11.13 |
12.03 |
12.52 |
15.58 |
9 |
- |
10.89 |
12.52 |
* |
| 951 |
7550 |
3358 |
dE/dS0 |
14.35 |
1.43 |
0.94 |
17 |
B |
- |
11.54 |
- |
13.94 |
14.58 |
- |
16.32 |
6 |
- |
9.18 |
3.25 |
|
| 1003 |
7568 |
4429 |
S0a |
11.15 |
8.12 |
3.52 |
17 |
A |
6.54 |
6.74 |
7.43 |
9.59 |
10.58 |
11.22 |
14.98 |
6 |
0.232 |
11.01 |
5.48 |
* |
| 1010 |
7569 |
4431 |
dS0 |
13.68 |
1.58 |
0.79 |
17 |
A |
10.53 |
10.74 |
11.35 |
13.23 |
14.05 |
14.59 |
16.91 |
6 |
0.153 |
9.57 |
2.86 |
|
| 1030 |
7575 |
4435 |
S0 |
11.84 |
2.92 |
2.48 |
17 |
A |
7.68 |
7.92 |
8.66 |
10.94 |
11.82 |
12.33 |
15.31 |
6 |
0.189 |
10.74 |
10.06 |
* |
| 1111 |
- |
- |
dE |
17.70 |
0.33 |
0.20 |
17 |
A |
- |
- |
- |
- |
- |
- |
15.73 |
6 |
- |
- |
- |
|
| 1125 |
7601 |
4452 |
S0 |
13.30 |
2.92 |
0.57 |
17 |
A |
9.04 |
9.31 |
10.10 |
11.91 |
12.87 |
13.41 |
16.23 |
6 |
- |
10.06 |
2.67 |
|
| 1146 |
7610 |
4458 |
E |
12.93 |
1.80 |
1.52 |
17 |
A |
9.38 |
9.69 |
10.32 |
12.32 |
13.18 |
13.64 |
16.74 |
6 |
0.208 |
10.06 |
7.99 |
|
| 1226 |
7629 |
4472 |
E |
9.31 |
10.25 |
8.11 |
17 |
S |
5.30 |
5.59 |
6.31 |
8.54 |
9.52 |
10.16 |
13.35 |
9 |
0.313 |
11.66 |
7.34 |
* |
| 1250 |
7637 |
4476 |
S0 |
12.91 |
1.89 |
0.94 |
17 |
A |
9.50 |
9.82 |
10.47 |
12.41 |
13.23 |
13.55 |
15.33 |
6 |
0.141 |
9.88 |
3.59 |
|
| 1279 |
7645 |
4478 |
E |
12.15 |
1.89 |
1.43 |
17 |
A |
8.24 |
8.52 |
9.17 |
11.45 |
12.36 |
12.77 |
15.47 |
6 |
0.233 |
10.35 |
3.37 |
|
| 1297 |
- |
- |
E |
14.33 |
0.51 |
0.45 |
17 |
A |
10.07 |
10.34 |
11.13 |
13.44 |
14.42 |
15.03 |
17.41 |
6 |
0.290 |
9.72 |
3.52 |
|
| 1316 |
7654 |
4486 |
E |
9.58 |
11.00 |
11.00 |
17 |
A |
5.92 |
6.19 |
7.01 |
8.82 |
9.82 |
10.37 |
12.70 |
6 |
0.270 |
11.34 |
4.20 |
* |
| 1327 |
7658 |
- |
E |
13.26 |
1.10 |
0.88 |
17 |
A |
9.07 |
9.23 |
9.75 |
11.49 |
12.13 |
12.27 |
14.49 |
6 |
- |
10.14 |
4.43 |
* |
| 1368 |
7665 |
4497 |
S0a |
13.12 |
2.01 |
0.85 |
17 |
A |
9.60 |
9.72 |
- |
12.18 |
13.05 |
13.46 |
17.22 |
6 |
- |
9.85 |
2.81 |
|
| 1499 |
- |
3492 |
E |
14.94 |
0.64 |
0.46 |
17 |
A |
- |
12.59 |
- |
14.77 |
15.26 |
- |
13.79 |
1 |
- |
8.79 |
2.74 |
* |
| 1535 |
7718 |
4526 |
S0 |
10.61 |
7.00 |
2.01 |
17 |
S |
6.37 |
6.65 |
7.47 |
9.83 |
10.80 |
11.36 |
14.04 |
1 |
0.272 |
11.19 |
10.59 |
|
| 1809 |
7825 |
3631 |
S0a |
14.17 |
1.10 |
0.67 |
37.3 |
BkgV |
- |
- |
- |
- |
- |
- |
10.70 |
1 |
- |
- |
- |
|
Table 2:
The sample galaxies: A1367, Cancer, Coma.
|
CGCG |
UGC |
NGC/IC |
type |
|
a |
b |
Dist |
Cluster |
K mag |
H mag |
J mag |
V mag |
B mag |
U mag |
UV mag |
Ref. |
Mg2 |
log LH |
C31 |
Note |
|
(1) |
(2) |
(3) |
(4) |
(5) |
(6) |
(7) |
(8) |
(9) |
(10) |
(11) |
(12) |
(13) |
(14) |
(15) |
(16) |
(17) |
(18) |
(19) |
(20) |
(21) |
|
97125 |
- |
- |
S0a |
15.60 |
0.84 |
0.59 |
91.3 |
A1367 |
- |
11.82 |
- |
14.67 |
15.55 |
15.82 |
16.05 |
3 |
- |
10.67 |
5.76 |
* |
| 97127 |
6723 |
3862 |
E |
14.00 |
1.62 |
1.58 |
91.3 |
A1367 |
9.75 |
10.00 |
10.72 |
12.90 |
13.86 |
14.43 |
16.32 |
5 |
0.282 |
11.32 |
5.88 |
* |
| 97134 |
6731 |
3867 |
S0 |
14.60 |
1.31 |
0.44 |
91.3 |
A1367 |
- |
10.36 |
- |
13.32 |
14.28 |
14.86 |
18.04 |
3 |
- |
11.45 |
4.02 |
|
| 98078 |
- |
- |
E |
15.20 |
0.40 |
0.30 |
91.2 |
P |
- |
12.35 |
- |
- |
- |
- |
13.25 |
1 |
- |
10.38 |
- |
* |
| 119030 |
- |
- |
E |
15.70 |
0.66 |
0.44 |
31.2 |
Cancer |
- |
13.07 |
- |
15.45 |
16.03 |
15.98 |
16.72 |
7 |
- |
9.03 |
3.65 |
* |
| 119053 |
- |
- |
S0a |
15.50 |
0.63 |
0.50 |
66.4 |
Cancer |
12.17 |
12.47 |
12.77 |
14.80 |
15.30 |
15.28 |
14.87 |
7 |
- |
10.12 |
8.67 |
* |
| 119065 |
4347 |
2563 |
E |
13.70 |
2.60 |
2.21 |
66.4 |
Cancer |
- |
9.46 |
- |
12.13 |
13.04 |
13.63 |
16.01 |
7 |
0.313 |
10.98 |
9.44 |
|
| 119086 |
- |
- |
E |
15.70 |
0.53 |
0.40 |
89.2 |
Cancer |
- |
13.47 |
- |
15.39 |
15.77 |
- |
15.07 |
7 |
- |
9.84 |
2.86 |
|
| 127032 |
6663 |
3821 |
S0 |
13.80 |
1.77 |
1.51 |
91.3 |
A1367 |
- |
10.56 |
- |
12.66 |
13.32 |
13.59 |
15.03 |
3 |
- |
11.11 |
5.45 |
* |
| 127045 |
6725 |
- |
S0a |
14.50 |
1.50 |
1.20 |
91.3 |
A1367 |
- |
11.15 |
- |
- |
- |
- |
16.18 |
5 |
- |
10.94 |
4.35 |
* |
| 127048 |
- |
- |
E |
15.00 |
0.50 |
0.50 |
93.4 |
G |
- |
11.20 |
- |
- |
- |
- |
16.49 |
5 |
- |
10.91 |
7.05 |
|
| 160014 |
- |
- |
E |
15.70 |
0.80 |
0.54 |
96 |
Coma |
- |
11.79 |
- |
- |
15.38 |
- |
16.56 |
5 |
- |
10.58 |
3.29 |
|
| 160021 |
8057 |
4816 |
S0 |
14.80 |
2.04 |
1.41 |
96 |
Coma |
9.89 |
10.06 |
10.87 |
12.77 |
13.74 |
14.18 |
16.89 |
4 |
0.304 |
11.32 |
8.21 |
|
| 160028 |
8065 |
4827 |
S0 |
14.10 |
1.50 |
1.16 |
96 |
Coma |
10.08 |
10.37 |
- |
13.16 |
14.10 |
- |
16.92 |
5 |
0.327 |
11.27 |
8.71 |
|
| 160038 |
8069 |
- |
S0a |
14.80 |
1.18 |
0.53 |
96 |
Coma |
- |
10.92 |
- |
13.57 |
14.35 |
15.03 |
17.56 |
5 |
- |
10.93 |
5.84 |
|
| 160039 |
8070 |
4839 |
E |
13.60 |
3.56 |
1.55 |
96 |
Coma |
9.60 |
9.85 |
10.58 |
12.15 |
13.15 |
13.71 |
16.27 |
5 |
0.312 |
11.53 |
10.20 |
* |
| 160042 |
- |
4840 |
E |
14.80 |
0.95 |
0.85 |
96 |
Coma |
10.56 |
10.84 |
11.58 |
13.78 |
14.73 |
15.32 |
17.45 |
4 |
0.323 |
11.08 |
8.73 |
|
| 160044 |
8072 |
4841 |
E |
13.50 |
1.59 |
1.55 |
96 |
Coma |
9.74 |
9.90 |
10.70 |
12.75 |
13.72 |
- |
16.82 |
4 |
0.317 |
11.45 |
8.72 |
* |
| 160059 |
- |
- |
E |
15.20 |
1.31 |
0.25 |
96 |
Coma |
- |
11.59 |
- |
- |
15.16 |
- |
17.85 |
5 |
- |
10.74 |
4.51 |
|
| 160063 |
- |
4850 |
S0 |
15.30 |
0.79 |
0.61 |
96 |
Coma |
11.24 |
11.54 |
12.34 |
14.29 |
15.22 |
15.81 |
16.90 |
4 |
0.287 |
10.75 |
3.82 |
|
| 160068 |
8092 |
4853 |
S0 |
14.20 |
1.00 |
0.78 |
96 |
Coma |
10.45 |
10.91 |
11.61 |
13.61 |
14.30 |
14.55 |
15.42 |
4 |
0.164 |
10.98 |
3.77 |
* |
| 160077 |
- |
3990 |
S0a |
15.00 |
1.22 |
0.49 |
96 |
Coma |
- |
10.61 |
- |
- |
14.37 |
- |
17.48 |
4 |
- |
11.05 |
7.55 |
|
| 160079 |
- |
- |
S0a |
15.10 |
0.98 |
0.38 |
96 |
Coma |
10.87 |
11.18 |
11.76 |
- |
14.56 |
- |
17.97 |
5 |
0.251 |
10.83 |
5.48 |
|
| 160100 |
- |
- |
E |
15.50 |
0.72 |
0.67 |
96 |
Coma |
11.51 |
11.84 |
12.55 |
14.73 |
15.65 |
- |
17.87 |
4 |
0.279 |
10.62 |
4.89 |
|
| 160101 |
- |
- |
S0a |
15.20 |
1.03 |
0.35 |
96 |
Coma |
10.95 |
11.24 |
11.88 |
- |
14.84 |
- |
17.90 |
4 |
0.286 |
10.79 |
6.15 |
|
| 160103 |
8142 |
4926 |
E |
14.10 |
1.31 |
0.99 |
96 |
Coma |
9.91 |
10.25 |
10.93 |
13.10 |
14.08 |
- |
17.29 |
4 |
0.315 |
11.28 |
8.11 |
|
| 160104 |
- |
- |
S0a |
15.40 |
0.67 |
0.28 |
96 |
Coma |
12.26 |
12.55 |
13.12 |
- |
15.26 |
- |
16.49 |
4 |
- |
10.28 |
3.95 |
* |
| 160105 |
- |
4927 |
S0 |
14.80 |
1.07 |
0.74 |
96 |
Coma |
10.35 |
10.69 |
11.50 |
13.72 |
14.73 |
- |
17.34 |
4 |
0.348 |
11.14 |
8.42 |
|
| 160107 |
- |
- |
S0a |
14.90 |
1.06 |
0.32 |
96 |
Coma |
- |
10.66 |
- |
13.50 |
14.51 |
15.78 |
17.39 |
5 |
- |
10.99 |
3.66 |
|
| 160109 |
- |
- |
S0 |
15.50 |
0.67 |
0.54 |
96 |
Coma |
11.29 |
11.48 |
12.36 |
- |
15.45 |
- |
17.42 |
4 |
- |
10.75 |
4.53 |
|
| 160118 |
8154 |
4931 |
S0 |
14.40 |
1.76 |
0.65 |
96 |
Coma |
10.22 |
10.45 |
11.15 |
13.35 |
14.22 |
- |
16.95 |
4 |
- |
11.22 |
8.81 |
|
| 160120 |
8160 |
4934 |
S0 |
15.00 |
1.33 |
0.36 |
96 |
Coma |
- |
11.58 |
- |
14.36 |
15.11 |
15.55 |
17.40 |
4 |
- |
10.76 |
3.89 |
|
| 160122 |
- |
- |
S0 |
15.60 |
0.71 |
0.53 |
96 |
Coma |
10.39 |
11.69 |
- |
- |
15.50 |
- |
17.45 |
4 |
- |
10.62 |
4.05 |
|
| 160124 |
8167 |
4944 |
S0 |
13.30 |
2.32 |
0.84 |
96 |
Coma |
10.15 |
10.31 |
11.05 |
12.87 |
13.78 |
14.12 |
16.53 |
4 |
- |
11.22 |
5.76 |
|
| 160125 |
- |
- |
S0 |
15.40 |
0.89 |
0.69 |
96 |
Coma |
- |
11.52 |
- |
- |
15.46 |
- |
17.75 |
5 |
- |
10.73 |
7.31 |
|
| 160129 |
8175 |
4952 |
E |
13.60 |
1.74 |
1.18 |
78.2 |
ForC |
- |
10.08 |
- |
12.94 |
13.79 |
- |
16.68 |
5 |
0.290 |
11.23 |
8.46 |
|
| 160140 |
- |
4971 |
S0 |
15.00 |
0.99 |
0.86 |
85.3 |
ForC |
10.80 |
10.96 |
- |
14.01 |
14.94 |
- |
17.32 |
5 |
0.284 |
10.94 |
9.25 |
|
| 160211 |
- |
3947 |
S0 |
15.60 |
0.58 |
0.51 |
96 |
Coma |
11.86 |
12.03 |
12.79 |
14.91 |
15.77 |
- |
17.38 |
4 |
0.282 |
10.56 |
4.14 |
|
| 160222 |
- |
4867 |
E |
15.50 |
0.64 |
0.43 |
96 |
Coma |
11.29 |
11.68 |
12.33 |
14.53 |
15.45 |
15.92 |
16.73 |
4 |
0.294 |
10.69 |
3.92 |
|
| 160228 |
- |
3973 |
S0 |
15.20 |
0.89 |
0.50 |
96 |
Coma |
11.02 |
11.34 |
12.17 |
14.30 |
15.28 |
15.81 |
18.12 |
5 |
0.318 |
10.80 |
7.40 |
|
| 160229 |
- |
4873 |
S0 |
15.40 |
0.57 |
0.49 |
96 |
Coma |
11.48 |
11.62 |
12.53 |
14.44 |
15.41 |
15.94 |
18.13 |
5 |
0.287 |
10.77 |
5.11 |
|
| 160231 |
8103 |
4874 |
E |
13.70 |
2.27 |
1.93 |
96 |
Coma |
8.91 |
9.22 |
10.02 |
12.02 |
12.97 |
13.55 |
16.50 |
4 |
0.310 |
11.81 |
5.19 |
* |
| 160234 |
- |
4876 |
E |
15.10 |
0.61 |
0.52 |
96 |
Coma |
11.30 |
11.57 |
12.37 |
14.52 |
15.47 |
16.03 |
18.36 |
5 |
0.260 |
10.71 |
4.11 |
|
| 160241 |
8110 |
4889 |
E |
13.00 |
3.30 |
2.23 |
96 |
Coma |
8.29 |
8.67 |
9.41 |
11.48 |
12.44 |
13.06 |
15.58 |
4 |
0.342 |
11.68 |
4.35 |
* |
| 160248 |
- |
4898 |
E |
14.70 |
0.85 |
0.62 |
96 |
Coma |
10.82 |
11.03 |
11.75 |
13.68 |
14.63 |
15.17 |
17.27 |
5 |
0.283 |
10.89 |
8.97 |
|
| 160249 |
8113 |
4895 |
S0 |
14.30 |
2.00 |
0.66 |
96 |
Coma |
10.27 |
10.53 |
11.31 |
13.19 |
14.12 |
14.64 |
16.74 |
4 |
0.301 |
11.28 |
12.39 |
* |
| 160256 |
- |
4045 |
E |
15.10 |
0.84 |
0.64 |
96 |
Coma |
10.98 |
11.27 |
11.94 |
14.01 |
14.99 |
15.48 |
17.97 |
5 |
0.299 |
10.82 |
3.60 |
|
| 160258 |
- |
4908 |
E |
14.90 |
0.92 |
0.68 |
96 |
Coma |
10.60 |
10.93 |
11.61 |
13.83 |
14.79 |
15.27 |
17.71 |
5 |
0.282 |
11.05 |
8.20 |
|
| 160259 |
8129 |
4051 |
E |
14.80 |
1.49 |
0.98 |
96 |
Coma |
10.36 |
10.78 |
11.51 |
13.46 |
14.40 |
14.96 |
17.10 |
4 |
0.331 |
11.07 |
4.48 |
|
| Comments to individual objects: |
| Virgo: |
| 49: low-luminosity dwarf Seyfert nucleus (Ho et al. 1994). |
731:
![${\rm H\alpha+[NII]}EW=2$](/articles/aa/full/2002/39/aa2498/img14.gif) Å (Kennicutt & Kent 1983). Å (Kennicutt & Kent 1983). |
763: Low Excitation Radio Galaxy (NED);
![${\rm H\alpha+[NII]}EW=1$](/articles/aa/full/2002/39/aa2498/img15.gif) Å
(Trinchieri & Di Serego Alighieri 1991);
also measured with FAUST (Deharveng et al. 1994). Å
(Trinchieri & Di Serego Alighieri 1991);
also measured with FAUST (Deharveng et al. 1994). |
| 781: interacting with NGC 4388? (Corbin et al. 1988).
881: M 86;
![${\rm H\alpha+[NII]}EW=13$](/articles/aa/full/2002/39/aa2498/img16.gif) Å (Trinchieri & Di Serego Alighieri 1991);
also measured with FAUST (Deharveng et al. 1994). Å (Trinchieri & Di Serego Alighieri 1991);
also measured with FAUST (Deharveng et al. 1994). |
| 944: classified "SB0: sp'' in NED. |
1003:
![${\rm H\alpha+[NII]}EW=5$](/articles/aa/full/2002/39/aa2498/img17.gif) Å (Boselli & Gavazzi 2002). Å (Boselli & Gavazzi 2002). |
| 1030: interacting with NGC 4438; LINER. |
| 1226: M 49;
Å (Kennicutt & Kent 1983);
also measured with FAUST (Deharveng et al. 1994). |
| 1316: M 87; radio galaxy;
Å (Boselli & Gavazzi 2002);
also measured with FAUST (Deharveng et al. 1994). |
| 1327: bright star superposed (Prugniel et al. 1987). |
| 1499: unresolved in UV from the nearby companion VCC 1491; given the extreme red color of
VCC 1491 and the blue color of VCC 1499
(Gavazzi et al. 2001), the UV source should be identified to VCC 1499 (instead of
VCC 1491 in Deharveng et al. 1994). VCC 1499 is as blue as a dwarf irregular and
has a spectrum with the characteristics of a post-starburst galaxy (PSB) (Gavazzi et al.
2001). |
| Coma/A1367/Cancer: |
97125:
![${\rm H\alpha+[NII]}EW=26$](/articles/aa/full/2002/39/aa2498/img18.gif) Å (Moss et al. 1998), Å (Moss et al. 1998),
![${\rm H\alpha+[NII]}EW=21$](/articles/aa/full/2002/39/aa2498/img19.gif) Å (Gavazzi et al. 1998). Å (Gavazzi et al. 1998). |
| 97127: Low Excitation Radio Galaxy (NED). |
98078: Mrk 758,
![${\rm H\alpha+[NII]}EW=82$](/articles/aa/full/2002/39/aa2498/img20.gif) Å (Gavazzi et al. 1998). Å (Gavazzi et al. 1998). |
| 119030: classified "spiral'' in NED. |
119053:
![${\rm H\alpha+[NII]}EW=42$](/articles/aa/full/2002/39/aa2498/img21.gif) Å (Kennicutt et al. 1984). Å (Kennicutt et al. 1984). |
| 127032: classified as (R)SAB(s)ab in NED. |
| 127045:
Å (Moss et al. 1998). |
| 160039: radio galaxy (NED). |
| 160044: binary system. |
| 160068: AGN (NED); Balmer absorption lines (Sparke et al. 1980);
PSB (Caldwell et al. 1993). |
| 160104: PSB (Caldwell et al. 1997). |
| 160231: cD galaxy. |
| 160241: cD galaxy. |
| 160249: classified as ``SA0 pec sp'' in NED.
References to the UV data:
1: FAUST data (Deharveng et al. 1994);
2: SCAP data (Donas et al. 1987);
3: Donas et al. (1990) (reprocessed data,
 mag, see text);
4: Donas et al. (1995) (reprocessed data, mag, see text);
4: Donas et al. (1995) (reprocessed data,
 mag, see text);
5-9: Donas et al. private communication (5, Coma-A1367), (6, Virgo center),
(7, Cancer), (8, Virgo M100), (9, Virgo M 49). mag, see text);
5-9: Donas et al. private communication (5, Coma-A1367), (6, Virgo center),
(7, Cancer), (8, Virgo M100), (9, Virgo M 49). |
The scatter of the early-type galaxies in the UV in comparison
with their behavior in the optical to near-infrared domain
was noted as
early as the first OAO-2 observations
(Code & Welch 1981).
This scatter was confirmed by subsequent
observations (e.g. Burstein et al. 1988),
and it was shown as well that
the scatter among UV colors of galaxies
with similar types was decreasing from
early to late types (Code & Welch 1982; Smith & Cornett
1982; Deharveng et al. 1994).
The distribution of the UV-V colors of 63 galaxies
of our sample are illustrated in Fig. 1
and compared with that of the (1550-V) colors
of BBBFL. The distributions are similar in several aspects:
a peak near a color of 4, a relatively sharp cut-off on the red side,
a more shallow decrease on the blue side (from color 4 to 2)
and a few "outliers'' on the very blue side (precise definition and
implications to be seen later on). In both cases the bulk of the
objects have colors in the range 2 to 5 or so.
For five objects in common (NGC 4374, NGC 4406, NGC 4472, NGC 4486, NGC 4889),
our UV-V colors are found 1.4 mag redder on average than those of BBBFL. Three
factors may account for this disturbingly large difference. First,
our (2000-V) colors
are less influenced than the (1550-V) colors by the UV-upturn phenomenon.
Second, our measurements are integrated whereas the IUE data are
for a 10

 20
region centered on the nucleus, and all objects (except M 32) are known
to become redder in UV-B at large radii (Ohl et al. 1998). Last but not least,
the UV flux is integrated in a smaller area than the V light
in the case of objects that are well resolved with FOCA; for 3 of the
five objects in common, this factor would reduce the UV-V color by about 0.7 mag.
For this reason and since the peak of our histogram (Fig. 1)
appears only slightly redder than the BBBFL distribution,
we remain confident that a large discrepancy in UV-V colors
is not the rule.
20
region centered on the nucleus, and all objects (except M 32) are known
to become redder in UV-B at large radii (Ohl et al. 1998). Last but not least,
the UV flux is integrated in a smaller area than the V light
in the case of objects that are well resolved with FOCA; for 3 of the
five objects in common, this factor would reduce the UV-V color by about 0.7 mag.
For this reason and since the peak of our histogram (Fig. 1)
appears only slightly redder than the BBBFL distribution,
we remain confident that a large discrepancy in UV-V colors
is not the rule.
It is important to note that the increase in the number of objects
from the blue to the peak at a color of 4 is opposite to
the trend expected from selection effects with
UV-flux limited samples. These effects decrease the
volume for finding red galaxies, hence their proportion
relative to blue galaxies. This very trend certainly plays a role
in the cutoff at color >4.
The scatter of the UV-V color can be studied as a function of the B-V color
in the color-color diagram of Fig. 2. The objects can be roughly separated in two
groups. A first group, forming a vertical plume with red B-V colors (>0.9),
is consistent with the idea that
the population of stars responsible for the UV emission
and whose changing proportions would explain the scatter in the UV-V color
are expected to make virtually undetectable contribution
at visible wavelengths (O'Connell 1999).
A second group is made of objects that get bluer in B-V and
UV-V.
In addition to star formation, many factors such as the
color-magnitude relation and the metallicity
have already been identified as responsible for
a scatter (or blueing) in the B-V color of elliptical galaxies.
In this presentation we have ignored
the fact that the UV-V and B-V colors are
not completely independent variables.
We have verified that the results are similar in
the UV-B vs. B-V diagram but we keep using
the UV-V color for comparison with the previous work of BBBFL.
In spite of the differences in the observing wavelength and the measurement
aperture, the BBBFL data have been plotted in Fig. 2 for comparison.
These data do not
populate the diagram in the same specific areas as our data (for instance
a significant number of objects with UV-V color as blue as 2 but red in B-V
are added) but follow the same trends. The B-V colors needed to display the
color-color diagram for the BBBFL
galaxies have been obtained from the
NASA Extragalactic Database.
They refer to the integrated light whereas the UV-V colors are for the IUE aperture,
which may be a problem in some cases.
These B-V colors have also been found to
be on average 0.02 mag bluer than the B-V colors used for our data points and
derived from Table 1; this may
explain a small horizontal offset between the two datasets in Fig. 2.
There was no attempt to merge the data into a larger and unique dataset, given
the differences described above and the UV-selected origin of our data.
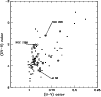 |
Figure 2:
UV-V vs. B-V color-color diagram for the galaxies of our
sample (solid square) and the BBBFL sample (open circles).
The 11 objects of the BBBFL sample which have been studied
in details with HUT or HST and are used as references are marked
as diagonal crosses. Great care should be taken when comparing the two samples
because of differences between the two datasets
(see text) and the fact that the B-V refers to the integrated light.
The specific issue of the B-V of NGC 205 is detailed in Sect. 5.4. |
| Open with DEXTER |
It is currently thought that HB stars and their progeny are responsible
for the far-UV emission in elliptical galaxies. The variety of
observed UV spectral energy distributions is explained by changing
proportions of stars along the zero-age HB (ZAHB) and
the following post-HB evolution tracks.
Three main classes of post-HB evolution are distinguished,
each evolving from a different range of effective temperature on the
ZAHB: from the red end of the HB, the stars evolve as post-AGB stars,
at hotter temperatures they follow post-early AGB evolution and
the bluest follow AGB-Manqué evolution
(e.g. Brown et al. 1998). The ZAHB location (hence the
specific evolutionary track)
is driven mainly by
the envelope mass: the lower this mass, the hotter is the ZAHB location.
The envelope mass itself depends critically on the mass
losses during the red giant phase.
The real populations involve a mixture of these different categories of
stars. On one hand, the PAGB-stars fail to produce enough UV because they
are UV-bright for a too short period of time; nonetheless they are bright enough
to be observed.
On the other hand, the bluest HB stars and their progeny,
if alone, would overproduce UV. The galaxies with stronger UV-upturn
and bluer UV color have therefore a larger fraction of their
populations evolving
along these latter paths and a smaller fraction of stars evolving
along the PAGB track.
Brown et al. (1997) have attempted to place numbers on these
fractions. It is generally admitted that
the strongest UV-upturn does not require more than about 15%
of the evolving population passing through the hot HB phase. At the opposite,
PAGB stars alone might account for the weakest UV-upturn. Nevertheless,
STIS observations (Brown et al. 2000) have shown that the
hot HB is populated in the case of the weak UV-upturn galaxy M 32.
The situation is further complicated by the fact that, even if
star formation is ruled out as a general interpretation
of the UV emission, it can still be present in a number of instances.
Features in the optical spectra of some early-type galaxies have been
interpreted as evidence for
a low-level of star formation activity (e.g. Caldwell et al. 1993);
NGC 205 and NGC 5102 are well known
examples of nearby early-type galaxies with direct evidence for massive
star formation (Hodge 1973; Pritchet 1979).
A number of authors
have developed spectral population synthesis models, based on the
different families of evolutionary tracks for low-mass stars
discussed above
(e.g. Dorman et al.
1995; Tantalo et al. 1996; Yi et al. 1997).
The UV output is found to be extremely sensitive to the parameters used,
chief among them the mass loss on the giant branch. Conversely,
infering something on the various categories of low-mass stars
responsible for the UV flux is difficult, if not impossible, from
observations as limited as a broad band measurement.
Until the physical processes driving the distribution of
stars along the ZAHB and the post-HB evolution are better understood
our interpretation of UV color will remain limited to analogies
that can be established
with a few objects used as references.
The BBBFL sample contains a significant number of known objects
for which a correspondance can be made between the
UV-V color and the more detailed information available.
They are NGC 1399 observed with HUT by Ferguson et al. (1991),
the 6 early-type galaxies observed with HUT by
Brown et al. (1995, 1997),
M 31 and M 32 observed with HUT (Ferguson & Davidsen 1993) and
the HST (Brown et al. 1998, 2000 and references therein).
NGC 205 and NGC 5102
have also been studied in details in the UV domain
(Bertola et al. 1995; Jones et al. 1996;
Cappellari et al. 1999; Deharveng et al. 1997).
All these 11 galaxies are identified
in the color-color diagram of Fig. 2.
For the moment, we concentrate on the spread in UV-V color, irrespectively
of the scatter in B-V, and defer discussion of
the bluest objects (
UV-V < 1.5)
close to NGC 205 (
UV-V = 1.19) and NGC 5102 (
UV-V = 0.8) to
the following subsection.
Most of the objects in Fig. 2 lie in the range of UV colors 2 - 4.5
defined by the two extreme objects, M 32 (
UV-V = 4.5) and
NGC 1399 (
UV-V = 2.05) in the small sample of reference ellipticals.
If the interpretation of NGC 1399 in terms of UV-bright stellar
content is correct and can be extrapolated to other objects with
the same UV-V color, this means that in our relatively large
sample we have not found
galaxies requiring a larger population of hot HB than
in NGC 1399, i.e. not more than say 15% of
the evolving population passing through the hot HB.
The precision in this number is of course limited by its extreme
sensitivity to the envelope mass and the interplay of other
parameters (Y, Z, ages).
At the opposite,
the objects as red as 4.5 in UV-V would be explained, if the case
of M 32 is representative,
essentially by PAGB evolution (although population passing
through the hot HB phase has been resolved
in M 32 by Brown et al. 2000). Of the 7 reddest objects,
with UV-V colors
from 4.5 up to 5.5, 3 are among those in common with the BBBFL sample and
reported with a disturbingly redder color than IUE data.
These objects are likely to be
affected by an integration of the UV flux in a smaller area than in the optical
band
and remind us of the uncertainties (including systematics) in the color-color
diagram. Although uncertain,
these extreme red UV colors
would remain compatible with the interpretation by PAGB evolution,
given the spread in envelope mass and the role of other parameters
(Y, Z and ages)
as illustrated by
the models of Tantalo et al. (1996),
Yi et al. (1997, 1998) and references therein.
An important feature of Fig. 2 is the large fraction of galaxies
with UV-V color in the bin  :
they make 29 of the 63
galaxies displayed in Fig. 2. They outnumber the objects in the
bin
:
they make 29 of the 63
galaxies displayed in Fig. 2. They outnumber the objects in the
bin
 by a factor 4,
or 36 when the difference of
volume surveyed (UV-flux limited sample) is roughly accounted for.
They are not found from the same cluster as the unusually red
early-type galaxies reported
by Marcum et al. (2001) in the Perseus cluster.
If our comparisons above are correct, this dominant number of galaxies
with weak UV-upturn would imply that the PAGB stars which are necessarily
present in elliptical galaxies are the main channel of
evolution for the low-mass, metal-rich population.
This large
fraction of red objects, implying relatively young ages
(e.g. Tantalo et al. 1996; Yi et al. 1998), is also consistent
with the age spreads that are now being reported for early-type
galaxies (e.g. Trager et al. 2000).
At the opposite, the scarcity of objects with UV-V in the range 2.5-3.2
suggests a sort of bimodality along the ZAHB or something special
with the group of six objects (including NGC 1399) reported with
a strong UV-upturn with IUE.
Further interpretation, either on the possibility of a minor contribution of
stars passing through the hot HB in the reddest galaxies,
or on the factors controling the distribution at hot temperatures
along the ZAHB, would require a larger number of
objects and a better photometry than that offered by the present data.
by a factor 4,
or 36 when the difference of
volume surveyed (UV-flux limited sample) is roughly accounted for.
They are not found from the same cluster as the unusually red
early-type galaxies reported
by Marcum et al. (2001) in the Perseus cluster.
If our comparisons above are correct, this dominant number of galaxies
with weak UV-upturn would imply that the PAGB stars which are necessarily
present in elliptical galaxies are the main channel of
evolution for the low-mass, metal-rich population.
This large
fraction of red objects, implying relatively young ages
(e.g. Tantalo et al. 1996; Yi et al. 1998), is also consistent
with the age spreads that are now being reported for early-type
galaxies (e.g. Trager et al. 2000).
At the opposite, the scarcity of objects with UV-V in the range 2.5-3.2
suggests a sort of bimodality along the ZAHB or something special
with the group of six objects (including NGC 1399) reported with
a strong UV-upturn with IUE.
Further interpretation, either on the possibility of a minor contribution of
stars passing through the hot HB in the reddest galaxies,
or on the factors controling the distribution at hot temperatures
along the ZAHB, would require a larger number of
objects and a better photometry than that offered by the present data.
Our sample contains seven objects
with UV color bluer than 1.4, comparable to those
of NGC 205 (
UV-V = 1.19) and NGC 5102 (
UV-V = 0.80).
By analogy it is tempting to say these seven objects
also harbour some residual star formation. While this conclusion seems
reasonable for the bluest of these objects, it is more arbitrary for the
others.
There is indeed no solid argument
to draw a line
between galaxies with and without residual star formation.
It is very possible that an UV color slightly bluer than 2.0
may be explained by a more extreme than usual
mixture of evolved low-mass stars and does not require any additional
younger population. Conversely, it is conceivable that a low
level of star formation can hide in a few objects
with relatively red UV colors.
We have examined individually the 7 objects with
UV-V < 1.4 and
suspected star formation. Hints of star formation are known
in three of them, CGCG 119053, CGCG 97125 and the bluest VCC 1499
(see notes to Table 1). VCC 49 (NGC 4168) has a
low-luminosity Seyfert nucleus and CGCG 119030 reminds us that
misclassification is also a possibility (see notes to Table 1).
The two last, VCC 616 and CGCG 119086, have so far nothing special.
This analysis reasonably confirms our assertion, based on
the comparison with NGC 205 and NGC 5102, that the objects blue in UV-V (say, <1.4) may have some residual star formation. It also
suggests that the UV light has the potential to sort out
new cases of residual star formation.
If we now pay more attention to the location of the
objects in the color-color diagram of Fig. 2,
three (VCC 616, VCC 49 and CGCG 97125) of the 7 objects with
UV-V<1.4 are puzzling
by their relatively red B-V whereas residual star formation is
expected to move the objects to the blue in both colors.
We have no explanations for this situation.
The location of NGC 205 also deserves attention:
its B-V refers to the
integrated light whereas the UV-V from BBBFL refers to the central region;
a B-V of the order of 0.65, as expected from the surface photometry
of Lee (1996), would be more appropriate for the comparison. This
would isolate further the three red (B-V) objects discussed above.
For the 19 galaxies in Table 1 without an UV-V color,
the
 color can be a useful approximation, especially
for sorting out blue objects as discussed in this subsection. Of the
five objects with
color can be a useful approximation, especially
for sorting out blue objects as discussed in this subsection. Of the
five objects with
 (VCC 1809, VCC 1111, CGCG 98078, VCC 914, VCC 288),
one again (CGCG 98078) is known to
have an extremely strong H
(VCC 1809, VCC 1111, CGCG 98078, VCC 914, VCC 288),
one again (CGCG 98078) is known to
have an extremely strong H emission (see notes to Table 1).
It is difficult to translate such signs of on-going star formation into
something more quantitative. For one, it is unknown whether the
residual star formation takes place in an elliptical with a weak
or a strong UV-upturn
as caused by low-mass evolved stars.
Second, the same UV color excess may result from different combinations
of burst strength, duration and ages.
The situation is illustrated for an instantaneous burst in Fig. 3
displaying the combinations of strength and age
that would
make the UV-V color of an host elliptical bluer than a given limit
(UV-V of 1.4 and 1 adopted in Fig. 3).
The time evolution of the spectral energy ditribution
from the burst has been calculated with
STARBURST 99 (Leitherer et al. 1999). A mass-to-visual light ratio
of

 is assumed
for the host elliptical (Charlot et al. 1996; Bressan et al.
1994),
allowing us to define the burst strength as a fraction of the mass of the
host and to calculate the composite color.
is assumed
for the host elliptical (Charlot et al. 1996; Bressan et al.
1994),
allowing us to define the burst strength as a fraction of the mass of the
host and to calculate the composite color.
 |
Figure 3:
The instantaneous bursts able to make an elliptical bluer than
a given UV-V color have their strengths and ages in the domain below
and to the right of the curves. Solid line: composite color <1.4,
host color =4; dashed line: same but host color =2; dotted line:
composite color <1, host color =4. Solar metallicity and
a Salpeter IMF (
 )
have been used in
STARBURST 99 calculations. )
have been used in
STARBURST 99 calculations. |
| Open with DEXTER |
If a constant star formation is assumed, it is also possible
with STARBURST 99 (Leitherer et al. 1999) to
calculate the rate which would make an host elliptical bluer
than a given UV-V limit; the result has, however, to be expressed
per unit V-band luminosity and becomes independent of duration for
period over 100 Myrs.
With the limit of
UV-V = 1.4 as in Fig. 3
we obtain
 yr
yr
 and
and
 yr
for an host with a UV-V color of 4 and 2 respectively. For an elliptical
with MV = -21, this translates into
rates of 0.2 and
yr
for an host with a UV-V color of 4 and 2 respectively. For an elliptical
with MV = -21, this translates into
rates of 0.2 and
 yr-1
respectively. Such numbers are comparable with
the rate of gas shed by stellar evolution in early-type galaxies
(e.g. Faber & Gallagher 1976). As noted by O'Connell
(1999), a complete recycling into new stars is therefore excluded
by UV observations as a regular phenomenon in early-type galaxies.
In contrast,
the few objects bluer than the limits adopted suggest special events
triggered by interaction and gas transfer.
Constraints on a partial gas recycling would require to appreciate
lower level of star formation, which is not yet permitted by the
scatter of UV colors and the present understanding of the UV emission
from HB stars and post-HB progeny.
yr-1
respectively. Such numbers are comparable with
the rate of gas shed by stellar evolution in early-type galaxies
(e.g. Faber & Gallagher 1976). As noted by O'Connell
(1999), a complete recycling into new stars is therefore excluded
by UV observations as a regular phenomenon in early-type galaxies.
In contrast,
the few objects bluer than the limits adopted suggest special events
triggered by interaction and gas transfer.
Constraints on a partial gas recycling would require to appreciate
lower level of star formation, which is not yet permitted by the
scatter of UV colors and the present understanding of the UV emission
from HB stars and post-HB progeny.
An important feature of Fig. 2 is the significant number of
objects that have relatively blue B-V color (say <0.85),
in contrast to the galaxies in the red vertical plume,
as exemplified by the 4 reference objects
(NGC 1399, NGC 4649, NGC 4552 and
NGC 4486) which have red
 (with
(with
 ).
).
We have first
examined whether a blueing in B-V may be explained by
the variety of evolution paths responsible for the scatter of the UV color.
We have not found any evidence for a blueing and a scatter of the B-V
color in the current stellar population models reproducing
the UV color (Bressan et al. 1994; Tantalo et al. 1996).
Residual star formation
is a possible explanation, especially since the correlation
between the UV-V and B-V extends into
the domain of the bluest UV-V galaxies that have been discussed
in terms of star formation in the previous subsection.
However, because the galaxies blue in B-V are not all very blue in UV-V,
it is also reasonable to consider other factors such as
the diversity of luminosity and morphological type.
An individual examination of extreme objects is instructive.
Of the seven objects with
B-V < 0.75 (and UV-V> 1.5),
three are dwarf ellipticals (VCC 608, VCC 781, VCC 951),
a category of objects known to have bluer B-V than
regular ellipticals (e.g. Ferguson 1994). Three are
S0 galaxies (CGCG 127032, CGCG 160068, CGCG 160120);
among them, CGCG 127032 (NGC 3821) is perhaps misclassified (see note
to Table 1) and
has a significant amount of neutral hydrogen (Eder et al. 1991),
CGCG 160068 (NGC 4853) has strong Balmer absorption lines
(see note to Table 1) and is the bluest in UV-V of all seven.
The last object (of the seven),
VCC 1327 (NGC 4486A), should be discarded because a bright star
is superimposed and probably contaminates the photometric measurements.
The potential role of the luminosity (and mass) has also been
explored in various color-magnitude diagrams built
with our sample. Figure 4 is an example of these diagrams with the H-band
luminosity. The main trend of variation shows
the blueing (and scatter) of the B-V color
with the low-luminosity objects,
among them the three Virgo dwarf ellipticals
discussed above. The branch leaving this main trend at log(LH) 11 and
 is caused by objects of the Coma
cluster with possible misclassification due to the distance and
signs of star formation as discussed above. Interestingly, this
branch is comparable to that
followed by spiral galaxies in a more general study of the
photometric and structural properties of
galaxies (Scodeggio et al. 2002).
is caused by objects of the Coma
cluster with possible misclassification due to the distance and
signs of star formation as discussed above. Interestingly, this
branch is comparable to that
followed by spiral galaxies in a more general study of the
photometric and structural properties of
galaxies (Scodeggio et al. 2002).
With an interpretation of the scatter in B-V more in terms
of luminosity effects than star formation (both are not exclusive),
it remains to understand
the apparent lack of galaxies blue in
B-V (<0.75 as above) and red in UV-V (say, 4).
This feature contributes to enhance the correlation
between the UV-V and B-V colors reported for a number
of objects in the color-color diagram.
There is probably
a selection effect in the sense that a galaxy
with UV-V = 4 and a B-V color implying an absolute
magnitude >-17 would fall below the UV detection
limit at the distance of Virgo.
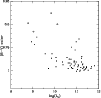 |
Figure 4:
B-V vs. H color-magnitude diagram for the galaxies of our
sample (VCC 1327 has been discarded). The objects with UV-V< 1.4 are plotted as open circles. |
| Open with DEXTER |
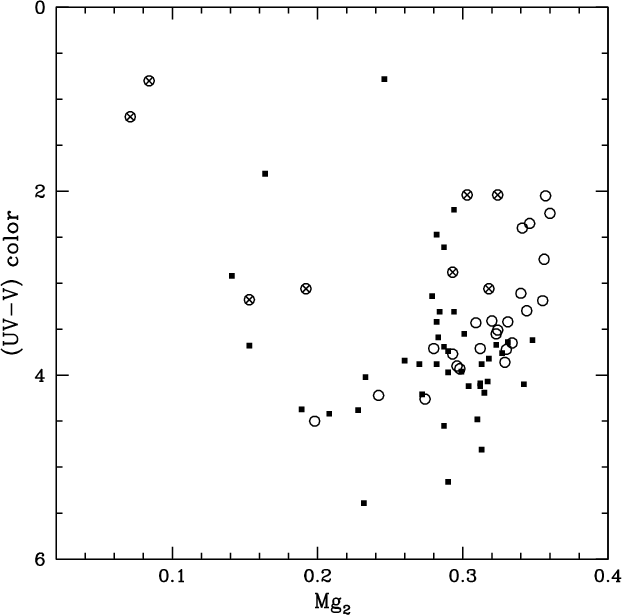
The correlation found between the UV color and the spectral line
index Mg2, with the color being bluer in more metal-rich galaxies
(Faber 1983, BBBFL), has
played a crucial role in establishing evolved
low-mass stars rather than massive stars as the main source of
UV emission in early-type systems. In contrast,
the 42 objects of our sample that have both an UV-V color and
a Mg2 index
do not show such a correlation (Fig. 5).
There are several possible explanations for this difference.
First, the Mg2 index obtained from the literature
refers to the central regions whereas our UV-V color refers to
the integrated light. This may account for some of the scatter
in Fig. 5 but not for the lack of correlation, as shown by the
amplitudes of aperture correction displayed by Golev & Prugniel
(1998).
Second, the Mg2-UV correlation of BBBFL is more apparent
(as in Dorman et al. 1995) after removing
galaxies with activity or on-going star formation.
In such domains of the plot,
we also have data points that might be removed on the same criteria.
Third and more important, Fig. 5 shows that our data do not contradict
the BBBFL correlation in terms of location in the plot
but are clumped within a narrower domain than the BBBFL data.
This feature, combined with the relatively large dispersion at a given
Mg2 index, is in agreement with
the idea (Dorman et al. 1995) that the correlation
may arise from distinct classes of galaxies
rather than from a continuum of properties. Most of our data
would belong to an intermediate group with modest dependence of UV colors
on Mg2.
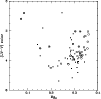 |
Figure 5:
The UV-V color as a function of the Mg2 spectral line index.
The sample of BBBFL is displayed for comparison (circles); their
correlation is enhanced when galaxies with activity or on-going
star formation (circles with diagonal crosses) are removed.
The objects redder than 4.5 are among those discussed in Sects. 3 and 5.3
and may have their colors affected by aperture mismatch. |
| Open with DEXTER |
At the interpretation level the lack of correlation is not so
embarrassing since the dominant factor for
the production of UV light is not the metallicity but the
distribution of envelope masses on the ZAHB, which is itself
determined by mass loss on the giant branch.
The explanation for the correlation
would be that mass-loss parameter increases with Z
(Dorman et al. 1995; O'Connell 1999).
In contrast, the current correlation of the B-V color with
metal abundance, driven by opacity effects in stellar atmospheres,
is equally clear in the two samples with the color getting redder
as the Mg2 index increases.
Four galaxies in our sample have a significant angular extent
that allowed us to derive a radial UV profile
and UV-B color profile,
according to procedures described by Gavazzi et al. (2000b).
The angular resolution of 20
in the UV images prevents
any conclusion to be reached within a radius of 20
,
a domain where
most of the galaxies are known to exhibit a plateau in UV-B color
(Ohl et al. 1998). Beyond that radius and up to 50
,
the UV-B color of M 87 displays a reddening of 0.7 mag comparable
to that reported by Ohl et al.
(1998) and then reaches a plateau up to
150
,
beyond the measurements with UIT (Ohl et al. 1998).
In all three other objects (NGC 4374, NGC 4406 and NGC 4429) the
angular extent is less and the external data points have low precision;
NGC 4374 and NGC 4406 at least do not seem to support a reddening
as reported by Ohl et al. (1998) in all their objects except M 32.
The future GALEX survey (e.g. Martin et al. 1999) will
considerably increase the number of flux measurements of galaxies
in the far-UV.
Adopting the counts of early-type systems of Marzke et al. (1998),
assuming a limiting UV magnitude of 18 and a
simplified mixture of ellipticals with two UV-V
colors (4 and 2, in proportion 4 to 1 as in the present paper),
we estimate that GALEX may detect about 4400 early-type
galaxies in 20 000 square degrees.
The sheer size of the
sample would allow us to explore the role of many parameters
in the UV properties
themselves. In combination with the uniformity of the UV-flux
selection, it should be possible to expand over the
two major issues addressed here, the relative proportion of
the different categories of evolved stars responsible for the UV emission
and the relative frequency of residual star formation activity.
From then and the measurement of the volume surveyed,
it should be possible to
estimate the volume density of star formation in early-type
galaxies. Such an evaluation
was not possible with our present sample because of the small number
of objects, which in addition were mostly cluster galaxies.
The GALEX survey will also provide
spectral information not available in the present sample,
in the form of two UV bands (and low-resolution spectra for some of the
objects). Models based on two UV bands and
developed by Dorman et al. (1995), Yi et al. (1997,
1998) will help to take advantage of this additional information.
We have assembled a sample of 82 early-type galaxies with a
flux measurement in the far-ultraviolet. In addition to more
than doubling the number of objects,
this sample has the advantage
to be essentially UV-flux selected.
The following has emerged from the analysis.
1) The large scatter of the UV-V color in comparison with the colors
in the optical is
confirmed. As shown with a small number of objects
studied previously in much detail, the color spread
between 2 and 5 might be explained by changing proportions
of stars along the ZAHB and the following post-HB evolutionary tracks.
2) The galaxies with red UV-V (4) colors (or weak UV upturn)
outnumber those with blue UV-V (2) colors (or strong UV upturn)
in our sample.
If the current interpretation of the UV-upturn
can be extended to our
sample, the PAGB tracks would be the most common
evolution path among elliptical galaxies.
Only a minority of elliptical galaxies would need a fraction of
their stars evolving from the blue part of the ZAHB.
The GALEX survey should considerably refine this finding, including
possible differences between the various categories of early-type
galaxies.
3) Few blue objects (
UV-V < 1.5) may harbour some residual star
formation as shown by the examples of NGC 205 and NGC 5102.
The implication in terms of the cosmic density of the star
formation rate in early-type galaxies should await
for a more extended survey like GALEX.
4) For a fraction of the objects, the scatter of the UV-V
color is accompanied by a
scatter in the B-V color. The latter should be caused by the
variety of morphological types and luminosities in the sample rather than
the evolutionary features explaining the
UV emission.
5) The correlation between the UV-V color and the Mg2 spectral
index is not found. This is in line with the idea that the UV flux is
not driven by the metallicity but by the mass loss along the giant branch
that determines the envelope mass on the horizontal branch.
Acknowledgements
We thank B. Milliard, M. Laget and M. Viton
for providing new sets of UV fluxes
of galaxies in advance of publication, G. Gavazzi for sharing with us
a large number of complementary photometric data,
and A. Donati for running for us his program on the radial light profiles.
The referee, R. O'Connell, is thanked for improvements to the text
and for pointing out interesting features in the data.
- Bertola, F., Bressan, A., Burstein, D., et al. 1995, ApJ, 438, 680
In the text
NASA ADS
- Binggeli, B., Sandage, A., & Tammann, G. 1985, AJ, 90, 1681 (VCC)
In the text
NASA ADS
- Boselli, A., Tuffs, R., Gavazzi, G., Hippelein, H.,
& Pierini, D. 1997, A&A, 121, 507
In the text
- Boselli, A., & Gavazzi, G. 2002, A&A, 386, 124
In the text
NASA ADS
- Bressan, A., Chiosi, C., & Fagotto, F. 1994, ApJS, 94, 63
In the text
NASA ADS
- Brosch, N., Formiggini, L., Almoznino, E., et al. 1997, ApJS, 111, 143
In the text
NASA ADS
- Brosch, N. 1999, Experimental Astron., 9, 119
In the text
NASA ADS
- Brown, T. M., Ferguson, H. C., & Davidsen, A. F.
1995, ApJ, 454, L15
In the text
NASA ADS
- Brown, T. M., Ferguson, H. C., Davidsen, A. F., &
Dorman, B. 1997, ApJ, 482, 685
In the text
NASA ADS
- Brown, T. M., Ferguson, H. C., Stanford, S. A., &
Deharveng, J.-M. 1998, ApJ, 504, 113
In the text
NASA ADS
- Brown, T. M., Bowers, C. W., Kimble, R. A., Sweigart, A. V., &
Ferguson, H. C. 2000, ApJ, 532, 308
In the text
NASA ADS
- Burstein, D., & Heiles, C. 1982, AJ, 87, 1165
In the text
NASA ADS
- Burstein, D., Bertola, F., Buson, L. M., Faber, S. M., &
Lauer, T. R. 1988, ApJ, 328, 440 (BBBFL)
In the text
NASA ADS
- Caldwell, N., Rose, J., Sharples, R. M., Ellis, R. S., &
Bower, R. G. 1993, AJ, 106, 473
In the text
NASA ADS
- Caldwell, N., & Rose, J. 1997, AJ, 113, 492
In the text
NASA ADS
- Cappellari, M., Bertola, F., Burstein, D., et al. 1999, ApJ, 515, L17
In the text
NASA ADS
- Charlot, S., Worthey, G., & Bressan, A. 1996,
ApJ, 457, 625
In the text
NASA ADS
- Code, A. D., Welch, G. A., & Page, T. 1972, in
The Scientific Results from the Orbiting Astronomical Observatory
(OAO-2), ed. A. D. Code (NASA SP-310), 559
In the text
- Code, A. D., & Welch, G. A. 1981, ApJ, 228, 95
In the text
- Code, A. D., & Welch, G. A. 1982, ApJ, 256, 1
In the text
NASA ADS
- Corbin, M. R., Baldwin, J. A., & Wilson, A. S. 1988, ApJ, 334, 584
In the text
NASA ADS
- Deharveng, J.-M., Sasseen, T., Buat, V., et al. 1994, A&A, 289, 175
In the text
- Deharveng, J.-M, Jedrzejewski, R., Crane, P., Disney, M.,
& Rocca-Volmerange, B. 1997, A&A, 326, 528
In the text
NASA ADS
- Donas, J., Deharveng, J.-M., Milliard, B., Laget, M.,
& Huguenin, D. 1987, A&A, 180, 12
In the text
NASA ADS
- Donas, J., Buat, V., Milliard, B., & Laget, M. 1990, A&A, 235, 60
In the text
NASA ADS
- Donas, J., Milliard, B., & Laget, M. 1995, A&A, 303, 661
In the text
NASA ADS
- Dorman, B., O'Connell, R. W., & Rood, R. T. 1995,
ApJ, 442, 105
In the text
NASA ADS
- Eder, J., Giovanelli, R., & Haynes, M. P. 1991,
AJ, 102, 572
In the text
NASA ADS
- Faber, S. M. 1983, in Highlights of Astronomy, 6, 165
In the text
NASA ADS
- Faber, S. M., & Gallagher, J. S. 1976, ApJ, 204, 365
In the text
NASA ADS
- Ferguson, H. C., Davidsen, A. F., Kriss, G. A.,
et al. 1991, ApJ, 382, L69
In the text
NASA ADS
- Ferguson, H. C., & Davidsen, A. F. 1993,
ApJ, 408, 92
In the text
NASA ADS
- Ferguson, H. C. 1994 In Dwarf Galaxies,
ESO/OHP Workshop, ed. G. Meylan, & P. Prugniel, 475
In the text
- Gavazzi, G., & Boselli, A. 1996,
Astro. Lett. Commun., 35, 1
In the text
NASA ADS
- Gavazzi, G., Catinella, B., Carrasco, L., Boselli, A.,
& Contursi, A. 1998, AJ, 115, 1745
In the text
NASA ADS
- Gavazzi, G., Boselli, A., Scodeggio, M., Pierini, D.,
& Belsole, E. 1999a, MNRAS, 304, 595
In the text
NASA ADS
- Gavazzi, G., Carrasco, L., & Galli, R. 1999b, A&AS, 136, 227
In the text
NASA ADS
- Gavazzi, G., Franzetti, P., Scodeggio, M., Boselli, A., &
Pierini, D. 2000a, A&AS, 142, 65
In the text
NASA ADS
- Gavazzi, G., Franzetti, P., Scodeggio, M., Boselli, A., &
Pierini, D. 2000b, A&A, 361, 863
In the text
NASA ADS
- Gavazzi, G., Zibetti, S., Boselli, A., et al. 2001, A&A, 372, 29
In the text
NASA ADS
- Golev, V., & Prugniel, P. 1998, A&AS, 132, 255
In the text
NASA ADS
- Greggio, L., & Renzini, A. 1990, ApJ, 364, 35
In the text
NASA ADS
- Greggio, L., & Renzini, A. 1999,
Mem. Soc. Astron. It., 70, 691
In the text
NASA ADS
- Ho, L. C., Filippenko, A. V., Sargent, W. L. W.,
& Peng, C. Y. 1997, ApJS, 112, 391
In the text
NASA ADS
- Hodge, P. W. 1973, ApJ, 182, 671
In the text
NASA ADS
- Jones, D. H., Mould, J. R., Watson, A. M.,
et al. 1996, ApJ, 466, 742
In the text
NASA ADS
- Jorgensen, I. 1999, MNRAS, 306, 607
In the text
NASA ADS
- Kennicutt, R., & Kent, S. 1983, AJ, 88, 1094
In the text
NASA ADS
- Kennicutt, R., Bothun, G. D., & Schommer, R. A. 1984,
AJ, 89, 1279
In the text
NASA ADS
- Lee, M. G. 1996, AJ, 112, 1438
In the text
NASA ADS
- Leitherer, C., Schaerer, D., Goldader, J. D.,
et al. 1999, ApJS, 123, 3
In the text
NASA ADS
- Maoz, D., Filippenko, A. V., Ho, L. C., et al. 1996, ApJS, 107, 215
In the text
NASA ADS
- Marcum, P. M., O'Connell, R. W., Fanelli, M. N., et al.
2001, ApJS, 132, 129
In the text
NASA ADS
- Martin, C. D., Bianchi, L., Donas, J.,
et al. 1999, In Ultraviolet-Optical Space
Astronomy Beyond HST, ed. J. A. Morse, J. M. Shull, & A. L.
Kinney, ASP Conf., 164, 182
In the text
- Marzke, R. O., Da Costa, L. N., Pellegrini, P. S.,
et al. 1998, ApJ, 503, 617
In the text
NASA ADS
- Milliard, B., Donas, J., & Laget, M. 1991,
Adv. Space Res., 11, 135
In the text
NASA ADS
- Moss, C., Whittle, M., & Pesce, J. 1998,
MNRAS, 300, 205
In the text
NASA ADS
- O'Connell, R. W., Bohlin, R. C., Collins, N. R.,
et al. 1992, ApJ, 395, L45
In the text
NASA ADS
- O'Connell, R. W. 1999, ARA&A, 37, 603
In the text
NASA ADS
- Ohl, R. G., O'Connell, R. W., Bohlin, R. C.,
et al. 1998, ApJ, 505, L11
In the text
NASA ADS
- Pritchet, C. 1979, ApJ, 231, 354
In the text
NASA ADS
- Prugniel, P., Nieto, J.-L., & Simien, F. 1987,
A&A, 173, 49
In the text
NASA ADS
- Rifatto, A., Longo, G., & Capaccioli, M. 1995, A&AS, 114, 527
In the text
NASA ADS
- Scodeggio, M., Gavazzi, G., Franzetti, P., et al. 2002, A&A, 384, 812
In the text
NASA ADS
- Smith, A. M., & Cornett, R. H. 1982, ApJ, 261, 1
In the text
NASA ADS
- Sparke, L. S., Kormendy, J., & Spinrad, H. 1980,
ApJ, 235, 755
In the text
NASA ADS
- Tantalo, R., Chiosi, C., Bressan, A., & Fagotto, F.
1996, A&A, 311, 361
In the text
NASA ADS
- Trager, S. C., Faber, S. M., Wortey, G., & González, J. J.
2000, AJ, 119, 1645
In the text
NASA ADS
- Trinchieri, G., & Di Serego Alighieri, S. 1991, AJ, 101, 1647
In the text
NASA ADS
- Worthey, G. 1994, ApJS, 95, 107
In the text
NASA ADS
- Yi, S., Demarque, P., & Oemler, A. 1997, ApJ, 486, 201
In the text
NASA ADS
- Yi, S., Demarque, P., & Oemler, A. 1998, ApJ, 492, 480
In the text
NASA ADS
- Zwicky, F., Herzog, E., Karpowicz, M., Kowal, C., & Wild, P.
1961-1968, Catalogue of Galaxies and of Cluster of Galaxies
(Pasadena, California Institute of Technology; CGCG)
In the text
Copyright ESO 2002