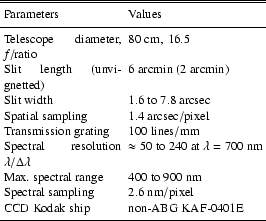
A&A 392, 231-237 (2002)
DOI: 10.1051/0004-6361:20020933
L. Arnold1 - S. Gillet2 - O. Lardière2 - P. Riaud2,3 - J. Schneider3
1 - Observatoire de Haute-Provence (OHP) CNRS, 04870
Saint-Michel-l'Observatoire, France
2 -
Laboratoire d'Interférométrie Stellaire et Exoplanétaire
(LISE) CNRS, 04870 Saint-Michel-l'Observatoire, France
3 -
Observatoire de Paris-Meudon, 92195 Meudon Cedex, France
Received 24 December 2001 / Accepted 6 May 2002
Abstract
We report spectroscopic observations (400-800 nm,
![]() )
of Earthshine in June, July and October 2001 from
which normalized Earth albedo spectra have been derived. The
resulting spectra clearly show the blue colour of the Earth due to
Rayleigh diffusion in its atmosphere. They also show the
signatures of oxygen, ozone and water vapour. We tried to extract
from these spectra the signature of Earth vegetation. A variable
signal (4 to
)
of Earthshine in June, July and October 2001 from
which normalized Earth albedo spectra have been derived. The
resulting spectra clearly show the blue colour of the Earth due to
Rayleigh diffusion in its atmosphere. They also show the
signatures of oxygen, ozone and water vapour. We tried to extract
from these spectra the signature of Earth vegetation. A variable
signal (4 to ![]() )
around 700 nm has been measured in
the Earth albedo. It is interpreted as being due to the vegetation
red edge, expected to be between 2 to
)
around 700 nm has been measured in
the Earth albedo. It is interpreted as being due to the vegetation
red edge, expected to be between 2 to ![]() of the Earth albedo
at 700 nm, depending on models. We discuss the primary goal of
the present observations: their application to the detection of
vegetation-like biosignatures on extrasolar planets.
of the Earth albedo
at 700 nm, depending on models. We discuss the primary goal of
the present observations: their application to the detection of
vegetation-like biosignatures on extrasolar planets.
Key words: astrobiology - stars: planetary systems
The search for life on extrasolar planets has become a reasonable goal since the discovery of Earth-mass planets around a pulsar (Wolszczan & Frail 1992) and Jupiter-mass planets around main-sequence stars (Udry & Mayor 2001). Although the detection of Earth-mass planets is not foreseen before space missions (like COROT scheduled for 2004, Schneider et al. 1998), it is likely that a significant proportion of main sequence stars have Earth-like companions in their habitable zone. An important question is what type of biosignatures will unveil the possible presence of life on these planets.
Spectral signatures can be of two kinds. A first type consists of biological activity by-products, such as oxygen and its by-product ozone, in association with water vapour, methane and carbon dioxide (Lovelock 1975; Owen 1980; Angel et al. 1986). These biogenic molecules present attractive narrow molecular bands. This led in 1993 to the Darwin ESA project (Léger et al. 1996), followed by a similar NASA project, Terrestrial Planet Finder (TPF, Angel & Woolf 1997; Beichman et al. 1999). But oxygen is not a universal by-product of biological activity as demonstrated by the existence of anoxygenic photosynthetic bacteria (Blankenship et al. 1995).
A second type of biosignature is provided by signs of stellar
light transformation into biochemical energy, such as the planet
surface colour from vegetation, whatever the bio-chemical details
(Labeyrie 1999). This must translates into the planet
reflection spectrum by some characteristic spectral features. This
signature is in principle a more general biomarker than any biogenic
gas such as oxygen, since it is a general feature of any
photosynthetic activity (here leaving aside chemotrophic
biological activity). Unfortunately, it is often not as sharp as
single molecular bands: although it is rather sharp for
terrestrial vegetation at
![]() nm (Clark 1999;
Coliolo et al. 2000, see Fig. 1), its wavelength
structure can vary significantly among bacteria species and plants
(Blankenship et al. 1995).
nm (Clark 1999;
Coliolo et al. 2000, see Fig. 1), its wavelength
structure can vary significantly among bacteria species and plants
(Blankenship et al. 1995).
![\begin{figure}
\par\includegraphics[width=8.8cm,clip]{vegetation.ps} \end{figure}](/articles/aa/full/2002/34/aa2230/img14.gif) |
Figure 1:
Reflectance spectra of photosynthetic (green) vegetation,
non-photosynthetic (dry) and soil (from Clark 1999).
The so-called vegetation red edge (VRE) is the green vegetation
reflectance strong variation from
|
| Open with DEXTER | |
Before initiating a search for extrasolar vegetation, it is useful to test if terrestrial vegetation can be detected remotely. This seems possible as long as Earth is observed with a significant spatial resolution (Sagan et al. 1993), but is it still the case if Earth is observed as a single dot? A way to observe the integrated Earth is to observe the Earthshine with the Moon acting like a remote diffuse reflector illuminated by our planet. It has been proposed for some time (Arcichovsky 1912) to look for the vegetation colour in the Earthshine to use it as a reference for the search of chlorophyll on other planets, but up to now, Earthshine observations apparently did not have sufficient spectral resolution for that purpose (Tikhoff 1914; Danjon 1928; Goode et al. 2001). We present in Sect. 3.1 normalized Earth albedo spectra showing several atmospheric signatures. We show in Sect. 3.2 how the vegetation signature around 700 nm can be extracted from these spectra.
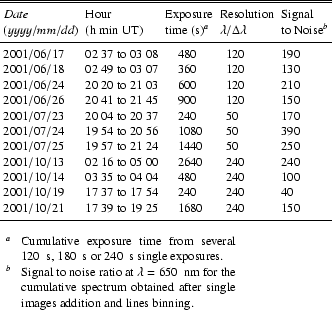
We have observed the Moon at ascending and descending phases from April to October 2001. Data collected in June, July and October (Table 2) have been of sufficient quality to derive the results described in this article.
Our observation procedure is the following. The long spectrograph slit allows
us to record simultaneously the Earthshine and sky background spectra (
![]() CCD lines for each). This single
exposure is bracketed by two spectra of the Moonlight. Each of the latter is
the mean of 10 spectra (totalling
CCD lines for each). This single
exposure is bracketed by two spectra of the Moonlight. Each of the latter is
the mean of 10 spectra (totalling
![]() )
taken in different regions to
smooth the Moon albedo spatial variations. A series of
flat fields (tungsten lamp) is recorded just after the previous cycle.
)
taken in different regions to
smooth the Moon albedo spatial variations. A series of
flat fields (tungsten lamp) is recorded just after the previous cycle.
Before getting a final spectrum from binning of CCD lines, a
sub-pixel alignment of CCD lines is done to correct the residual
angle between the pixel rows and the dispersion direction: Each
image is oversampled by a factor of 8 in the dispersion direction.
Each line i is then translated to maximize the cross-correlation
function from line i with line 1. After the line binning is
done, the spectrum is resampled with 1 nm/pixel for
convenience.
![\begin{figure}
\par\includegraphics[width=8.8cm,clip]{fig_albedo_0110+0107.ps} \end{figure}](/articles/aa/full/2002/34/aa2230/img28.gif) |
Figure 2:
Examples of measured Earth albedo spectra. Both spectra are
normalized to 1 at 600 nm, but the July spectrum is shifted upwards
by 0.5 for clarity. The spectral resolution was
|
| Open with DEXTER | |
Figure 2 shows that the Earth should be seen as a blue object from space. This blue colour has been known for a long time, and has been confirmed by the Apollo astronauts (Kelley 1988). Tikhoff (1914) had already discovered the blue colour of Earthshine and interpreted it as being due to the Rayleigh scattering in the atmosphere. This point will be discussed in more details in Sect. 3.2.
The H2O bands around 690 and 720 nm, and O2 narrower
band at 760 nm are clearly visible with a resolution of
![]() .
The slope variation occurring at
.
The slope variation occurring at
![]() nm is
partially the signature of the deepest zone of the broad ozone
absorption band (Chappuis band), going from 440 to 760 nm.
nm is
partially the signature of the deepest zone of the broad ozone
absorption band (Chappuis band), going from 440 to 760 nm.
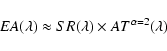
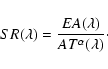
We obtained
![]() by the ratio of two mean
spectra
by the ratio of two mean
spectra
![]() taken at two different Moon elevations. This obviously
gives only a measure of the local atmosphere transmittance, whereas
taken at two different Moon elevations. This obviously
gives only a measure of the local atmosphere transmittance, whereas
![]() in Eq. (4) represents
a mean spectrum for the illuminated Earth seen from the Moon.
in Eq. (4) represents
a mean spectrum for the illuminated Earth seen from the Moon.
![\begin{figure}
\par\includegraphics[width=8.8cm,clip]{fig_spectre_atm26.ps} \end{figure}](/articles/aa/full/2002/34/aa2230/img34.gif) |
Figure 3:
An example of a measured
1-airmass atmospheric transmittance, after Rayleigh scattering
correction. H2O and O2 bands are obviously present, while
the broad ozone goes from 450 to 700 nm with maximum absorption
at
|
| Open with DEXTER | |
![\begin{figure}
\par\includegraphics[width=8.8cm,clip]{fit_ref_VRE_2_010624+26.ps} \end{figure}](/articles/aa/full/2002/34/aa2230/img35.gif) |
Figure 4:
An example of Rayleigh correction: the graph shows
the 24+26 June spectrum
|
| Open with DEXTER | |
Our measured
![]() is corrected for Rayleigh scattering
and is normalized to 1 airmass (Fig. 3). Then
Eq. (4) gives
is corrected for Rayleigh scattering
and is normalized to 1 airmass (Fig. 3). Then
Eq. (4) gives
The surface reflectance we obtain in practice from
Eq. (5) is shown in Fig. 4. The albedo
spectrum of the ocean is
![]() at 500 nm and decreases
smoothly to
at 500 nm and decreases
smoothly to
![]() at 750 nm (McLinden et al. 1997,
Fig. 4). But considering these values and the land
albedo from Fig. 1, associated with a typical cloud
cover of 50% for both ocean and land, it can be shown that the
higher Earth albedo in the blue in Fig. 2 cannot be
explained by the higher albedo of the ocean in the blue, but
rather by a contribution of Rayleigh diffusion in the atmosphere.
at 750 nm (McLinden et al. 1997,
Fig. 4). But considering these values and the land
albedo from Fig. 1, associated with a typical cloud
cover of 50% for both ocean and land, it can be shown that the
higher Earth albedo in the blue in Fig. 2 cannot be
explained by the higher albedo of the ocean in the blue, but
rather by a contribution of Rayleigh diffusion in the atmosphere.
Therefore
![]() does not represent the pure surface
reflectance, but includes uncorrected atmospheric scattering (for
simplicity, we nevertheless continue to name
does not represent the pure surface
reflectance, but includes uncorrected atmospheric scattering (for
simplicity, we nevertheless continue to name
![]() the
result of Eq. (5)). The Fig. 4 shows
the
result of Eq. (5)). The Fig. 4 shows
![]() fitted with the Rayleigh law
fitted with the Rayleigh law
![]() adjusted over the [500; 670 nm] window. The slope towards the blue
does not hide the relatively sharp vegetation signature, which
appears around 700 nm.
adjusted over the [500; 670 nm] window. The slope towards the blue
does not hide the relatively sharp vegetation signature, which
appears around 700 nm.
![]() is then normalized to the
Rayleigh fit (Fig. 5).
is then normalized to the
Rayleigh fit (Fig. 5).
![\begin{figure}
\par\includegraphics[width=8.8cm,clip]{fig_albedo-telluric010624+26.ps} \end{figure}](/articles/aa/full/2002/34/aa2230/img40.gif) |
Figure 5:
An example of data reduction sequence: the graph shows
the June albedo spectrum
|
| Open with DEXTER | |
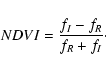
To quantify the vegetation signature, we define the Vegetation Red Edge (VRE) as
![\begin{figure}
\par\includegraphics[width=8.8cm,clip]{fig_albedo-telluric-all.ps} \end{figure}](/articles/aa/full/2002/34/aa2230/img43.gif) |
Figure 6:
Collection of
|
| Open with DEXTER | |
![\begin{figure}
\par\includegraphics[width=8.75cm]{fig_albedo-telluric-binned-all.ps} \end{figure}](/articles/aa/full/2002/34/aa2230/img44.gif) |
Figure 7:
The same collection of
|
| Open with DEXTER | |
We also verified that the second order spectrum pollution is negligible: it has been
measured to be ![]() at 760 nm,
at 760 nm, ![]() at 780 nm and
at 780 nm and ![]() at 800 nm.
at 800 nm.
To test our VRE measurements, we also measured the VRE on spectra
of Vega and the sunlit Moon, for which we obviously should have
![]() .
After standard bias, dark and flat corrections, the
data are calibrated with reference A0V and Sun spectra,
respectively, then flattened by normalization to a black body
curve. Vega spectra show a
.
After standard bias, dark and flat corrections, the
data are calibrated with reference A0V and Sun spectra,
respectively, then flattened by normalization to a black body
curve. Vega spectra show a
![]() .
We also used
the standard Moon albedo spectrum of Apollo16 sample 62 231
(Pieters 1999) to properly flatten the Moon data: we obtain
.
We also used
the standard Moon albedo spectrum of Apollo16 sample 62 231
(Pieters 1999) to properly flatten the Moon data: we obtain
![]() .
Therefore, we conclude that i) the VRE on these sources is measured to be
.
Therefore, we conclude that i) the VRE on these sources is measured to be ![]() ,
with
,
with
![]() ,
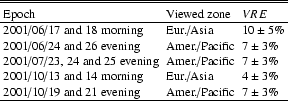
and ii) the VRE we measured in the Earth
albedo ranges between 4 and 10%, with a similar error of
,
and ii) the VRE we measured in the Earth
albedo ranges between 4 and 10%, with a similar error of
![]() (Table 3). In the June 17+18
spectrum, we probably have a larger error on the VRE due to the
lack of bracketing from Earthshine with Moonlight spectra
(Figs. 6 and 7).
(Table 3). In the June 17+18
spectrum, we probably have a larger error on the VRE due to the
lack of bracketing from Earthshine with Moonlight spectra
(Figs. 6 and 7).
These results are in agreement with estimations from models:
Des Marais et al. (2001) predict a vegetation signature of "![]() ,
maybe larger if a large forested
area is in view''. Preliminary estimates gave 5% (Schneider 2000a; Schneider 2000b), while
our model described hereafter predicts
,
maybe larger if a large forested
area is in view''. Preliminary estimates gave 5% (Schneider 2000a; Schneider 2000b), while
our model described hereafter predicts
![]() .
.
Only green lands observed by different Earth observing satellites show this spectral feature around 700 nm. It is thus legitimate to attribute our global VRE to the terrestrial vegetation. Let us investigate this hypothesis a little further.
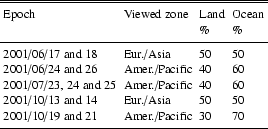
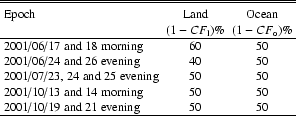
Table 4 shows which portion of the Earth is seen from the Moon at the time the observations were done. An important contribution to the Earth albedo comes from clouds. When clouds cover land without vegetation or an ocean area, its albedo adds to the general planet albedo, without suppressing the vegetation contribution, and simply reduces the global VRE. When clouds cover a forest region, the vegetation contribution to the VRE for that Earth region is removed. The global VRE thus obviously depends not only on the global cloud cover, but also on which regions are covered by clouds during the observation. We have therefore taken cloud cover images available from http://wwwghcc.msfc.nasa.gov/GOES/globalir.html for each of our observation dates and have estimated for each run of observation the fraction of land and ocean covered by clouds (Table 5).
One can a priori estimate the VRE from the albedo and
relative surfaces of ocean, land and cloud. Using Eq. (6),
the VRE can be written
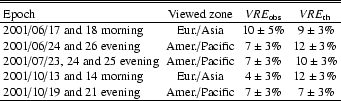
The resulting
![]() computed from the Earth phase seen from
the Moon (Table 4) and cloud cover (Table 5)
are given in Table 6. The denominator of
Eq. (8) represents an albedo, known to be 0.30 for the
Earth (Goode et al. 2001), and its value here ranges between
0.30 and 0.34 depending on the date of observation. The
computed from the Earth phase seen from
the Moon (Table 4) and cloud cover (Table 5)
are given in Table 6. The denominator of
Eq. (8) represents an albedo, known to be 0.30 for the
Earth (Goode et al. 2001), and its value here ranges between
0.30 and 0.34 depending on the date of observation. The
![]() values are in acceptable agreement with preliminary estimates of
5% (Schneider 2000a; Schneider 2000b), but are higher
than our observations. This partially comes from terrestrial limb
and directionality of the vegetation reflectance effects. The
latter are complicated (Privette et al. 1995;
Hapke et al. 1996), due for instance to mutual shadow effects
between trees.
values are in acceptable agreement with preliminary estimates of
5% (Schneider 2000a; Schneider 2000b), but are higher
than our observations. This partially comes from terrestrial limb
and directionality of the vegetation reflectance effects. The
latter are complicated (Privette et al. 1995;
Hapke et al. 1996), due for instance to mutual shadow effects
between trees.
Although it seems that the Earth's vegetation signature might be visible as a red edge at 700 nm, it is difficult to measure in the Earthshine for two reasons. The first reason is related to its variable amplitude, induced by a variable cloud cover and Earth phase. The second reason is because it is hidden below strong atmospheric bands which need to be removed to access the surface reflectance including the vegetation signature.
For the Earth, our knowledge of different surface reflectivities (deserts, ocean, ice etc.) help us to assign the VRE of the Earthshine spectrum to terrestrial vegetation. For an exoplanet, a VRE-like index might be as difficult to measure as for the Earth due to variable cloud cover of the planet. Even if an extrasolar planet would give a clear VRE-like spectral signal, its use as a biosignature would raise some questions because:
1/ For several organisms (such as Rhodopseudonomas, Blankenship et al. 1995) the "red edge'' is not at 700 nm, but at 1100 nm.
2/ Some rocks, like schists, may have a similar spectral feature. For instance,
spectra of Mars show a similar spectral feature at ![]() m, which
were erroneously interpreted as vegetation due to their similarity
with lichen spectra (Sinton 1957).
m, which
were erroneously interpreted as vegetation due to their similarity
with lichen spectra (Sinton 1957).
We nevertheless believe that, associated with the presence of water (and secondarily oxygen) and correlated with seasonal variations, a vegetation-like spectral feature would provide more insight than simply oxygen on the bio-processes possibly taking place on the planet. But since water, and thus clouds and rain, are essential for the growth of vegetation, extrasolar planets with a very low cloud cover and a corresponding high vegetation index are unlikely, more especially if the planet is seen pole-on, with a bright white polar cover. On the other hand, an extrasolar planet vegetation surface could be larger than on Earth (like during periods in the paleozoic and mesozoic eras on Earth for example).
One must also note that the measurement of an extrasolar planet VRE will not suffer from the intrinsic difficulty of the same
measurement for the Earth through the Earthshine spectrum: the
extrasolar planet albedo will simply be given by the ratio of
spectra
![]() .
But a model of the exoplanet
atmosphere is necessary to be able to remove the absorption bands
that may partially hide the vegetation. Although the probability is weak,
the planet may occult a background star, thus providing us a direct measurement
of the planet atmosphere absorption.
.
But a model of the exoplanet
atmosphere is necessary to be able to remove the absorption bands
that may partially hide the vegetation. Although the probability is weak,
the planet may occult a background star, thus providing us a direct measurement
of the planet atmosphere absorption.
The detection of a VREindex between 0 and 10% requires a photometric precision better
than 3%. Exposure time to achieve this precision with Darwin/TPF
on an Earth-like planet at 10 pc with a spectral resolution of
25 is of the order of 100 h based on recent simulations
(Riaud et al. 2002).
 |
Finally, the Earth albedo spectral variations study is of interest for global Earth observation. It might provide data on climate change, as broad-band measurements recently showed (Goode et al. 2001). We also think that the spectrum of Earthshine might be used for example to monitor the global ozone (with the Chappuis or Huggins bands).
During the submission of the paper, we have been informed of a similar work by Woolf et al. (2002).
Acknowledgements
We are grateful to P. François who took test spectra of the Earthshine in 1999. We thank Ph. Gastellu-Etchegorry for providing us Earth observation satellite data. We also thank C. Prigent, L. Beaufort, G. Bellucci, D. Gillet, S. Le Mouélic, A. Labeyrie, J. M. Perrin and referee S. Franck for constructive remarks about this work. F. Valbousquet from Optique et Vision lent us some parts for the spectrograph.