Our sample covers a wide range of effective radii, varying from less than 1 kpc for very compact objects to about 9 kpc for the more extended ones; typical values are between 4 and 6 kpc. The effective brightness is distributed from 18 to 22 mag arcsec-2, being concentrated between 19.0 and 20.5 mag arcsec-2.
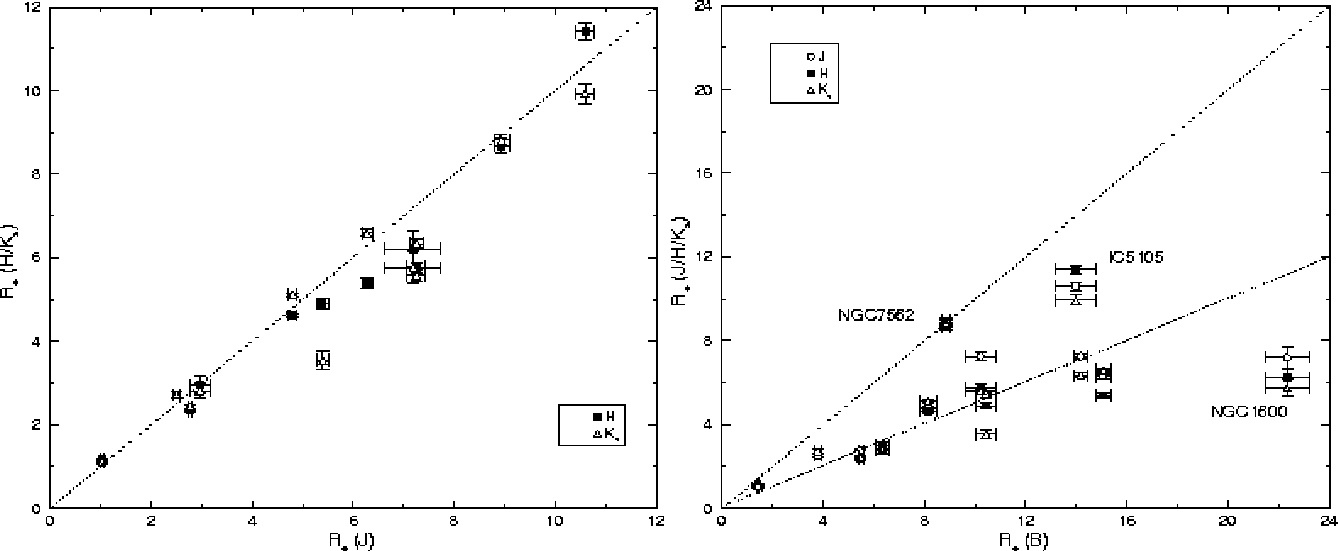 |
Figure 3:
left: comparison between |
Figure 3 (left) presents the comparison between effective radii for J,
H and ![]() .
We note little variation of effective radius in
the three bands. We have also obtained from de Vaucouleurs (1991), for
these galaxies, the effective radii determined from B band photometry,
which we compared with those obtained in this paper. The comparison is shown in
Fig. 3 (right). Despite the considerable dispersion,
there is a strong tendency of the
effective radii in B to be higher, by a factor of nearly 2, than the corresponding
infrared effective radii. This result is compatible with that found by Pahre et al.
(1998), who compared effective radii in V and K bands, finding a tendency of
effective radii to be higher for shorter wavelengths. Some objects do not follow this tendency;
NGC 7562 and IC 5105 are dislocated in the sense of smaller radii in B, while
NGC 1600 goes in the opposite sense. This effect could be interpreted as being due to differences
in the stellar population distribution
that contributes to each band. The fact that the B-band effective radii are higher than
its near-IR counterparts shows that the stellar population that dominates near-IR emission
is more concentrated towards the central regions than the bluer one.
.
We note little variation of effective radius in
the three bands. We have also obtained from de Vaucouleurs (1991), for
these galaxies, the effective radii determined from B band photometry,
which we compared with those obtained in this paper. The comparison is shown in
Fig. 3 (right). Despite the considerable dispersion,
there is a strong tendency of the
effective radii in B to be higher, by a factor of nearly 2, than the corresponding
infrared effective radii. This result is compatible with that found by Pahre et al.
(1998), who compared effective radii in V and K bands, finding a tendency of
effective radii to be higher for shorter wavelengths. Some objects do not follow this tendency;
NGC 7562 and IC 5105 are dislocated in the sense of smaller radii in B, while
NGC 1600 goes in the opposite sense. This effect could be interpreted as being due to differences
in the stellar population distribution
that contributes to each band. The fact that the B-band effective radii are higher than
its near-IR counterparts shows that the stellar population that dominates near-IR emission
is more concentrated towards the central regions than the bluer one.
One of the most important constraints on early-type galaxy formation and evolution is the existence the three-parametric scaling relation called the Fundamental Plane (FP) relation (Djorgovski & Davis 1987), which is mostly defined for the optical bands. This relation covers a wide range of magnitudes and is, as far as we can see, independent of the environment. The very existence of this relation, which presents a very low scatter, must reflect an important regularity in the evolutive stories of early-type systems, be they dominated by dissipative collapse or not.
From 2.2 ![]() m photometry of elliptical galaxies of the Coma cluster,
Mobascher et al. (1999) found that it is possible to define for
the same sample the FP
in the near-infrared, with a similar dispersion as in the optical
bands. Since our work presents a) the first near-infrared data available for
several objects, b) observations in three photometric bands, and c) a sample
not limited to a specific environment, we found it interesting to analyze
the behavior of our sample in relation to the FP. One can express the FP, in
terms of the structural parameters and the central velocity dispersion
m photometry of elliptical galaxies of the Coma cluster,
Mobascher et al. (1999) found that it is possible to define for
the same sample the FP
in the near-infrared, with a similar dispersion as in the optical
bands. Since our work presents a) the first near-infrared data available for
several objects, b) observations in three photometric bands, and c) a sample
not limited to a specific environment, we found it interesting to analyze
the behavior of our sample in relation to the FP. One can express the FP, in
terms of the structural parameters and the central velocity dispersion ![]() ,
as
,
as
| (4) |
We have used the central velocity dispersion for our objects from the catalogue
of Prugniel & Simien (1996). A least-square method was applied in
determining the best-fit regression. We considered the uncertainties in ![]() and
and
![]() as independent quantities, because the correlation coefficient between
these quantities is small and largely dependent upon only one point (NGC 1600).
We obtained the following relations:
as independent quantities, because the correlation coefficient between
these quantities is small and largely dependent upon only one point (NGC 1600).
We obtained the following relations:
| (5) | |||
| |
(6) | ||
| |
(7) |
The a values are in agreement with the average determinations of this constant (Mobasher et al. 1999; Milvang-Jensen 1997). The b values are stable, and near to 0.40. Scodeggio et al. (1998) analyzed the wavelength dependence of the FP parameters for BVrIHK bands, including a correction for completeness of the samples, and discovered that the a values are strongly wavelength-dependent, varying from 1.13 in B to 1.51 to K, while the b values are constant and near to 0.35. While our a values are compatible with those of Scodeggio, the b values are higher by nearly 20%.
Figure 4 shows edge-on views of the Fundamental Plane for J, H and ![]() .
Although
the relationship is built on a small number of point (12 for J and
.
Although
the relationship is built on a small number of point (12 for J and ![]() ,
10 for H), that
causes the rms
scatter of these relations to be relatively high (0.20 dex for J and H, and 0.23 dex for
,
10 for H), that
causes the rms
scatter of these relations to be relatively high (0.20 dex for J and H, and 0.23 dex for ![]() ),
the FP is well defined in the three bands. The galaxy mostly off the correlation in the
three bands (below the line of correlation) is NGC 1400, which is the most compact galaxy of our sample.
We conclude therefore that for our sample of objects from different environments, in a 3-band
near-infrared photometry, the Fundamental Plane is well defined.
),
the FP is well defined in the three bands. The galaxy mostly off the correlation in the
three bands (below the line of correlation) is NGC 1400, which is the most compact galaxy of our sample.
We conclude therefore that for our sample of objects from different environments, in a 3-band
near-infrared photometry, the Fundamental Plane is well defined.
In order to analyze the integrated stellar population dominating the infrared luminosity of our galaxies, we compared our data with typical infrared colors of globular clusters. Infrared colors of globular clusters from the Magellanic Clouds and from M 31 are represented in Fig. 4. Data for Magellanic Clouds clusters are from Persson et al. (1983); Andromeda Galaxy clusters are from Frogel et al. (1980) (Galactic clusters are distributed in the same region delimited by Andromeda Galaxy cluster; see Aaronson et al. 1978). Magellanic Clouds clusters presented here are divided into two groups (Searle et al. 1980): types II-III are rich in red supergiant and AGB luminous stars, which dominate its infrared colors; in types IV-VI, the contribution of AGB stars is still stronger, especially that of carbon stars.
We can see that the integrated colors of the galaxies of our sample, with some exceptions, are compatible with populations like those found in the more metal-rich clusters of the Andromeda galaxy and of our own Galaxy. In all cases, populations like those found in extremely red clusters of the Magellanic Clouds, which are dominated by giant stars of the asymptotic branch, can be ruled out. For galaxies NGC 7192, NGC 7562 and NGC 7619, the infrared colors are dominated by less metal-rich populations, compatible with the average colors of globular clusters of the Galaxy.
![\begin{figure}
\par\includegraphics[width=9cm,clip]{MS2620f50.eps} %
\end{figure}](/articles/aa/full/2002/32/aa2620/img182.gif) |
Figure 5: Flux ratios from integrated isophotal colors compared to globular clusters. Beneath the dashed line, types II-III clusters are concentrated; types IV-VI are scattered by the whole diagram, but are more concentrated above the dashed line. The dashed circle indicates the average colors of the sample of E/S0 galaxies from Frogel et al. (1978). |
Copyright ESO 2002
![\begin{figure}
\par\includegraphics[width=7.5cm,clip]{MS2620f49.eps}\end{figure}](/articles/aa/full/2002/32/aa2620/img176.gif)